Section 54. t-TestPaired
54. t-TestPairedOverviewThe Paired t-Test is used to compare two samples against each other, where a data point from each set need to be considered together in pairs. For example, a Team might need to determine if two operators are quoting the same price for packages of products or services. It makes no sense to compare the average of all the quotes for Operator 1 to the average of all the quotes for Operator 2. Each package quote needs to be examined separately, hence making paired comparisons of Operator 1's quote for the package and Operator 2's quote for the package. A data sample is taken for each Operator of, for example, 25 points to make the judgment and the result would be the likelihood that both operators' quotes (as work continues) are the same. It is interesting to see that this is not really like a 2-Sample t-Test at all, it is only a 1-Sample t-Test in disguise. A sample of data points (lower curve) is generated from the two processes (the populations of all data points, upper curves) by taking the difference between them, as shown in the left side of Figure 7.54.1. If the two parent populations are identical, then the differences between the pairs are all zero. In reality, there is always some variation, but the mean of the population of differences would still be centered on zero. Thus a 1-Sample t-Test is applied to the sample of differences (right side of Figure 7.54.1) and from the characteristics of the samples (mean Figure 7.54.1. Graphical representation of a Paired t-Test.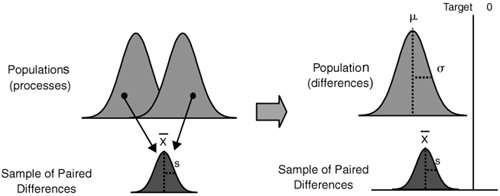 RoadmapThe roadmap here is exactly the same as the 1-Sample t-Test, but applied instead to the differences between each pairing in the sample data sets. The Target Value in this case is zero. The hypotheses are
Go to "t-Test1-Sample" in this chapter. |
 standard deviation s, and sample size n), an inference is made on the location of the population mean μ relative to the target zero. The result is a degree of confidence (a p-value) that the sample had come from a population with a mean μ of zero.
 0
0EAN: 2147483647
Pages: 138
- ERP Systems Impact on Organizations
- Enterprise Application Integration: New Solutions for a Solved Problem or a Challenging Research Field?
- Intrinsic and Contextual Data Quality: The Effect of Media and Personal Involvement
- A Hybrid Clustering Technique to Improve Patient Data Quality
- Development of Interactive Web Sites to Enhance Police/Community Relations
- Step 1.2 Install SSH Windows Clients to Access Remote Machines Securely
- Step 3.1 Use PuTTY as a Graphical Replacement for telnet and rlogin
- Step 3.2 Use PuTTY / plink as a Command Line Replacement for telnet / rlogin
- Step 4.7 Using Public Key Authentication for Automated File Transfers
- Step 6.2 Using Port Forwarding Within PuTTY to Read Your E-mail Securely