13.4 Oracle Enterprise Manager
|
| < Day Day Up > |
|
Oracle Enterprise Manager (OEM) comes bundled with the Oracle Enterprise Edition and can be installed on the same node as the database server or can be installed separately on another machine, which is the preferred approach. For example, if the database server is on a Unix operating system, OEM could very well be installed on this machine. However, due to the more textual nature of the operating system, invoking the GUI interface of OEM would require some emulation tools such as X-Windows. Due to this dependency and the unfriendly nature, OEM is normally installed as two separate tiers, the OEM repository and the OEM console/client. While the client is normally installed on a Windows-based workstation, the repository could be installed on any operating system, including Unix.
OEM can be installed from the Oracle Universal Installer (OUI) by selecting the Oracle 9i Management and Integration option.
OEM comprises a three-tier configuration: the target database that needs to be controlled or monitored from OEM, the middle tier or the management server (also called the repository) where all the target database information is collected and stored, and the client or console tier used to display the information.
The repository is used to capture and store information pertaining to the target tier. The front tier is the console and is used to monitor the database (target tiers) via the management server, or directly using the local tnsnames.ora file. If the direct approach is used, it bypasses the management server and the tool only supports the basic functionality such as database administration. Storing the information in the management server provides additional functionality, such as sending a page to a DBA when any alert is encountered and collecting target tier statistics when the DBA is not monitoring the console for historical information.
The target tier comprises the instance, the database, and the intelligent agent that runs in the background and helps communicate database- related information back to the server. The intelligent agent also contains a data gatherer that is used to gather data on a continuous basis even when no-one is monitoring the console.
Figure 13.2 illustrates the OEM component architecture. It represents the three-tier configuration consisting of the console or the user interface tier, middle tier or the management server tier, and the end tier or the target database tier. The end tier can consist of multiple databases and instances across one or more environments and locations that the OEM will monitor and manage. OEM also supports each target tier being on different operating systems.
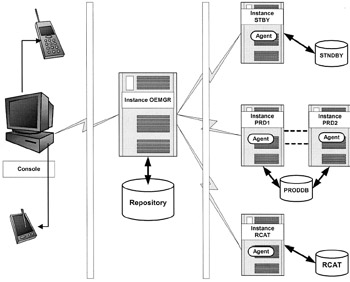
Figure 13.2: OEM components.
OEM provides a good deal of troubleshooting opportunities, provided the product has been configured correctly. Compared to the single stand- alone configuration, installation and configuration of OEM for troubleshooting and monitoring a clustered database environment requires certain additional processes.
13.4.1 Installation
To install the OEM console tier and the middle tier, using the OUI, the Oracle 9i Management and Integration option is selected, as shown in Figure 13.3. This screen lists the available products that come bundled with the Enterprise Edition of the database server.
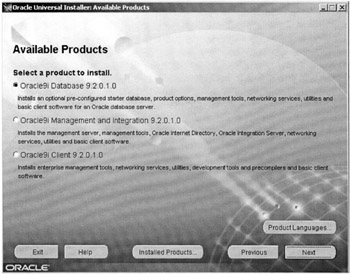
Figure 13.3: Installation product selection.
Once this option is selected, the next screen appears (Figure 13.4), which contains more specific installation options such as the Oracle Management Server and Oracle Internet Directory. The Oracle Management Server is selected to install the OEM repository and the console. Depending on the product that is to be installed, the appropriate option is selected or, by selecting the custom option, Oracle provides the option to install one or all the products.
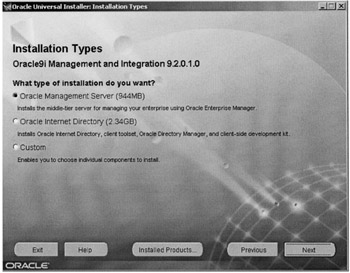
Figure 13.4: OEM installa tion type selection.
| Note | Installation of the Oracle Internet Directory is not directly related to configuration and performance tuning of RAC and hence is not discussed. |
After the selection of this option, OEM is installed along with the client portion of the product. After the basic installation of the product, the next set of screens help in the configuration of the management server.
Figure 13.5 shows the management server configuration assistant. In this screen the information pertaining to the credentials of the management server, including the host name/address and repository owner's informa tion, is entered.
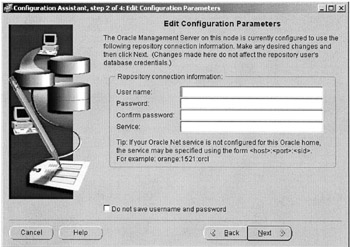
Figure 13.5: Management server configuration.
Through a series of similar configuration screens the management server is installed.
13.4.2 Configuring OEM for RAC
The management server should be able to discover the existence of the various databases that are to be managed via OEM. While discovering and managing individual instances could be as easy as telling the Enterprise Manager of the node information, such as the IP address of the node or the node name, on which the databases reside, selecting and configuring a clustered database requires additional steps.
| Note | If these additional steps are not followed, the database and the multiple instances will not be visible to OEM as a clustered database, but rather as one instance with the database attached to it and the others as separate instances. |
Prerequisite
Prior to configuration of the various products required for the discovery of the clustered database, it is required that the RAC database and the other subcomponents listed in Chapter 8 (Installation and Configuration) have been installed and configured.
Configuring the agent
The intelligent agent is a primary component for the discovery of both a stand-alone configuration and a clustered configuration of the database. The agent is installed by invoking the agent control (agentctl) utility available in the ORACLE_HOME/bin directory on the database server machine. The following are the steps for installing and configuring the agent:
-
The agent needs visibility of all nodes containing the instances participating in the clustered database configuration. This can be verified on most Unix platforms with the following command:
ora-db1:RAC1:oracle # lsnodes ora-db1.summerskyus.com ora-db2.summerskyus.com ora-db1:RAC1:oracle #
-
The next step is to verify if the database has been configured to be in a clustered state, that is, the database and all instances have been mapped to each other in the server control utility provided by Oracle as part of RAC. This can be verified on most Unix platforms with the following command:
ora-db2:RAC2:oracle # srvctl status database -d PRODDB Instance RAC1 is running on node ora-db1.summerskyus.com Instance RAC2 is running on node ora-db2.summerskyus.com
-
The listener should be aware of all the instances participating in the clustered configuration. This is verified with the following command:
ora-db1:RAC1:oracle # lsnrctl status LSNRCTL for Solaris: Version 9.2.0.2.0 - Production on 06-DEC-2002 11:57:30 Copyright (c) 1991, 2002, Oracle Corporation. All rights reserved. Connecting to (DESCRIPTION=(ADDRESS=(PROTOCOL=IPC)(KEY=EXTPROC))) STATUS of the LISTENER ------------------------ Alias LISTENER Version TNSLSNR for Solaris: Version 9.2.0.2.0 - Production Start Date 22-NOV-2002 00:36:11 Uptime 3 days 16 hr. 54 min. 21 sec Trace Level Off Security OFF SNMP OFF Listener Parameter File /apps/oracle/product/9.2.0/network/admin/ listener.ora Listener Log File /apps/oracle/product/9.2.0/network/log/listener. log Listening Endpoints Summary... (DESCRIPTION=(ADDRESS=(PROTOCOL=ipc)(KEY=EXTPROC))) (DESCRIPTION=(ADDRESS=(PROTOCOL=tcp)(HOST= (ora-db1)(PORT=1521))) Services Summary... Service "PLSExtProc" has 1 instance(s). Instance "PLSExtProc", status UNKNOWN, has 1 handler(s) for this service... Service "RAC1" has 1 instance(s). Instance "RAC1", status UNKNOWN, has 1 handler(s) for this service... Service "RAC1.summerskyus.com" has 1 instance(s). Instance "RAC1", status READY, has 1 handler(s) for this service... Service "PRODDB" has 1 instance(s). Instance "PRODDB", status UNKNOWN, has 1 handler(s) for this service... Service "PRODDB.SUMMERSKYUS.COM" has 1 instance(s). Instance "RAC1", status READY, has 1 handler(s) for this service... The command completed successfully ora-db1:RAC1:oracle #
In the above output, of the two instances participating in the clustered configuration the listener has registered only one instance.
This is because the following two parameters have not been configured.
The LOCAL_LISTENER and REMOTE_LISTENER parameters point to their respective host names as illustrated below:
RAC1.local_listener="(ADDRESS=(PROTOCOL=TCP) (HOST=ora-db1.summerskyus.com)(PORT=1521))" RAC1.remote_listener="(ADDRESS=(PROTOCOL=TCP) (HOST=ora-db2.summerskyus.com)(PORT=1521))"
LOCAL_LISTENER is the listener for the local instance and REMOTE_LISTENER is the listener on the remote instance(s) participating in the clustered configuration. On implementations with two or more instances, there would be multiple remote listener parameter definitions.
It is good to set these parameters in the parameter file so that they register automatically during startup and shutdown of instances. However, these parameters can be set dynamically using the following commands:
ALTER SYSTEM SET LOCAL_LISTENER="(ADDRESS=(PROTOCOL=TCP) (HOST=ora-db1.summerskyus.com)(PORT=1521))" ALTER SYSTEM SET REMOTE_LISTENER="(ADDRESS=(PROTOCOL=TCP) (HOST=ora-db2.summerskyus.com)(PORT=1521))"
Once these parameters have been set with the appropriate values, the listener will register the remote instances.
| Note | Registration does not occur until the next time the PMON discovery routine executes. By default, this happens at 60-second intervals. This normally occurs when a listener is started after the Oracle instance and every time that listener fails and is restarted. The 60-second delay can be overridden using the system-level SQL statement ALTER SYSTEM REGISTER. This statement forces PMON to register the service immediately. |
Checking the status of the listener again will reveal all instances participating in the clustered configuration having registered with the local listener on the local instance:
ora-db1:RAC1:oracle # lsnrctl status LSNRCTL for Solaris: Version 9.2.0.2.0 - Production on 06-DEC-2002 11:59:30 Copyright (c) 1991, 2002, Oracle Corporation. All rights reserved. Connecting to (DESCRIPTION=(ADDRESS=(PROTOCOL=IPC)(KEY=EXTPROC))) STATUS of the LISTENER ------------------------ Alias LISTENER Version TNSLSNR for Solaris: Version 9.2.0.2.0 - Production Start Date 06-DEC-2002 11:54:20 Uptime 0 days 0 hr. 5 min. 10 sec Trace Level OFF Security OFF SNMP OFF Listener Parameter File/apps/oracle/product/9.2.0/network/admin/listener. ora Listener Log File/apps/oracle/product/9.2.0/network/log/listener.log Listening Endpoints Summary... (DESCRIPTION=(ADDRESS=(PROTOCOL=ipc)(KEY=EXTPROC))) (DESCRIPTION=(ADDRESS=(PROTOCOL=tcp)(HOST=ora-db1) (PORT=1521))) Services Summary... Service "PLSExtProc" has 1 instance(s). Instance "PLSExtProc", status UNKNOWN, has 1 handler(s) for this service... Service "RAC1" has 1 instance(s). Instance "RAC1", status UNKNOWN, has 1 handler(s) for this service... Service "RAC1.summerskyus.com" has 1 instance(s). Instance "RAC1", status READY, has 1 handler(s) for this service... Service "RAC2.summerskyus.com" has 1 instance(s). Instance "RAC2", status READY, has 1 handler(s) for this service... Service "PRODDB" has 1 instance(s). Instance "PRODDB", status UNKNOWN, has 1 handler(s) for this service... Service "PRODDB.SUMMERSKYUS.COM" has 2 instance(s). Instance "RAC1", status READY, has 1 handler(s) for this service... Instance "RAC2", status READY, has 1 handler(s) for this service... The command completed successfully ora-db1:RAC1:oracle #
| Oracle 9i | New Feature: LOCAL_LISTENER and REMOTE_LISTENER parameters are new in Oracle 9i Release 1. In this release, these parameters can only be defined by setting them in the init<SID>.ora file and these parameters take effect during instance startup. Oracle Release 2 has provided dynamic configuration of these parameters using the ALTER SYSTEM SET REMOTE_LISTENER command. |
-
The GSD should also be available for the intelligent agent to have visibility to the clustered database configuration. This is verified using the following command:
ora-db2:RAC2:oracle # gsdctl stat GSD is running on the local node
-
The tnsnames.ora file on the database server should be set up and configured to provide visibility to all instances.
-
Once all the above agents and daemons have been verified, the intelligent agent can be started. This can be done with the following command:
ora-db1:RAC1:oracle # agentctl start DBSNMP for Solaris: Version 9.2.0.1.0 - Production on 06-DEC-2002 11:55:24 Copyright (c) 2002 Oracle Corporation. All rights reserved. Starting Oracle Intelligent Agent...... Agent started
Another component that is required by the management server for collecting database statistics is the data gatherer.
| Oracle 9i | New Feature: In prior versions of Oracle, the data gatherer was configured as a separate daemon process on the database server. In Oracle 9i, the data gatherer is part of the intelligent agent and is installed and started when the agent is started. |
| Note | Verification and configuration of all the above components is to be performed on all nodes participating in the clustered configuration. Once this is completed, the clustered database and the corresponding instances can be discovered via OEM. Steps required for configuration, starting, and stopping of the intelligent agent have been discussed in Chapter 8 (Installation and Configuration). Figure 13.6 illustrates the selection and discovery of the instances of an Oracle database. |
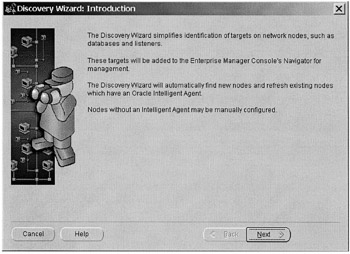
Figure 13.6: OEM Node Discovery Wizard.
Performance manager
Apart from the database administration and maintenance functionality, OEM also contains the performance manager (this feature requires the Performance and tuning pack to be installed). In version 9i, Oracle has enhanced OEM to provide visibility to a clustered database.
Database health screen
This health screen provides a complete view on the overall health of the database. The summary screen contains views to the CPU, memory and disk usage charts. The bottom of the screen displays information containing the various wait statistics, including waits across the cluster interconnects.
Figure 13.7 is a screen capture of the OEM database performance overview chart for a single instance. This chart provides overall performance characteristics of the instance being monitored. These characteristics are displayed based on threshold parameters defined for each view. This requires that the DBA be familiar with their values under normal and peak load conditions so that an appropriate value can be determined for what constitutes an abnormal condition. Once the appropriate thresholds have been set in the performance overview chart, any time poor throughput or response time is reported, the appropriate area will be flagged red. For example in Figure 13.7, the database memory chart has been flagged red, which indicates that the efficiency of the buffer has gone below the threshold value defined for this area. This will point the DBA in the right direction for diagnosing the problem.
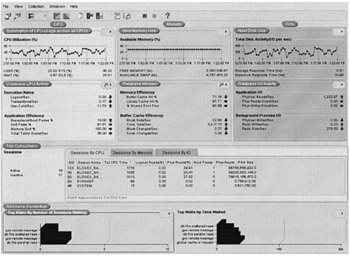
Figure 13.7: OEM Database performance overview chart.
While this screen provides an overall health of the database, individual performance views could be drilled down to get more finite information on certain performance issues.
CPU utilization chart Figure 13.8 provides the CPU utilization chart of all CPUs on the system. The view provides breakdown charts on CPU utilization by user processes, system calls, idle time, and wait time encountered by the instance. The chart indicates that the node has four CPUs and each CPU is 60% idle. The user activity on this system only measures about 20% of the total workload. The CPU chart could be further drilled down by individual processes and or sessions that are currently utilizing CPU on the node.
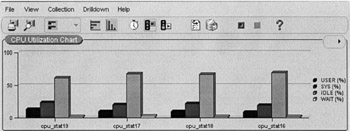
Figure 13.8: OEM CPU utilization chart.
File I/O rate chart Figure 13.9 illustrates the file I/O rate on the current instance. Since this is an instance-specific view, it does not reflect the I/O activity of the entire system. Data from the I/O activity could be saved for historical purposes and could be used to determine user patterns on the system, such as what part of the day or which day of the week or month the I/O activity is the highest. This is obtained by preparing a trend analysis.
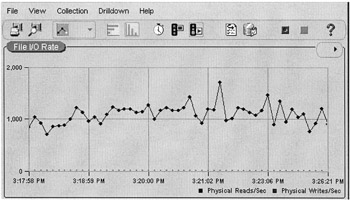
Figure 13.9: OEM file I/O rate chart.
Global cache CR request This chart is a drilldown from the database health overview chart and displays the global cache CR request wait event activity. This event is only visible in a RAC environment where more than one instance is configured to be active. This event reflects interconnect traffic activity and validates the functioning of cache fusion technology in RAC.
Figure 13.10 illustrates the global cache activities across the cluster interconnect. High activity on this chart could indicate potential latency issues, badly performing queries, or mixed access user patterns where users are requesting the same information from various instances, causing high global cache activity while sharing information.
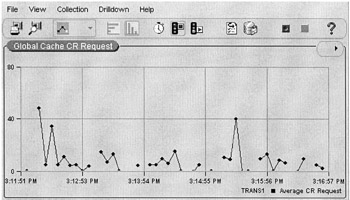
Figure 13.10: OEM global cache CR request activity chart.
|
| < Day Day Up > |
|
EAN: 2147483647
Pages: 174