7 - Assessing Glycemic Control Using Home Blood Glucose Monitoring, Continuous Glucose Sensing, and Glycated Hemoglobin Testing
Authors: Unger, Jeff
Title: Diabetes Management in the Primary Care Setting, 1st Edition
Copyright 2007 Lippincott Williams & Wilkins
> Table of Contents > 7 - Assessing Glycemic Control Using Home Blood Glucose Monitoring, Continuous Glucose Sensing, and Glycated Hemoglobin (A1C) Testing
function show_scrollbar() {}
7
Assessing Glycemic Control Using Home Blood Glucose Monitoring, Continuous Glucose Sensing, and Glycated Hemoglobin (A1C) Testing
If you cannot measure it, you cannot improve it.
Lord Kelvin, 1824 1907
Take Home Points
Fine-tuning diabetes therapy in the office setting may be accomplished efficiently and effectively using computerized home blood glucose monitoring software.
Home blood glucose monitoring is an inexpensive and readily available technology that is much more reliable than handwritten glucose logs.
Although the American Diabetes Association (ADA) provides no recommendations for frequency of home blood glucose monitoring for patients with type 2 diabetes mellitus (T2DM), monitoring should be performed often enough to identify those individuals who are experiencing daily glycemic variability, regardless of their overall glycated hemoglobin (A1C) levels.
Both the chronic and sustained levels of hyperglycemia as well as the acute daily fluctuations of glucose levels are important factors in managing diabetes. The degree of chronic hyperglycemia is determined by A1C testing.
Continuous glucose sensing and frequent blood glucose monitoring are useful tools to minimize glycemic variability and reduce A1C levels.
A novel 1,5 AG (anhydroglucitol) test may be helpful in assessing postprandial glycemic control. When used in patients with A1C level greater than 8%, rapid improvement in A1C levels can occur.
Many clinical variables may affect the reliability of both A1C and self-monitoring blood glucose testing.
The improvement in long-term glycemic control in patients with type 1 diabetes mellitus (T1DM) and T2DM using point-of-service A1C testing exceeds that which occurs when laboratory A1C testing is used.
P.322
Case 1
A 55-year-old attorney presents to the office for a follow-up visit. Four weeks after beginning insulin pump therapy, she is concerned that the wide glycemic swings in her blood glucose levels suggest that her diabetes is poorly controlled. You are presented with a written log depicting multiple blood glucose readings taken by the patient at different times of the day (Fig. 7-1). The time required to assess and interpret such a large amount of disjointed information is bound to lead to frustration on behalf of both the patient, who is attempting her best to record the requested data, and the physician who is unable to find any useful patterns to target for improved glycemic control.
The patient is therefore provided with a new meter that has computerized downloading capabilities and is advised to check her blood glucose levels fasting, before each meal, 2 hours after eating, and at bedtime. Glucose levels are stored in the meter memory, so that handwritten logs are no longer necessary.
When the patient returns in 4 weeks, her meter is downloaded by the medical assistant while a point-of-service test records a glycated hemoglobin (A1C) of 7.8% within 5 minutes. The physician explains that an A1C of less than 8.3% suggests that postprandial hyperglycemia becomes the major contributor to the overall level of glycemic control.2 Therefore, we must attempt to improve the postprandial glucose readings in order to move the patient closer toward the A1C target of lower than 7%. The patient confesses that she had not been using her physiologic bolus in the morning because she is always rushed. She now understands the necessity of setting a combination bolus consisting of both immediate and prolonged insulin delivery over 2 to 3 hours. Because of this single change, the patient's A1C in 4 months falls to 6.8% with less than 1% of her glucose values being lower than 60 mg per dL.
Self blood glucose monitoring (SBGM) allows patients to take charge of their own diabetes management. Interpretation of the data obtained from SBGM can be used by the physician or diabetes educator to suggest means by which glycemic control may be fine-tuned over time to achieve the lowest and safest possible A1C.
SBGM systems were first marketed in 1978 and ushered in an era of unprecedented therapeutic innovation in diabetes care.3 With the development of blood glucose meters, patients could begin to adjust the dose of their insulin to achieve as near physiologic control as possible. Patients with type 2 diabetes (T2DM) could modify carbohydrate intake and exercise to also achieve better glycemic control. The American Diabetes Association (ADA) advises most people with diabetes to maintain blood glucose levels as close to normal as possible.4 Frequent blood glucose monitoring by itself does not influence glycemic control. The data obtained by the patient must be interpreted by
P.323
healthcare professionals so that the patient can be guided toward safer and more targeted glycemic control.
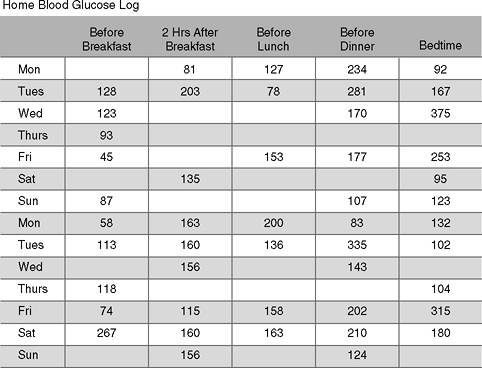 |
Figure 7-1 How Might Your Interpretation of This Patient's Hand-written Glucose Log Lead Toward Improvement in Her Glycemic Control? This insulin pump patient presents to the office with this self-generated blood glucose log. At the time of her office visit, she expects her management team to suggest changes in her treatment regimen that could improve her glycemic variability. However, prescribing any changes in treatment would be purely speculative without the assistance of a computer-generated statistical analysis. Those clinicians who prefer to adjust treatment based on handwritten logs might have some success at improving glycemic control by following these basic steps in pattern recognition and management: (a) identify the target blood glucose levels before and after meals (i.e., 80 to 120 mg per dL premeal and <140 mg per dL 2 hours after eating); (b) perform self blood glucose monitoring (SBGM) at the same time each day. Record any factors that can possibly influence the blood glucose levels, such as timing of the test in relation to meals, carbohydrate intake, drug dose, activity level, and illness; (c) look for patterns of glucose values above or below target range on 3 or more consecutive days, or low readings lasting 2 days; (d) evaluate whether influencing factors may account for the glycemic pattern; and (e) take action if a consistent pattern of glucose levels above or below a target is identified. |
Despite the large number of meters on the market and their simplicity, some large teaching centers still report that 31% of their patients have A1C levels that exceed 9.5%.5 One possible way to improve our patients' A1C levels is to teach primary care physicians the value of home blood glucose monitoring downloading software systems. Almost all blood glucose meters have software systems that can analyze numerous test results, allowing physicians to track and modify glycemic trends (Table 7-1).
P.324
P.325
TABLE 7-1 Blood Glucose Meters and Data Management Systems | ||||||||||||||||||||||||||||||||||||||||||||||||||||||||||||||||||||||||||||||||||||||||||||||||||
|---|---|---|---|---|---|---|---|---|---|---|---|---|---|---|---|---|---|---|---|---|---|---|---|---|---|---|---|---|---|---|---|---|---|---|---|---|---|---|---|---|---|---|---|---|---|---|---|---|---|---|---|---|---|---|---|---|---|---|---|---|---|---|---|---|---|---|---|---|---|---|---|---|---|---|---|---|---|---|---|---|---|---|---|---|---|---|---|---|---|---|---|---|---|---|---|---|---|---|
| ||||||||||||||||||||||||||||||||||||||||||||||||||||||||||||||||||||||||||||||||||||||||||||||||||
P.326
Before using a new meter, patients must make certain that the date and time on the device is correct for accurate downloading. Patients can purchase the software for meter downloading directly from the meter companies or download the software from the meter Web sites. The data could then be presented to the physician at the time of the visit. Most meter companies would be pleased to install their software free of charge in physicians' offices and train the staff on data interpretation. Although many meter companies would love to have the physician's business, one should find two or three that would offer the practice not only software support but free meters and starter strips to give to patients. Pharmaceutical representatives who detail glucose meters are well trained in installing and maintaining their company's software as well as in-servicing the staff on interpreting the data.
Optimal management of diabetes is not possible without SBGM. The motivation that drives most physicians and patients toward optimal control is their desire to prevent or delay the progression toward short- and long-term diabetes-related complications. Acute complications, such as hypoglycemia or diabetic ketoacidosis, can be reduced with the use of frequent monitoring, assuming the patient is able to interpret and correctly act on the results of the test. Long-term complications are linked not only to the patient's A1C but to the degree of daily glycemic variability he or she may be experiencing. Frequent wide glycemic swings in patients, that is, from 50 to 320 mg per dL, induce a cascade of events triggered by superoxide formation, which appears to be the flashpoint for driving the multiple pathogenic mechanisms associated with complications. Although A1C testing is the gold standard for predicting the likelihood of developing complications, using other techniques such as SBGM and continuous glucose monitoring systems (CGMSs) may be helpful in reducing glycemic variability within a given A1C range. Familiarity with all monitoring modalities allows physicians to fine-tune diabetes management and offer their patients the best possible short- and long-term outcomes.
The Link between Glycemic Variability and Long-term Diabetes-related Complications
Although the short-term goals of diabetes management include avoidance of hyperglycemia and hypoglycemia, physicians must also direct their treatment strategies toward surveillance for and avoidance of diabetes-related complications. Microvascular complications (neuropathy, nephropathy, and retinopathy) are likely to occur in patients with long-term exposure to hyperglycemia.6 The incidence of macrovascular complications such as stroke, myocardial
P.327
infarction, angina, and peripheral vascular disease can be reduced by improving A1C levels, blood pressure, and lipids; placing patients on aspirin; and encouraging lifestyle intervention such as smoking cessation, exercise initiation, and weight reduction.7
The risk of developing long-term diabetes-related complications may be reduced by lowering the A1C to the recommended target of 6.5% to 7% and improving glycemic variability. Hyperglycemia incites the overproduction of the reactive free radical molecule superoxide from cellular mitochondria, amplifying the glucotoxic-induced destructive pathways responsible for microvascular and macrovascular complications.8 Levels of free radical production are twice as high in patients with diabetes when compared with normal controls.9 Diabetic patients with the greatest degree of glycemic variability have recently been shown to have a fourfold increase in free radical production when compared with patients showing minimal glycemic variability.10 Acute glycemic variability may be a better indicator of free radical production than postprandial hyperglycemia, which could predict which patients would be at highest risk for developing cardiovascular disease.
One subgroup of patients in the Diabetes Control and Complication Trial (DCCT) had a sustained A1C of 9% throughout the length of the study. However, the intensively managed cohort had a 50% reduction in the development of retinopathy when compared with the conventionally managed patients with identical A1C levels.11 Intensive management results in improved postprandial control of blood glucose levels, reducing glycemic variability and limiting superoxide production.
The acute changes may be assessed via SBGM, CGMS, and 1,5 AG testing. Recently, studies have attempted to determine if chronic and sustained hyperglycemia or acute alteration in glycemic variations might be more responsible for inciting pathogenic pathways leading to diabetes-related complications in patients with T2DM.2 Monnier et al.10 determined that a significant relationship exists between acute glycemic variations and activation of oxidative stress when compared with exposure to chronic, sustained hyperglycemia.
Biologic and genetic variations may occur in all people whether or not they have diabetes, making some individuals more susceptible to glycosylation than others.12 Therefore, some patients may have an elevated A1C that is out of proportion to the results predicted by their SBGM logs. Although glycemic instability is believed to be associated with diabetes-related complications, the diurnal variations experienced by these patients have been shown to have a minimal impact on the total A1C.13
Glycemic variability may be assessed by both SBGM and CGMS. Using computerized software, modifications in a patient's treatment regimen may be suggested to reduce glycemic variability and lower the risk of complications (Fig. 7-2).
P.328
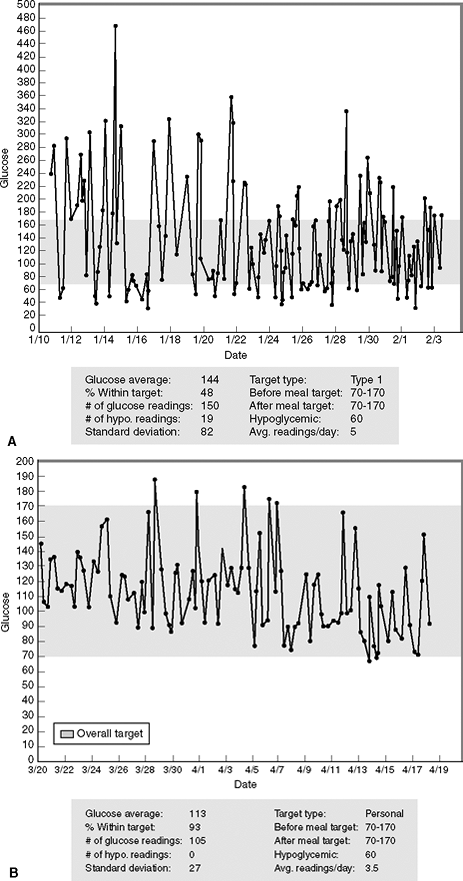 |
Figure 7-2 Minimizing Glycemic Variability. After being placed on multiple daily injections of insulin, this patient experienced wide glycemic variation and frequent episodes of hypoglycemia. A: The patient's glucose level standard deviation is 82, which when doubled exceeds his glucose average of 144 mg per dL during this 3-week reporting period. This suggests that the patient has a tendency toward developing hypoglycemia. In fact, 19 of the patient's 150 glucose readings (12.6%) were less than 60 mg per dL. On any given day, the patient's glucose readings might range from 50 to 440 mg per dL. Only 48% of his glucose readings are within the target range of 70 to 170 mg per dL (the goal being at least 50%). B: After being placed on an insulin pump, the patient's glycemic variability improves significantly. The standard deviation is 27, which when doubled is less than the glucose average of 113 mg per dL; 93% of his readings are now within the target range and he is experiencing no hypoglycemia. The glycemic variability has been significantly improved with the use of the insulin pump. |
Glycated Hemoglobin Testing
A1C is formed slowly and nonenzymatically when hemoglobin is exposed to plasma glucose. The rate of formation of glycated hemoglobin is directly proportional to the ambient plasma glucose concentration. The ADA has recommended that patients attain an A1C level below 7% because the DCCT14 demonstrated that A1C levels above 7% are likely to increase the risk of
P.329
developing microvascular disease. However, other professional societies such as the American Association of Clinical Endocrinologists (AACE)15 have recommended that patients with diabetes attain A1Cs below 6.5%, which is closer to the normal level of 6%. Patients who desire to get pregnant should attain the best possible A1C prior to the time of conception.16 Attaining an A1C less than 1% above the upper limits of normal is highly desirable prior to pregnancy.17 Hospitalized patients with near-normalized A1C levels have better outcomes than patients who present acutely with hyperglycemia to the intensive care unit (ICU) or critical care unit (CCU) settings.18
Although glycation is continuously occurring over the 120-day lifespan of erythrocytes, 50% of the A1C is determined by glycemic levels occurring during the 1 month preceding the measurement, 25% from 30 to 60 days before the measurement, and 25% from 60 to 120 days prior to obtaining the measurement.19
Gender, age, ethnicity, and the timing of testing in relation to meals have no effect on A1C levels. Other confounding variables (Table 7-2) should be considered if a patient's A1C appears to be disproportionate to what might be expected when compared with the results of the computerized SBGM data.
P.330
TABLE 7-2 Conditions That Can Alter the Reliability of Glycated Hemoglobin Testing | ||||||||||||||||
|---|---|---|---|---|---|---|---|---|---|---|---|---|---|---|---|---|
| ||||||||||||||||
Point-of-service A1C testing is now commercially available both within the office setting and over-the-counter for easy patient access. Point-of-service testing is advantageous because patients and physicians are provided with immediate feedback on glycemic control, allowing therapeutic changes to be made in a timely and more efficient manner. Randomized controlled clinical trials have demonstrated that the use of point-of service A1C testing improves long-term glycemic control in type 1 diabetes mellitus (T1DM) and T2DM patients better than with the use of central laboratory testing.20 The benefits of home or patient-initiated A1C testing has not been evaluated.
Two other long-term indices of glycemia are available yet used infrequently. Fructosamine levels provide a reflection of glycemia over a 2-week period. However, the utility of performing fructosamine testing is questionable. In situations in which the A1C test is unreliable or may not be useful (such as hemolytic anemias), a glycated serum albumin (GSA) measurement may be helpful in assessing a treatment regimen. Values for GSA may vary in disease states in which the synthesis or clearance of serum proteins is altered, as in an acute systemic illness or hepatic failure. A single measurement of GSA provides an index of glycemic status over the preceding 1 to 2 weeks. Performing weekly fructosamine or GSA testing in an attempt to improve glycemic control has not been shown to lower A1C levels.21
Recently, the U.S. Food and Drug Administration (FDA) has approved a 1,5-AG (anhydroglucitol) assay as an intermediate-term glycemic marker. GlycoMark measures serum levels of 1,5-AG, which is reduced in association with postprandial hyperglycemia. Although additional testing is necessary to determine the clinical utility of GlycoMark testing, patients with A1C levels ranging from 8% to 9.5% may benefit from this new technology.22
P.331
Improving the Utility of Self Blood Glucose Monitoring
Does SBGM have a positive effect on patient care and diabetes outcomes? Although many studies have sought to answer this question, the larger, more recently completed trials suggest that performing SBGM does improve overall glycemic control.23 The data are most conclusive for patients using SBGM to guide their insulin therapy, whereas the evidence linking SBGM to improved glycemia in patients with T2DM is less convincing.14 Sarol et al.24 summarized eight randomized control trials of 1,307 patients with T2DM and found an overall statistically significant 0.4% reduction in A1C in patients who performed A1C testing.30
When patients are informed that they will require exogenous insulin injections, physicians should advise them that the intention is to make their blood glucose levels comparable to those in individuals with a normal-functioning pancreas. This process, known as physiologic insulin replacement therapy, can be achieved using either an insulin pump25 or a basal-bolus insulin program.26 Either regimen requires frequent SBGM with the following objectives:
Determine the optimal frequency and timing of blood glucose monitoring
Determine the patient's target blood glucose ranges in regard to his or her fasting and postprandial states
Calculate the percentage of time that the patient's glucose levels actually fall within this predetermined target range to predict the A1C level
Determine premeal and postmeal glycemic trends that warrant dosing adjustments
Identify patients who are experiencing frequent or significant hypoglycemic events
These goals are simply not attainable by glancing over handwritten logs that patients bring in on a regular basis, no matter how detailed they may seem. Some patients may even complete their quarterly handwritten logs while sitting in the doctor's waiting room before their visit.
Blood glucose meters are less accurate than plasma glucose determinations. However, the Organization for Standardization (http://www.iso.org) recommends that more than 95% of meter readings be within 15 mg per dL for glucose readings that are less than 75 mg per dL and within 20% for higher glucose levels when compared with a standard laboratory reference.13 The following operator-related errors can result in misinterpretation of SBGM data:
Failure to calibrate the meter each time new glucose test strips are used.
Drugs, such as ascorbic acid, acetaminophen, dopamine, and mannitol, can reduce the accuracy of some meters.
Glucose meters are less reliable in the lower ranges of glycemia and may overestimate true glucose values in the higher glycemic ranges.
Anemia will raise glucose levels. (Erythrocytes are relatively glucopenic, so that whole blood applied to glucose test strips has 15% less glucose than plasma glucose. Most modern meters are calibrated to provide plasma glucose readings on the assumption that the patient has a normal hematocrit.)
Although many meters allow for alternative site testing from the thigh or forearm, glucose results obtained from these sites may be less accurate when compared with the standardized fingerstick method. For example, blood glucose appears to rise more slowly and less dramatically in the forearm following a meal, whereas exercise promotes a more rapid reduction in forearm and thigh glucose levels.13 Therefore, fingerstick testing is preferred in circumstances of rapidly changing blood glucose levels or when hypoglycemia or hyperglycemia is suspected.
P.332
The optimal frequency of SBGM should be determined on an individual basis. The ADA recommends SBGM three or more times daily for T1DM, whereas no specific frequency of testing has been recommended for T2DM.17 If the preprandial blood glucose levels and the A1C values are in the targeted range, there is little need to recommend postprandial or postabsorptive monitoring.
Whereas all patients should incorporate SBGM into their daily routines to assist in achieving their targeted A1C, additional testing is necessary under the following conditions:
Hypoglycemic unawareness or frequent hypoglycemia
Prior to starting moderate or heavy exercise and periodically during the exercise session
Certain types of employment (law enforcement, firefighters, heavy equipment operator, and shift workers)
In patients with intercurrent illness, while on corticosteroids, and during perioperative management
Children younger than 6 years
Preconception planning, pregnancy, and breastfeeding
Patients abusing drugs and alcohol
Prior to driving a car and every 2 hours thereafter for patients on insulin therapy
To evaluate the efficacy of a change in insulin or oral therapy program (including the addition of exenatide or pramlintide to one's existing regimen)
In patients with advanced complications (autonomic neuropathy, nephropathy, recent myocardial infarction, or stroke)
During air travel through time zones
A suggested testing regimen for patients with both T1DM and T2DM is outlined in Table 7-3.
The following interventional strategies are useful in motivating patients to become active participant in self-monitoring:
P.333
TABLE 7-3 Optimal Monitoring Frequency and Timing of Self Blood Glucose Monitoring in Patients with Type 1 and Type 2 Diabetes | ||||||||||||
|---|---|---|---|---|---|---|---|---|---|---|---|---|
| ||||||||||||
Each patient should have defined glycemic targets, that is, fasting, postprandial, bedtime, nocturnal, pre-exercise, and prior to operating a motor vehicle.
The correct procedure for obtaining a sample of blood should be explained and demonstrated to the patient. Patients new to monitoring should check their glucose level in the office under the watchful eye of medical personnel.
One should periodically evaluate the patient's SBGM technique to make certain that the procedure is performed properly.
The clinician should explain in writing when and how often monitoring should be performed.
One should advise patients that their meters are to accompany them wherever they go, especially when they come for the follow-up office visits.
While sitting at the patient's side, the physician should take time to explain the meaning of the computerized generated downloads. Patients will most likely perceive this as a positive interaction in which the physician is spending an extra amount of time to improve their diabetes control. On future visits, patients will, it is hoped, be equally enthusiastic about showing off their meter data.
One should teach patients how to respond to critical readings that require immediate action, such as hypoglycemia or severe hyperglycemia.
The toll-free number printed on the meters can be used as a consumer resource for patients who have questions about device malfunctions, calibrations, software, Internet access for downloading, or issues related to the testing strips.
The clinician should remind patients to calibrate their meters, if needed, when new strips are used.
The patient should use only one primary meter whenever possible. However, backup meters, strips, and lancets should be kept in other strategic locations, such as in one's car, at school, and at work. The patient should always have a backup meter while traveling. It is vital to remember that proper insulin dosing is based on the actual blood glucose level. Guessing at the blood glucose value is inappropriate and dangerous.
P.334
Several barriers to effective SBGM utilization have been identified in cross-sectional studies, including a lack of understanding of the importance of self-monitoring, poor technique, failure to communicate to patients on how to interpret the results of the individual readings, the cost of the strips, and how to respond to extreme values.27,28 Patients with higher out-of-pocket expenditures for testing supplies performed SBGM less often and were more likely to be nonadherent to a recommended SBGM regimen.28 A study of T2DM patients with no insurance had an average A1C of 7.4%, whereas insured patients with coverage for testing supplies had an A1C of 7.1%.29 Patients with language barriers are less likely to perform SBGM.28
Interpretation of Computer-generated Self Blood Glucose Monitoring Data
Data from meters can be downloaded in the physician's office on a standard personal computer (PC) by the nurse as the patient presents. The doctor can quickly review the data prior to seeing the patient and have a general understanding of what changes in the treatment regimen should be pursued.
Patients perceive computerized downloads as being more important than handwritten glucose logs to their diabetes management. In one study,30 patients who used computerized downloads reduced their A1C 0.4% from baseline after 12 months, whereas those who used handwritten logs reduced their A1C only 0.1%. Nearly 90% of the patients in this study reported that they also
P.335
reviewed the printouts independently in their homes and 70% indicated that they would prefer computerized data management versus handwritten logs.
For office-based downloading, patients should be encouraged to use only one meter for the majority of their blood glucose readings. More expensive software programs do exist that allow the collating of downloaded glucose data from multiple meters manufactured from different companies. Information about software programs that support the input of more than one brand of glucose meters can be found at http://www.numedics.com/products/clinipro/. A list of meter companies that have excellent meter download software can be found in Figure 7-3, and Table 7-4 lists voice-activated glucose monitoring systems available for patients with visual impairment. Even a disposable glucose meter (Sidekick-http://www.firstcareinc.com/product_info.php?products_id=13585) is marketed, which allows patients to carry a small meter shaped like a glucose test strip vial. Although the meter cannot be
P.336
downloaded, patients may consider using this inexpensive device in an emergency when they do not have access to their primary meter. Software programs may differ in terms of their statistical and graphical formats, which may be viewed in tables, pie charts, histograms, and linear charts over a 7- to 90-day period. With practice, data can be interpreted by the physician within 2 minutes. The value and utility of electronic logbooks should be based on the following features:
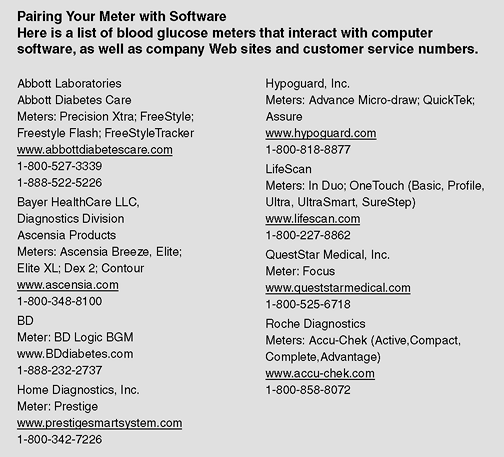 |
Figure 7-3 Pairing the Meter with Software. Blood glucose meters that interact with computer software, along with company Web sites and customer service numbers. |
TABLE 7-4 Talking Blood Glucose Monitors | ||||||||||||||||||||||||||||
|---|---|---|---|---|---|---|---|---|---|---|---|---|---|---|---|---|---|---|---|---|---|---|---|---|---|---|---|---|
|
A listing of blood glucose levels by date and time
An average or mean blood glucose level per day as well as a preprandial and bedtime average. (The timing of the test in relation to various events such as meal times, activity levels, and sleep, should be easily programmable within the installed software package.)
The frequency of blood glucose monitoring within any given day as well as within any given reporting period
The percent of blood glucose readings falling within and outside of a prescribed targeted range. (The prescribed target range can be predetermined by the physician as the software is being uploaded.)
The standard deviations (SDs), which indicate the glycemic variability for specified reporting periods (premeal, bedtime, nocturnal, and fasting)
P.337
Patients whose diabetes is not well controlled can often be encouraged to become better motivated with the use of meter downloads. Unlike written logs, electronic logs will document if patients are failing to check blood glucose levels before meals (Figs. 7-4 and 7-5). This is critical because guessing on insulin dosing is inappropriate. One would obviously bolus more insulin for a blood glucose level of 275 mg per dL than for a level of 65 mg per dL.
Dosing insulin for physiologic insulin replacement therapy is based on many factors, including the preprandial glucose level and the amount of carbohydrates one is planning to consume during a meal. Other factors to be considered include the time that any prior bolus insulin was administered and what, if any, exercise is planned as the next insulin bolus is being absorbed. Thus, the frequency of testing is critical to ensure good glycemic control. Patients who are on multiple daily injections (MDI) of insulin (four shots daily) should be instructed to perform daily home blood glucose monitoring before each meal and at bedtime. Patients using insulin pumps often check blood glucose levels 2 to 3 hours after eating so that a supplemental bolus may be taken to correct hyperglycemia.31 Patients who fail to check their blood glucose levels at appropriate times will experience a deterioration in their glycemic control and an elevation in the A1C levels.32
Patients often ask their doctors about their wide range of glucose variability. Why do I wake up with a 102 on one day and a 165 on the next? More important than any individual numbers on an electronic log sheet is the percentage of the patient's blood glucose downloads that are within a given target range. Assuming an average of three glucose tests per day, a patient who records 49% of the meter downloads over 30 days within the range of 70 to 180 mg per dL should have an A1C near 7%.33 Perfection is not needed to score a lower A1C as shown in Figure 7-6.
The SD of blood glucose values (or the square root of the variance) indicates whether glycemia is being controlled consistently or with drastic diurnal variations suggestive of suboptimal disease management. In most cases, twice the SD should be less than the mean blood glucose (MBG) level (SD 2 <MBG). To be statistically significant, at least 10 glucose readings within a given time period is necessary.34 Higher SDs correspond to lower endogenous insulin secretion34,35 (Fig. 7-7). For example, an SD of 30 would be ideal if the mean fasting blood glucose is 80 mg per dL. However, an SD of 45 in association with a mean fasting blood glucose of 80 mg per dL suggests a trend toward nocturnal hypoglycemia. In general, the wider the gap between the SD and the mean blood glucose, the greater the degree of insulin resistance as shown in Figure 7-7.35
P.338
P.339
P.340
Such patients are usually insulin deficient and require significantly high doses of basal insulin to lower their fasting blood glucose levels.
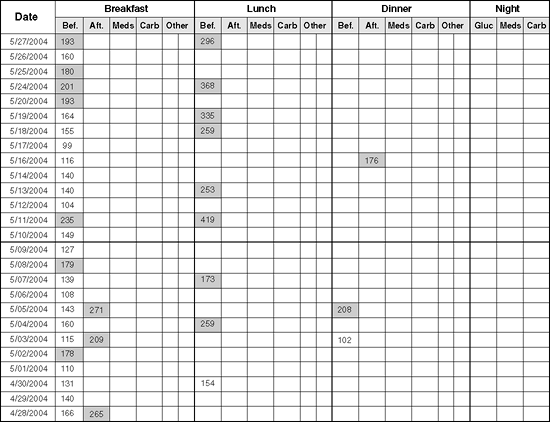 |
Figure 7-4 Patient with Type 1 Diabetes Whose Infrequent Monitoring Correlates with His Elevated Glycated Hemoglobin (A1C). This patient, who uses an insulin pump, told the doctor that he was checking his sugars 4 to 8 times a day. However, his A1C was 12.2%. This printout demonstrates the failure of the patient to perform frequent monitoring. No blood glucose readings were recorded at bedtime. Although he performed fasting blood glucose levels, the patient ultimately admitted to frequently dosing insulin without first checking his sugars before most meals. Thus, he was unable to appropriately dose premeal insulin doses. Frequent blood glucose monitoring often improves A1C levels. |
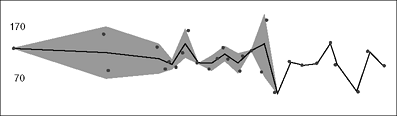 |
Figure 7-5 This Patient's Trickery Was No Match for Nursing Intuition! This 14-year-old patient presented with a downloaded glucose log showing near- perfect glycemic control. All (100%) of his blood glucose readings were in the range of 70 to 170 mg per dL within the past month according to the trend graph. When 50% of the readings are within this range, one would anticipate an A1C corresponding to approximately 7%. However, the patient's A1C was 14.6%. On further questioning by the physician's nurse, the patient admitted using the meter's control solution instead of his own blood when performing glucose testing. No fingerstick marks were noted on the patient's fingers. The embarrassed patient apologized for his indiscretions and was able to reduce his A1C by 4% within 5 months using proper monitoring. Many meter strips are able to identify when control solutions are used and do not add test values to the meter's memory. |
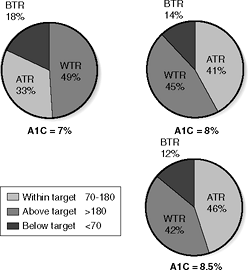 |
Figure 7-6 Predicting One's A1Cs Based on the Percentage of Glucose Values That Fall within the Target Range. To achieve a target glycated hemoglobin (A1C) of 7%, 49% of the patient's blood glucose readings should be in the range of 70 to 180 mg per dL. In this case, approximately 33% of the readings will be above target (>180 mg per dL) and 18% will be less than 70 mg per dL. If the A1C is 8.5%, only 42% of the patient's readings would be predicted to be 70 to 180 mg per dL, whereas 46% would be above 180 mg per dL. Therefore, to attain an A1C that falls within the American Diabetic Association (ADA) treatment target of 7% or less, only half of the patient's glucose readings need to be in the range of 70 to 180 mg per dL. ATR, above target (>80 mg per dL); BTR, below target (<70 mg per dL); WTR, within target (70 to 180 mg per dL). (Adapted from Brewer K, Chase P, Owen S, Garg S. Slicing the pie. Correlating HbA1c values with average blood glucose values in a pie chart form. Diabetes Care. 1998;21:209 212.) |
 |
Figure 7-7 Insulin Resistance in a Patient with 12-year History of Type 2 Diabetes. This patient's blood glucose levels are under poor control as noted by the fact that 74% of his total glucose readings are greater than 170 mg per dL. Also, doubling the standard deviation (SD) of 61 gives a value of 122 that is far lower than the mean blood glucose (MBG) of 208 mg per dL. This suggests that the patient has insulin resistance and, if taking basal bolus insulin, additional basal insulin should be prescribed. This patient's A1C was 9.8% despite being on three injections of bolus analogue insulin plus basal glargine insulin at bedtime. |
The following cases are useful in illustrating the utility of SBGM downloading.
P.341
P.342
P.343
P.344
P.345
P.346
P.347
P.348
P.349
P.350
P.351
P.352
P.353
P.354
P.355
P.356
P.357
Case 2
Jennifer is a 38-year-old female teacher who has had T1DM for 16 years. She was placed on an insulin pump to help improve her erratic blood glucose levels, which were occurring while using multiple daily injections of glargine and premeal lispro. The patient is very dedicated to diabetes self-management. She attends community diabetes classes monthly, understands carbohydrate counting, and checks her blood glucose levels up to six times daily. Her prepumping A1C was 6.8%. Jennifer has no known diabetes-related complications and is asymptomatic.
Her meter download data are shown in Figure 7-8A. First, one should note that she is experiencing frequent hypoglycemia (blood glucose levels <60 mg per dL). Although 48% of her download values are within the target range of 70 to 180 mg per dL, nearly 29% of her blood glucose levels are in the hypoglycemic range. This suggests that the patient needs to have her insulin pump basal and bolus parameters adjusted. In addition, Jennifer should be educated on how to properly count carbohydrates as well as how to avoid insulin stacking (Case 4). Proper management of hypoglycemia should be discussed using the rule of 15. Patients who have blood glucose levels lower than 60 mg per dL should consume 15 g of carbohydrates and recheck their blood glucose levels 15 minutes later. If their blood glucose level has not risen by at least 15 mg per dL, an additional 15 g of carbohydrates should be consumed.
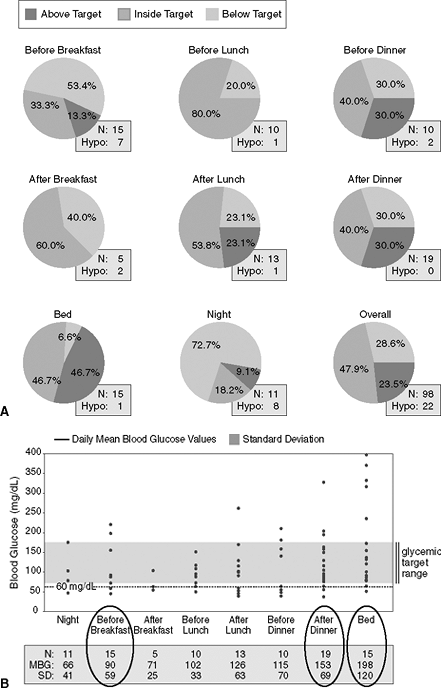 |
Figure 7-8 Identifying Patients with Hypoglycemic Unawareness. A: When looking at meter downloads, the physician should first evaluate the percentage of time the patient achieves blood glucose levels within a range of 70 to 180 mg per dL. In this patient's meter download, looking at the pie chart indicating her overall levels (at the lower right corner), approximately 48% of her numbers are at target, but she is also experiencing hypoglycemia 29% of the time. The hypoglycemia is occurring before and after meals as well as after going to bed (nocturnal hypoglycemia). This patient has hypoglycemic unawareness and cannot detect low blood glucose until it is less than 40 mg per dL. Patients using insulin therapy can expect to record less than 3% of the total blood glucose levels as less than 60 mg per dL. Those recording more than 3% hypoglycemic readings should be educated to (a) provide the correct amount of insulin for any given meal, (b) check blood glucose levels before driving, (c) properly manage hypoglycemia, (d) avoid situations likely to result in insulin stacking (overlapping insulin injections while a previous dose of insulin has yet to be completely absorbed), and (e) monitor blood glucose levels before and after exercise. B: Doubling the standard deviation (SD) for blood glucose readings taken before breakfast, after dinner, and at bedtime exceeds the mean blood glucose (MBG) average for the same time periods, suggesting frequent diurnal hypoglycemia. Because this patient is on an insulin pump, one should consider lowering her basal rate of insulin delivery. By increasing her basal glucose levels to between 140 and 180 mg per dL for 4 to 6 weeks, the patient may ultimately restore her hypoglycemic awareness.25 Eventually, the basal rate can be increased once again to allow for tighter glycemic control. In addition, mealtime boluses should be reduced and the extended boluses should be carried out from 2 to 3 hours to better match the absorption of carbohydrates from the gut and prevent postprandial hypoglycemia. The patient should be asked to return for another meter download in 3 weeks to make further adjustments in her insulin regimen. N, number of glucose readings obtained during this time interval. |
Because Jennifer has hypoglycemic unawareness, her insulin pump basal rate was reduced by 0.1 U per hour, allowing her ambient blood glucose levels to rise to 140 to 180 mg per dL for 4 to 6 weeks. This allows many patients to regain their ability to recognize hypoglycemia events, at which time the basal rate can then rise again to normalize glycemic control.25
Figure 7-8B demonstrates how one can use the standard deviation to assess a patient's tendency toward hypoglycemia.
Case 3
Brad is a 29-year-old man diagnosed as having diabetes 3 months prior to this office visit. On his initial presentation, Brad's fasting blood glucose level was 529 mg per dL and his A1C was 12.4%. Five months prior to the time he was first diagnosed, Brad was symptomatic with classic diabetes symptoms including polyuria, fatigue, polydipsia, weight loss, blurred vision, and polyphagia. He was immediately started on physiologic insulin replacement therapy consisting of basal glargine and prandial glulisine using pen injectors. The premeal boluses were determined by his blood glucose readings as well as his estimation on the quantity of carbohydrates he would consume for each meal. His meter download data are shown in Figure 7-9. Based on the fact that more than 50% of his blood glucose readings fall within the range of 70 to 170 mg per dL, Brad is informed that his glycemic control is excellent and that his A1C is predicted to be 7% or less. A point-of-service A1C test confirms that his A1C is 6.7%. No changes would be indicated in this patient's insulin regimen.
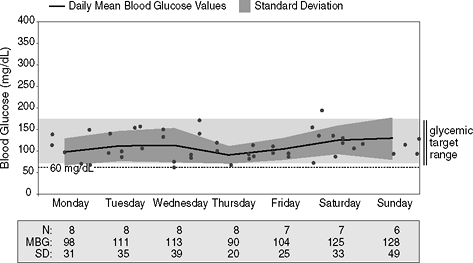 |
Figure 7-9 Physiologic Insulin Replacement Therapy in a Newly Diagnosed Patient with Type 1 Diabetes Mellitus (T1DM) Provides Outstanding Glycemic Control with Minimal Glycemic Variability. This figure shows a trend graph taken over a 7-day period on this newly diagnosed patient with T1DM. Note that the patient is checking his blood sugars frequently, between six and eight times daily. Next, note that the standard deviations (SDs), when doubled, are always less than the mean blood glucose readings (MBG), which means that there is very little variation in his blood glucose readings. However, fewer than 15 readings are recorded for each day of tests, making the comparison between the SD and the MBG not statistically usable. However, the patient performed 52 blood glucose tests over a 7-day period. His MBG was 110 mg per dL and his SD was 35. This suggests excellent glycemic variability. Finally, focus on the light gray bar on the graph. This is the target that was set for the patient's blood glucose readings: 70 to 170 mg per dL. Each dot indicates a blood glucose reading. The black line represents the MBG, which runs right through the middle of the light gray bar. This patient is experiencing excellent control of his diabetes, which is reflected in his 6.7% A1C. |
Case 4
Edna is a 75-year-old woman with a 48-year history of T1DM and a point-of-service A1C of 5.9%. She has been using an insulin pump for over 6 years in an attempt to better control her diabetes. Not unexpectedly, due to the length of time she has had diabetes, Edna has hypoglycemic unawareness and does not perceive low blood glucose levels until she spontaneously loses consciousness. Edna is concerned about her frequent bouts of severe hypoglycemia. Over the past 3 years she has had six visits to the emergency department for management of acute hypoglycemia. Five of these episodes have occurred after lunch while shopping, including one that resulted in a seizure. On one occasion, Edna was found unconscious in bed by a neighbor who came to check on her. Because Edna lives alone, she has given keys to her home to several neighbors just in case of emergencies. Her meter download is shown in Figure 7-10. After reviewing the downloads along with her pump bolus history, one can conclude that she is a victim of insulin stacking. Following a subcutaneous injection, insulin analogues require 6 hours to be completely absorbed (see Chapter 5). Two hours following an insulin injection, approximately 60% of the original dose remains in the subcutaneous depot waiting to be absorbed. If the patient then reboluses additional insulin, he or she will have 100% of the new boluses working to reduce blood glucose levels, plus 60% of the initial boluses.
Edna is informed that because she lives alone and has severe hypoglycemic unawareness, the basal rates on her insulin pump should be reduced and the mealtime boluses should also be changed. Edna had been giving all of the mealtime insulin as a single rapid bolus. She has now been instructed to use a combination bolus consisting of 25% of the total prandial dose being given immediately and 75% given over the extended period of 3 hours. In addition, the patient is provided with this updated list of glycemic targets so that she does not develop hypoglycemia:
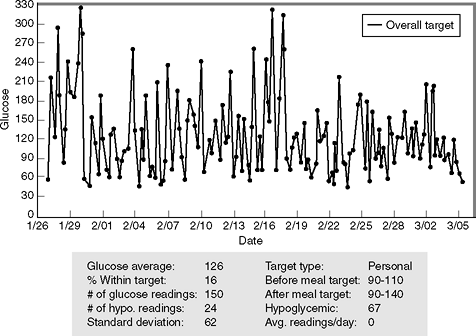 |
Figure 7-10 Insulin Stacking Resulting in Frequent Episodes of Severe Hypoglycemia. In a 6-week period, this elderly patient has recorded 24 hypoglycemic events, according to her meter downloads (the meter was programmed to record any blood glucose level <67 mg per dL as being hypoglycemia). Note that the glucose average over this period of time is 126 mg per dL and the standard deviation (SD) is 62. Doubling the SD gives a number that is nearly identical to the average blood glucose level, an indication that the patient's glycemic control is tending toward hypoglycemia. The patient was asked why she was becoming hypoglycemic so often. This patient explained that she was giving repeated correction boluses of insulin in an attempt to avoid hyperglycemia. This process of repeating a bolus before a prior bolus has been completely absorbed is known as insulin stacking and can result in severe hypoglycemia. |
Fasting glucose: 140 to 180 mg per dL
1- to 2-hour postprandial glucose: 140 to 180 mg per dL
A1C: 7.5% to 8%
Finally, the importance of insulin stacking is discussed in detail with the patient, who soon realizes the reason for her frequent self-induced hypoglycemic events. Edna is able to calculate how much insulin remains to be pharmacologically active between 2 and 6 hours after a bolus is performed. If 4 U of rapid acting insulin remains active when Edna chooses to have a snack, additional insulin would not be needed to cover that meal. Once this patient was instructed to avoid insulin stacking, her hypoglycemic events dropped by 98% and her A1C was stabilized at 6.9%.
Case 5
Michael is a 32-year-old corrections officer with a 12-year history of poorly controlled T1DM. He presented initially on a combination of triple oral agents and twice-daily split-dose insulin therapy. Associated with his point-of-service A1C of 13%, Michael had multiple long-term complications including distal sensory peripheral neuropathy, nonproliferative retinopathy, hypertension, chronic kidney disease stage, hyperlipidemia, and autonomic dysfunction. He reported that his father died of cardiovascular complications related to T1DM at age 42 years. The patient was placed on basal bolus insulin consisting of detemir taken at bedtime and novolog prior to each meal. He works irregular shifts, including some graveyard shifts weekly, and was asked to monitor his blood glucose levels prior to each meal and at bedtime on a daily basis. His download pattern is shown in Figure 7-11A C.
This patient is clearly underinsulinized: 85% of his glucose readings are higher than 170 mg per dL. Looking at the trend graph, one appreciates that the patient is rarely in the targeted zone for acceptable glycemic control. When one doubles the SD and compares those values with the MBG readings, a wide numerical gap is identified throughout the day. This also suggests that the dose of basal and bolus insulin needs adjustment. After the downloads were viewed, the patient's basal and bolus insulin doses were increased by 20%.
Case 6
Miguel, a 48-year-old Hispanic patient, has had T2DM for 5 years. His blood glucose levels were well controlled while he was taking two oral hypoglycemic agents. However, the patient developed Bell palsy and was immediately placed on prednisone. Several days thereafter he noted that his blood glucose control began to deteriorate, as shown in Figure 7-12.
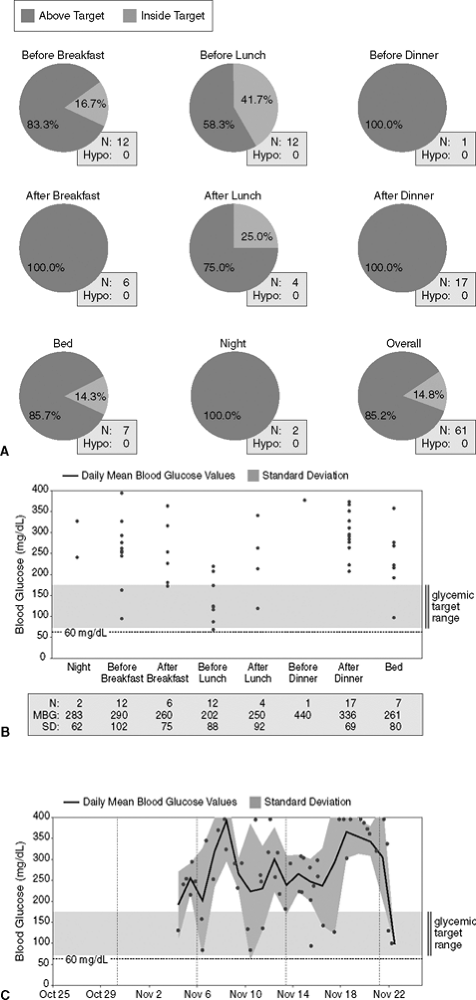 |
Figure 7-11 Underinsulinized Shift Worker with Type 1 Diabetes Mellitus (T1DM). A: The figure shows that 85% of this patient's downloads are above the target range of 70 to 180 mg per dL, which predicts an A1C higher than 8.5% (bottom right chart). Patient is experiencing hyperglycemia throughout the entire day. N, number of meter downloads; Hypo, hypoglycemia. B: Diabetes management software systems that synthesize data uploaded from blood glucose meters can calculate the standard deviation (SD) of blood glucose values (the square root of the variance) to ascertain the quality of glycemic control. Diabetes-related complications appear to be related to extreme variations in glycemic control. Ideally, doubling the SD should come close to the mean blood glucose (MBG) values for that particular time period. A wide separation between the SD and the MBG may indicate insulin resistance or underinsulinization. If the SD doubled exceeds the MBG, the patient's tendency is toward hypoglycemia during that period of testing. For best interpretation of the SDs one should have at least 10 glucose readings at any given time. There is a wide gap between the doubled SD value and the mean body glucose. This insulin resistance is persistent throughout the day. C: The trend graph shows that the patient's blood glucose levels are consistently elevated, suggesting that his current insulin dose should be increased. Wide glycemic excursions are evident as glucose values range from 70 to 350 mg per dL over a 20-day period. Oxidative stress increases with glycemic variability. Therefore, this patient's insulin regimen should be more physiologic. BG, blood glucose value. |
Prednisone causes insulin resistance by interfering with glucose transport into skeletal muscle cells. Patients on steroids will experience relatively normal fasting glucose levels, but postprandial hyperglycemia will remain significant. Blood glucose levels can rise in response to glucocorticoid therapy even in nondiabetic patients. However, the healthy pancreas can usually compensate for the added insulin resistance by simply secreting more insulin. Oral agents are not effective in reducing steroid-induced postprandial hyperglycemia. Short-term management of patients taking glucocorticoids will require the use of an insulin analogue administered prior to mealtimes. Basal insulin is usually not necessary. Insulin-requiring patients who are placed on oral steroids often need 70% of their total daily insulin dose given as bolus insulin, with 30% devoted to basal insulin delivery. Patients who receive intravenous steroids in the hospital setting should be placed on an insulin infusion to improve glycemia.36 Patients with T2DM using corticosteroids should monitor their blood glucose levels fasting, prior to the evening meal, and 2 hours after the evening meal. T1DM patients, including those on insulin pumps, will need to monitor before and after each meal and at bedtime.
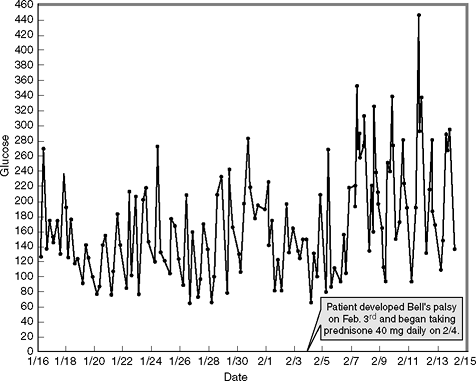 |
Figure 7-12 Effect of Prednisone on Glycemic Control. Prednisone enhances insulin resistance by blocking the transport of glucose into skeletal muscle cells. As a result, postprandial hyperglycemia becomes significant. |
Case 7
David is a 47-year-old commercial long-haul truck driver whose diabetes was diagnosed 6 years ago. His blood glucose levels have never been well controlled despite taking a sulfonylurea, metformin, and a thiazolidinedione (TZD), all at maximum doses. David's A1Cs have been over 8% for 2 years, but he refuses to take insulin. In his state of residence, the Department of Motor Vehicles (DMV) does not allow individuals using insulin to hold a commercial license regardless of how well controlled their diabetes might be. If David is forced to use insulin, his 25-year career as a truck driver will end. Although he is becoming increasingly more symptomatic, David is unwilling to initiate insulin therapy.
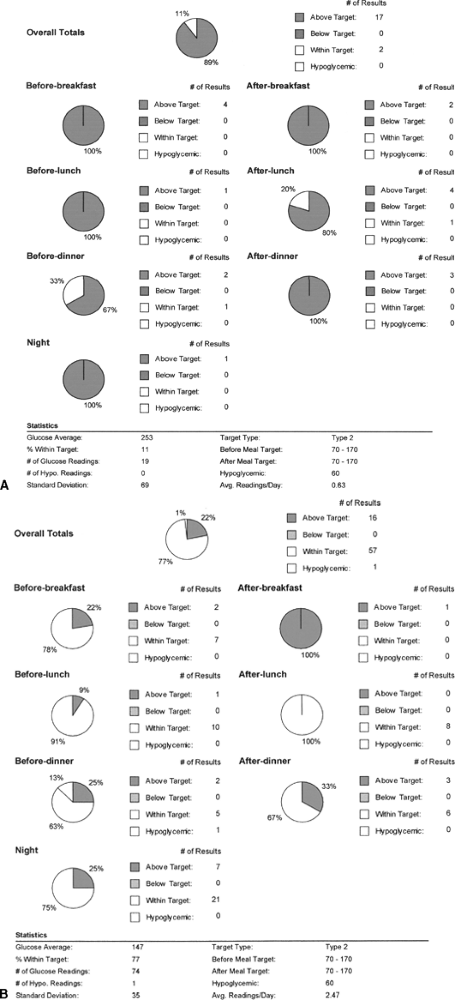 |
Figure 7-13 Patient Who Elects to Use Exenatide Rather Than Insulin to Keep His Job. A: This 47-year-old truck driver patient has a 6-year history of poorly controlled diabetes. Only 11% of his glucose readings are in the targeted range of 70 to 170 mg per dL. His A1C is 9.2%. The patient refused to initiate insulin therapy for fear that he would lose his commercial driver's license. As an alternative to insulin, the patient opted to use exenatide in combination with two oral agents. B: Three months later his downloads showed considerable improvement: 77% of his glucose readings are within the range of 70 to 170 mg per dL, which corresponds well to his lowered A1C of 7.2%. |
David's meter downloads (Fig. 7-13A) show that only 11% of his glucose readings fall within the target range of 70 to 170 mg per dL. As an alternative to insulin therapy, David agrees to begin twice daily injections of exenatide in an attempt to improve his glycemic control. The DMV does not restrict commercial vehicle licenses based on one's use of exenatide. David was advised to discontinue his TZD. The dose of his sulfonylurea was reduced by 50%, and his metformin dose was maintained at 850 mg twice daily. Exenatide was started at 5 g twice daily and increased to 10 g twice daily after 30 days. Not only did the patient's blood glucose levels show immediate and significant improvement with this treatment regimen but many of David's symptoms related to chronic hyperglycemia resolved within 3 months (Fig. 7-13B). Within 4 months, the patient's A1C dropped from 9.2% to 7.1%. David continues to monitor his blood glucose levels while fasting and at bedtime on Monday, Wednesday, and Sunday each week.
Case 8
This 30-year-old woman, named Karen, was referred for bariatric surgery due to clinically severe obesity associated with significant comorbidities (insulin resistance, obstructive sleep apnea, chronic low back pain, hyperlipidemia, and hypertension). Prior to having surgery, Karen was using U-500 insulin via an insulin pump. Despite infusing the equivalent of 250 U of insulin daily, her A1C remained at 8.5%. Her blood glucose average was 227 mg per dL over a 14-day period (Fig. 7-14A). The patient's postoperative course was uneventful, and after 1 year she had lost 45 kg. Her body mass index (BMI) dropped from 50 kg per m2 to 35 kg per m2. She was seen on a monthly basis postoperatively, and her glucose readings were downloaded (Fig. 7-14B). As Karen's glycemia improved, she was switched to U-100 insulin but continued using her insulin pump. The patient was advised to maintain her basal insulin rate and to provide a premeal bolus based only on her preprandial glucose level. She was given a preprandial glucose target of 120 mg per dL and an insulin sensitivity factor of 1:40 (1 U of her insulin analogue reduced her blood glucose level 40 mg per dL. Because her pump could provide incremental boluses as low as 0.1 U, accurate insulin dosing to the targeted range was quite simple).
 |
Figure 7-14 Effects of Bariatric Surgery on Reducing Insulin Resistance. A: A 30-year-old patient prior to undergoing bariatric surgery for clinically significant obesity with comorbidities. Despite using U-500 insulin via an insulin pump, the patient's trend graph shows persistent hyperglycemia with a glucose average of 227 mg per dL. Note that the standard deviation (SD) is 74. When compared with the glucose average, one perceives that this patient has significant insulin resistance. Prior to her bariatric surgery, the patient was using the equivalent of 250 U of insulin daily. B: Postbariatric surgery glycemic control. One year following surgery, the patient's weight was reduced by 45 kg. Note that despite the significant weight reduction, fasting blood glucose levels remain elevated (>100 mg per dL) and several readings during this 14-day recording time are higher than 200 mg per dL. Therefore, the diabetes in this patient, although improved, remains persistent. |
The patient's total daily dose of insulin averaged 27 U daily, including a basal rate of 0.8 U per hour and preprandial boluses averaging 2 U per meal. Her A1C dropped to 6.5% 1 year postoperatively. Although many patients note resolution of their diabetes following gastric bypass surgery, others may need to continue with insulin therapy.
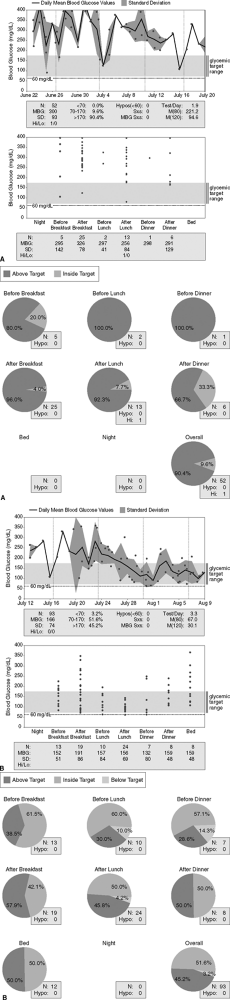 |
Figure 7-15 Patient with Multiple Diabetes-related Complications and Persistent Hyperglycemia. A: A 56-year-old woman with multiple diabetes-related complications (retinopathy, proteinuria, hypertension, hyperlipidemia, peripheral neuropathic pain, autonomic dysfunction, and mild gastroparesis). Despite the use of an insulin pump, her glycemic control is poor. Of her daily blood glucose readings, 90% are above target. There is no evidence of hypoglycemia. The patient's A1C is 9% 5 months after initiating insulin pump therapy. B: Poorly controlled patient with type 1 diabetes mellitus (T1DM) following initiation of pramlintide. The patient began using pramlintide on July 28. Note the significant improvement in glycemic control corresponding to the addition of pramlintide to insulin pump therapy. Now 51% of her blood glucose readings are within the target range of 70 to 170 mg per dL. Note that before lunch and dinner, the standard deviation (SD) when doubled exceeds the mean blood glucose (MBG) readings taken during those same times. This suggests that the patient's blood glucose levels are lower during the afternoon hours. Because this patient is on an insulin pump, lowering her basal rate by 0.1 U per hour between 11 AM and 7 PM will lower her risk of developing hypoglycemia. Note that 3.2% of her total blood glucose readings are in the hypoglycemic range. Well-controlled patients on insulin may experience 1% to 3% hypoglycemic readings on their meters each month. |
Case 9
Despite using an insulin pump, beginning a comprehensive exercise program complete with a personal trainer, and meeting with a Certified Diabetic Educator on six occasions, this 58-year-old patient continues to have significant hyperglycemia (Fig. 7-15A, pages 353 354). As the patient's mounting frustration builds over her poor glycemic control, the decision is made to place her on pramlintide. Her basal rates are not changed, but she is advised to reduce her mealtime boluses by 50%. Over time, the patient learns that by providing 75% of her total calculated bolus over 3 hours in conjunction with a standard immediate bolus, her postprandial glucose readings improve significantly and she rarely experiences hypoglycemia. Figure 7-15B (pages 355 356) shows the marked improvement in the patient's glycemic control using combination therapy. The patient's A1C dropped from 9% to 6.7% after 3 months. The patient has also learned to use the meter company's Web site, download her own meter over the Internet, and interpret the data.
Case 10
This 58-year-old woman was referred for management of severe diabetic peripheral neuropathic pain. The patient's pain was so debilitating that she was unable to sleep or stand, spending most of her day sitting in a chair watching TV. Although the referring physician did not ask for assistance in managing the patient's diabetes, her blood glucose meter was downloaded at the time of her first visit (Fig. 7-16, left side). A point-of-service A1C was 8%. The patient was given samples of duloxetine and advised to begin taking 30 mg in the morning with food for 1 week, then increasing to 60 mg daily. The patient returned 1 month later and her meter was downloaded again (Fig. 7-16, right side). This time the readings were significantly improved, although the oral agent regimen remained unchanged. When asked why her blood glucose levels dropped within 2 weeks of starting the new medication, she admitted to beginning an exercise program. Prior to the initiation of duloxetine, she was unable to walk at all. Once the pain began to resolve, she had no difficulty walking 30 minutes daily. Because the patient's physical conditioning was poor, her blood glucose levels responded well to the exercise regimen. Unfortunately, the patient received only 4 weeks of sample medications. As soon as the samples were depleted, the patient's pain returned and she was unable to ambulate. The second download (Fig. 7-16, right side) shows the worsening glycemic control associated with cessation of her exercise program.
Continuous Glucose Monitoring
CGMSs use a small sensor that the patient or the nurse can self-insert in the subcutaneous area of the abdomen. The sensor determines the interstitial glucose level every 5 to 8 minutes and sends the data via a series of wires or an infrared transmitter to a monitor where the data can be stored and downloaded in the physician's office (Fig. 7-17). The initial CGMS family of sensors typically provided a retrospective analysis of nearly 300 glucose readings per day for 3 successive days. This large amount of data could be used to identify a number of glycemic patterns in patients with diabetes including the patient's individual response to certain foods, insulin, and activity level. These devices are most useful in identifying patients with nocturnal hypoglycemia. The newer sensors are now incorporated into insulin pumps, providing real-time data points that the pumper can use to determine how best to acutely manage diabetes. Ultimately, the CGMS devices will be used to drive a closed-loop insulin delivery system such as an artificial pancreas.
Despite the importance of frequent SBGM, many patients who are intensively treated with insulin therapy have considerable glycemic variability, increasing the risk of developing long- and short-term diabetes-related complications.37 When compared with SBGM, real-time glucose sensor technology has proven to be a valuable tool in allowing patients to fine-tune their glycemic control.38 This recently published 3-month study included 81 children and
P.358
P.359
81 adults with stable T1DM, all of whom were either on intensive insulin therapy using MDIs or continuous subcutaneous insulin infusion. Despite their best efforts at glycemic control, all patients had A1C levels of 8.1% or greater. The patients were randomized to use the Medtronic Guardian RT continuous sensor (either daily or biweekly every-3-day periods for 2 weeks each month). The control group continued using SBGM throughout the study period. The results of the study included the following: (a) 50% of the patients using the real-time sensor continuously for 3 months were able to reduce their A1C by 1% or greater versus 37% of subjects using the sensor intermittently and only 15% of the controls; (b) 26% of those individuals using the real-time sensor continuously were able to reduce their A1C by 2% or greater versus only 4% of controls; (c) at the conclusion of the study the average total daily insulin doses had not changed significantly from baseline in any of the three study arms; (d) 95% of patients using the real-time sensor reported making insulin, dietary, or lifestyle adjustments while using the Guardian RT system. The study suggests that continuous glucose sensing should be considered for intensively managed patients who have suboptimal glycemic control.
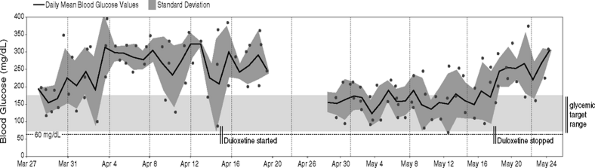 |
Figure 7-16 Treatment of Diabetic Peripheral Neuropathic Pain Improves Glycemic Control in a Disabled Patient. A 58-year-old patient with severe diabetic peripheral neuropathic pain. The patient is taking three oral agents but has very poor glycemic control. Her target blood glucose levels are 70 to 170 mg per dL. The black line represents the mean blood glucose reading on a given day. The darker gray area represents the standard deviation for that same day. In this patient, the blood glucose levels are elevated daily. Following initiation of duloxetine, the patient's glycemic control improved. Duloxetine does not lower blood glucose levels. However, because the patient was able to begin exercising, the blood glucose levels were immediately reduced. Exercise enhances glucose transport into skeletal muscle cells, thereby lowering blood glucose levels. Unfortunately, the patient's supply of sample medicines ran out on May 16. The diabetic peripheral neuropathic pain returned and the patient stopped exercising. This resulted in a rise in mean blood glucose readings almost immediately after stopping her medication. |
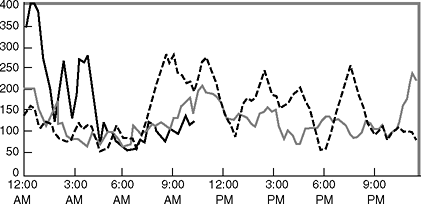 |
Figure 7-17 Continuous glucose sensing performed on a patient wearing an insulin pump. The sensor is worn by the patient for up to 72 hours and measures interstitial glucose levels ranging from 40 to 400 mg per dL every 10 minutes. Each line on the chart represents a different 24-hour period. The data are stored in a monitor worn by the patient before being removed, downloaded, and analyzed on a computer. (CGMS case courtesy of Medronic MiniMed.) |
Summary
Managing patients with diabetes is often very challenging, and time consuming. Physicians must always keep in mind that they must do their best to treat patients to target and limit the patients' exposure to hypoglycemia. In addition to attempting to achieve A1C levels of less than 7%, fasting blood glucose levels should be lower than 110 mg per dL and 2-hour postprandial levels should be
P.360
lower than 140 mg per dL. Physiologic glycemic control cannot be attained without the use of frequent SBGM. Patients must be able to interpret their immediate readings and provide appropriate adjustments in their insulin doses.
Long-term decisions on insulin doses are the responsibility of the physician. Using electronic data from meter downloads provides a reliable and inexpensive means by which physiologic insulin replacement therapy can be fine-tuned in the physician's office. Patients look forward to having the meters downloaded because they too desire the best possible outcomes from their diabetes management.
Meter data can be highly reinforcing. One can imagine a patient's original downloads showing only 42% of numbers in the target range. Such a patient would have an A1C of 8.5%. Adjustments would then be made to the insulin regimen and the patient would return in 6 weeks. On follow up, the downloads would show that 53% of the readings were now in the targeted range of 70 to 180 mg per dL, which would correspond to a predicted A1C of 7%. Patients will be pleased that their hard work and coordinated efforts with the physician are paying off, which increases their motivation to work even harder at self-management of diabetes.
An in-office point-of-service A1C could also be performed for immediate confirmation. The patient leaves proud of the accomplishments and looks forward to continuing frequent blood glucose monitoring. With additional practice, physicians can learn how to adjust mealtime boluses, detect missed or delayed insulin injections, and even detect patients who are less than honest when doing their home blood glucose monitoring.
The routine use of SBGM software within the clinic setting and point-of-service A1C testing combined with the strategic administration of rapid-acting and basal insulin analogues could better modulate glycemic variability. The beneficial effects of reduced glycemic variability would translate into a reduction in the incidence and severity of diabetes-related complications even when A1C levels remain unchanged.
References
1. Pearson J, Bergenstal R. Fine-tuning control: pattern management versus supplementation. Diab Spectrum. 2001;14:75 78.
2. Monnier L, Lapinski H, Colette C. Contributions of fasting and postprandial plasma glucose increments to the overall diurnal hyperglycemia of type 2 diabetic patients: variations with increasing levels of HbA1c. Diabetes Care. 2003:26;881 885.
3. Walford S, Gale EA, Allison SP, Tattersall RB. Self-monitoring of blood-glucose: improvement of diabetic control. Lancet. 1978;1:732 735.
4. Tests of glycemia. American Diabetes Association Position Statement. Diabetes Care. 2004;27:S91 93.
5. Suwattee P, Lynch CJ, Pendergrass ML. Quality of care for diabetic patients in a large urban public hospital. Diabetes Care. 2003;26:563 568.
6. Unger J. Targeting glycemic control. Female Patient. 2003;28:14 20.
7. Adler AI, Stevens RJ, Neil A, et al. UKPDS 59: hyperglycemia and other potentially modifiable risk factors for peripheral vascular disease in type 2 diabetes. Diabetes Care. 2002; 25:894 899.
P.361
8. Brownlee M. Biochemistry and molecular cell biology of diabetic complications. Nature. 2001;414:813 820.
9. Devaraj S, Hirany SV, Burk RF, Jialal I. Divergence between LDL oxidative susceptibility and urinary F(2)-isoprostanes as measures of oxidative stress in type 2 diabetes. Clin Chem. 2001;47:1974 1979.
10. Monnier L, Mas E, Ginet C, et al. Activation of oxidative stress by acute glucose fluctuations compared with sustained chronic hyperglycemia in patients with type 2 diabetes. JAMA. 2006;295:1681 1687.
11. The Diabetes Control and Complications Trial Research Group. The relationship of glycemic exposure (HbA1c) to the risk of development and progression of retinopathy in the Diabetes Control and Complications Trial. Diabetes. 1995;44:968 983.
12. Snieder H, Sawtell PA, Ross L, Walker J, Spector TD, Leslie RD. HbA1c levels are genetically determined even in type 1 diabetes: evidence from healthy and diabetic twins. Diabetes 2001;50:2858 2863.
13. Saudek CD, Derr RL, Kalyani RR. Assessing glycemia in diabetes using self-monitoring blood glucose and hemoglobin A1c. JAMA. 2006;295:1688 1697.
14. DCCT Research Group. The effect of intensive treatment of diabetes on the development and progression of long-term complications in insulin dependent diabetes mellitus. N Engl J Med. 1993;329:977 986.
15. http://www.AACE.com/clin/guidelines/diabetes_2002.pdf. Accessed Nov. 24, 2004.
16. Unger J. Preconception management of women with type 1 diabetes. Female Patient. 2001; 26:40 46.
17. American Diabetes Association Clinical Practice Recommendations. Diabetes Care. 2005; 28(Suppl 1):S24.
18. Unger J, Marcus AO. Glucose control in the hospitalized patient. Emerg Med. 2004;36: 12 18.
19. Tahara Y, Shima K. The response of GHb to stepwise plasma glucose changes over time in diabetic patients. Diabetes Care. 1993;16:1313 1414.
20. Miller CD, Barnes CS, Phillips LS, et al. Rapid A1c availability improves clinical decision-making in an urban primary care clinic. Diabetes Care. 2003;26:1158 1163.
21. Lindsey CC, Carter AW, Mangum S, et al. A prospective, randomized, multicentered controlled trial to compare the annual glycemic and quality outcomes of patients with diabetes mellitus monitored with weekly fructosamine testing versus usual care. Diabetes Technol Ther. 2004;6:370 377.
22. Yamanouchi T, Ogata N, Tagaya T, et al. Clinical usefulness of serum 1,5-anhydroglucitol in monitoring glycaemic control. Lancet. 1996;347:1514 1518.
23. Chachou A, Randoux C, Millart H, Chanard J, Gillery P. Influence of in vivo hemoglobin carbamylation on HbA1c measurements by various methods. Clin Chem Lab Med. 2000;38:321 326.
24. Sarol JN Jr, Nicodemus NA Jr, Tan KM, Grava MB. Self-monitoring of blood glucose as part of a multi-component therapy among non-insulin requiring type 2 diabetes patients: a meta-analysis (1996 2004). Curr Med Res Opin. 2005;21:173 184.
25. Unger J, Marcus A. Insulin pump therapy. What you need to know. Emerg Med. 2002;34(9): 24 33.
26. Unger J. Intensive management of type 1 diabetes. Emerg Med. 2001;33:30 42.
27. Adams AS, Mah C, Soumerai SB, Zhang F, Barton MB, Ross-Degnan D. Barriers to self-monitoring of blood glucose among adults with diabetes in an HMO: a cross sectional study. BMC Health Serv Res. 2003;3:6.
28. Karter AJ, Ferrara A, Darbinian JA, Ackerson LM, Selby JV. Self-monitoring of blood glucose: language and financial barriers in a managed care population with diabetes. Diabetes Care. 2000;23:477 483.
29. Bowker SL, Mitchell CG, Majumdar SR, Toth EL, Johnson JA. Lack of insurance coverage for testing supplies is associated with poorer glycemic control in patients with type 2 diabetes. CMAJ. 2004;171:39 43.
P.362
30. Janssen M, Portalatin M. Ascensia Winglucofacts professional intelligent diabetes management software is an effective tool for the management of diabetes. Bayer Health Care LLC. Document 0392000. 2005:2 10.
31. Unger JR, Fredrickson LP. A primer on intensive diabetes management and insulin pump therapy. Primary Care Rep. 1997;3:9 18.
32. Evans JMM, Newton RW, MacDonald TM, Stevenson RJ, Morris AD. Frequency of blood glucose monitoring in relation to glycaemic control: observational study with diabetes database. BMJ. 1999;319:83 86.
33. Brewer KW, Chase HP, Owen S, Garg SK. Slicing the pie. Correlating HbA values with average glucose values in a pie chart form. Diabetes Care. 1998;21:209 212.
34. Hirsch IB. Blood glucose monitoring technology: translating data into practice. Endocr Pract. 2004;10:67 76.
35. Unger J. Fine-tuning physiologic insulin replacement therapy with office based home blood glucose monitoring downloading software systems. Female Patient. 2005;30(March)29 36.
36. Clement S, Braithwaite SS, Magee MF, et al. Management of diabetes and hyperglycemia in hospitals. Diabetes Care. 2004;27:553 591.
37. Bolinder J, Hagstrom-Toft E, Ungerstedt U, Arner P. Self-monitoring of blood glucose in type 1 diabetic patients: comparison with continuous microdialysis measurements of glucose in subcutaneous adipose tissue during ordinary life conditions. Diabetes Care. 1997;20: 64 70.
38. Deiss D, Bolinder J, Riveline JP, et al. Improved glycemic control in poorly controlled patients with type 1 diabetes using real-time continuous glucose monitoring. Diabetes Care. 2006;29:2730 2732.
EAN: 2147483647
Pages: 19