4 - Managing Type 2 Diabetes in Adults
Authors: Unger, Jeff
Title: Diabetes Management in the Primary Care Setting, 1st Edition
Copyright 2007 Lippincott Williams & Wilkins
> Table of Contents > 4 - Managing Type 2 Diabetes in Adults
function show_scrollbar() {}
4
Managing Type 2 Diabetes in Adults
Take Home Points
Screening for type 2 diabetes (T2DM) in low-risk individual should be performed at 3-year intervals beginning at age 45. High-risk patients who have a normal fasting blood glucose level should undergo a 75-g, 2-hour glucose challenge test to determine whether they have diabetes or a prediabetic state.
Patients at high risk for diabetes developing can benefit from adopting lifestyle changes that may reduce their risk of progressing to T2DM by 58% over a 3-year period.
Surgery for clinically severe obesity provides a potential for cure in patients with T2DM. Candidates for surgical correction of obesity should have the risks and benefits of any procedures evaluated by a specialty team of healthcare providers.
T2DM is a progressive disease characterized by insulin resistance (IR) and reduced pancreatic beta-cell insulin production.
Excessive plasma levels of free fatty acids contribute to IR, nonalcoholic steatohepatitis, and pancreatic beta-cell death.
The treatment of patients with T2DM should be individualized. However, safely achieving a targeted A1C of 6.5% or less should be the goal for the majority of patients.
Metformin should be considered the cornerstone therapeutic agent for nearly all patients with T2DM. The drug is inexpensive, well tolerated, efficacious and has positive metabolic effects beyond simply improving hyperglycemia.
Thiazolidinedione (TZD) use should begin early in the course of diabetes treatment. TZDs improve insulin sensitivity, hyperglycemia, and pancreatic beta-cell function. Lipid profiles, vascular dynamics, inflammatory markers, fibrinolysis, blood pressure, ovulation, and endothelial cell function are all positively affected by TZD therapy.
Newly diagnosed patients with T2DM in whom symptoms related to hyperglycemia have recently developed may respond positively to a high-dose challenge of sulfonylurea given over a period of 2 to 4 weeks.
Therapies that combine the pharmacologic actions of two different drug classes are preferred to monotherapy, especially early in the course of the disease. Patients who are unable to maintain an A1C level 7% or less with oral hypoglycemic agents should be aggressively managed by adding an incretin mimetic or initiating insulin therapy.
T2DM is not a mild form of diabetes. Physicians should screen high-risk patients for this disease, initiate aggressive treatment immediately after the diagnosis is confirmed, and advance the therapeutic interventions as needed to maintain as near normal A1C levels as possible to prevent long-term diabetes-related complications.
Remember: A patient with an A1C of 7.1% has not been treated to target. A normal A1C is considered to be 6%. Always strive to treat a patient as close to the norm as possible while attempting to minimize weight gain and hypoglycemia.
Case 1
Mrs. Chung is 58 years old and appears for her annual physical examination. She has no specific complaints but is concerned about possibly having diabetes because of her family history. Both parents had type 2 diabetes, and one of her three sisters was diagnosed with type 1 diabetes just last year at age 45. Mrs. Chung's medical and surgical histories are unremarkable, except for having had three C-sections. (One of her babies weighed 10 pounds at birth.) Six years ago, Mrs. Chung entered menopause but has never used any hormone replacement therapy. She works as a bank executive, exercises 3 days a week at a ladies' fitness center, and denies use of both nicotine and alcohol. Over the past 6-month period, she has been using a Chinese herbal vitamin to combat the occasional fatigue she feels after eating lunch, her largest meal of the day.
Summarized below are the results of the patient's most recent physical examination and laboratory studies compared with those performed 1 year previously:
| Parameter | Last Year | This Year |
|---|---|---|
| BMI | 28 kg/m2 | 27 kg/m2 |
| Blood pressure | 130/84 mm Hg | 134/86 mm Hg |
| Total cholesterola | 224 mg/dL | 244 mg/dL |
| LDL-C | 140 mg/dL | 162 mg/dL |
| HDL-C | 45 mg/dL | 38 mg/dL |
| Triglycerides | 150 mg/dL | 280 mg/dL |
| Non HDL-C | 184 mg/dL | 206 mg/dL |
| TG/HDL-C ratio | 3.3 | 7.36 |
| Fasting plasma glucose | 98 mg/dL | 118 mg/dL |
| BMI, body mass index; HDL-C, high-density lipoprotein cholesterol; LDL-C, low-density lipoprotein cholesterol; TG, triglycerides. aFasting lipid panel. | ||
On reviewing the laboratory studies with Mrs. Chung, the physician notes that the fasting plasma glucose level is more than 100 mg per dL, suggesting that the patient has impaired fasting. This prediabetic condition places her in a high-risk category for future development of diabetes and cardiovascular disease.1 Her lipid profile has shifted to an atherogenic profile with the elevation in triglycerides and reduction in high-density lipoprotein cholesterol (HDL-C). The triglyceride/HDL-C ratio has increased more than 3.5, which is a marker for insulin resistance (IR).2
Because Mrs. Chung is considered high-risk (Asian American, plus a family history of diabetes, and has an atherogenic lipid panel), a 2-hour postglucose challenge test is performed. At her follow-up appointment, she is informed that her 2-hour postglucose challenge level was 237 mg per dL, and her point-of-service A1C test is 7.6%. Her high sensitivity C-reactive protein (hs-CRP) level was 2.2 mg per dL (normal, <2 mg per dL). Other laboratory values, including her thyroid studies, urinalysis, liver panel, and complete blood count (CBC), were all normal.
The physician explains that Mrs. Chung has newly diagnosed T2DM. After being counseled on diabetes, she is asked to join the American Diabetes Association (ADA). Although she is already doing some light exercise, Mrs. Chung will eventually need to increase the frequency of her exercise to 5 days per week. The patient's 10-year Framingham Risk Score is only 4% (http://hp2010.nhlbihin.net/atpiii/evalData.asp). However, CRP may be a stronger predictor of cardiovascular events than the low-density lipoprotein cholesterol (LDL-C) conveyed by the Framingham risk score.3 Therefore, the patient will be scheduled for a graded exercise stress test before being allowed to increase the frequency, intensity, and duration of her exercise.
A dietary prescription is provided, which suggests limiting the patient's fat intake to 30% of total calories. Less than 5% of the caloric intake should come from saturated fat, with the remaining 25% coming from monounsaturated and omega 3 polyunsaturated fat sources. Although her body mass index (BMI) is only slightly above the recommended level of 25 kg per m2, caloric restriction and weight reduction are not necessary. Focus should be placed, instead, on weight maintenance.
Mrs. Chung wants to know if she has type 1 diabetes (T1DM) or T2DM. Because the patient has a primary relative with T1DM, a glutamic acid decarboxylase (GAD) antibody screening study was performed, which was negative, indicating that she does not have autoimmune T1DM (see Chapter 5).
The nurse provides her with a blood glucose meter and then explains how to obtain the blood sample and perform the test properly. Mrs. Chung is asked to begin testing fasting and at bedtime on the first 7 days of each month and to bring her meter in with her at each visit for data downloading. The physician recommends that she begin taking low-dose aspirin daily as well as metformin. Because she is older than 40, a statin also is prescribed. Finally, Mrs. Chung was invited to attend the monthly diabetes classes, which are provided free of charge through the medical group's medical education department.
Introduction
Type 2 diabetes is a metabolic disorder characterized by abnormalities at multiple organ target sites, including the pancreatic beta cells, skeletal muscles, adipose tissue, and liver. The hyperglycemia characteristic of T2DM develops slowly over time as the pancreatic beta cells fail to produce insulin in response to a glucose stimulus. The resulting elevated plasma glucose levels become cytotoxic, leading to the loss of beta cell function and mass.
In the United States, 6.3% of the population (18 million individuals) have diabetes, with estimates between 90% to 95% having T2DM.4 Approximately 90% of patients with diabetes are managed by primary care physicians (PCPs), many of whom have had little education in screening for, diagnosing, and managing this complicated metabolic disorder.5 Successful management of T2DM requires an understanding of the pathophysiology of IR, a strategy to promote lifestyle modifications, surveillance for identifying and preventing long-term diabetes-related complications, knowledge of intensive pharmacologic interventions, and professional skills for providing patient education. Pursuing an aggressive approach to diabetes management can lead to positive treatment outcomes as well as to improvement in the quality of life for these patients.
Screening for and Diagnosing Type 2 Diabetes
Screening for diabetes should be performed by a health care provider at 3-year intervals beginning at the age of 45 years, particularly in patients with a BMI of 25 kg per m2 or greater.6,7 The ADA discourages screening for diabetes in a nonmedical environment because patients with positive findings may not be provided with appropriate follow-up instructions, repeated testing, or care. Screening should be performed at a younger age and more frequently if other risk factors for diabetes are present, as listed in Table 4-1.
The easiest way to screen for diabetes is by obtaining a fasting plasma glucose (FPG) level. A FPG of 126 mg per dL or more is an indication for retesting on a different day to confirm the diagnosis of diabetes. When the FPG is less than 126 mg per dL and a high index of suspicion exists for diabetes based on the patient's risk factors, a 2-hour postchallenge glucose test should be administered on an alternate day. Two hours after consuming a 75-g glucose drink, a blood glucose level is obtained. A level above 140 mg per dL indicates that the patient has abnormal glucose homeostasis (Fig. 4-1).
Plasma glucose levels also may be obtained from patients who have eaten before testing. Patients who have a casual plasma glucose level of 200 mg per dL or more and who have symptoms of diabetes should be considered
P.122
P.123
to have a positive diabetes screening test. A confirmatory FPG or 2-hour postprandial glucose challenge test should be performed on a different day. Laboratory measurement of the plasma glucose concentration should be performed on venous blood samples to confirm the diagnosis of diabetes. The hemoglobin A1C test is a valuable tool for monitoring long-term glycemic control and predicting one's risk for microvascular and macrovascular complications developing. However, A1C testing is not currently recommended as a screening or diagnostic tool6 (see Chapter 7). Table 4-2 summarizes the ADA screening recommendations for adults.
TABLE 4-1 Risk Factors for Type 2 Diabetes | ||
|---|---|---|
|
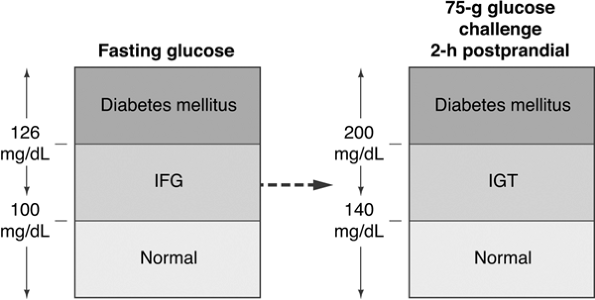 |
Figure 4-1 Diagnosing Diabetes. Patients with normal glycemia have fasting blood glucose levels of 100 mg per dL or less. A blood glucose level between 100 and 126 mg per dL suggests the presence of impaired fasting glucose (IFG). A fasting blood glucose higher than 126 is diagnostic of diabetes. Patients with multiple diabetes risk factors who have a normal fasting blood glucose level, should also undergo a 2-hour, 75-g glucose challenge. Blood glucose levels less than 140 mg per dL are considered normal. Glucose levels between 141 and 200 mg per dL are diagnostic of impaired glucose tolerance (IGT). A blood glucose higher than 200 mg per dL is diagnostic of diabetes. (Adapted with permission from Unger J. Screening for type 2 diabetes in primary care. The Female Patient. 2004;29:27 29.) |
TABLE 4-2 American Diabetes Association Recommendations for Adult Diabetes Screening | ||
|---|---|---|
|
Prevention of Type 2 Diabetes by Using Diet, Exercise, and Pharmacologic Interventions
Both genetic and environmental factors contribute to the development of T2DM. Specific at-risk population groups have a high prevalence of T2DM, as do individuals with an afflicted first-degree relative. The most dominant determinant in the development of diabetes appears to be one's BMI.8 An estimated 65% of Americans have a BMI of 25 kg per m2 or more and are thus labeled overweight by U.S. standards.9 The direct relation between obesity and the increasing prevalence to T2DM suggests that lifestyle interventions for weight reduction and improvement in physical activity participation could slow or prevent the progression from normoglycemia to prediabetes and beyond. Weight reduction and physical activity can improve insulin-mediated glucose disposal, reduce postprandial hyperglycemia, delay beta-cell death (apoptosis), and slow the progression of glucose intolerance to T2DM.10,11 Table 4-3
P.124
summarizes the landmark clinical trials that have demonstrated the important role of lifestyle modification in delaying and preventing T2DM.
TABLE 4-3 Published Studies Demonstrating the Importance of Lifestyle Modification in the Prevention of Type 2 Diabetes | ||||||||||||||||||||||||||||||
|---|---|---|---|---|---|---|---|---|---|---|---|---|---|---|---|---|---|---|---|---|---|---|---|---|---|---|---|---|---|---|
| ||||||||||||||||||||||||||||||
The most comprehensive clinical trial that evaluated the importance of lifestyle modification as a deterrent to diabetes was the Diabetes Prevention Program (DPP).12 This $174 million National Institutes of Health (NIH) study
P.125
enrolled 3,234 individuals with impaired glucose tolerance (IGT). Patients were randomly assigned to receive intensive lifestyle intervention or metformin at 27 U.S. centers. The lifestyle-intervention group participated in walking or other moderate-intensity exercise averaging 150 minutes per week. These subjects lost on average 5% to 7% of their initial body weight while reducing their risk of diabetes progression by 58% (Fig. 4-2). Forty-five percent of the subjects came from high-risk minority groups who have disproportionate numbers of T2DM (African Americans, Hispanics, Asian Americans, Pacific Islanders, and Native Americans). Other high-risk subjects in the DPP included patients older than 60, women with a history of gestational diabetes, and individuals with a first-degree relative with T2DM.
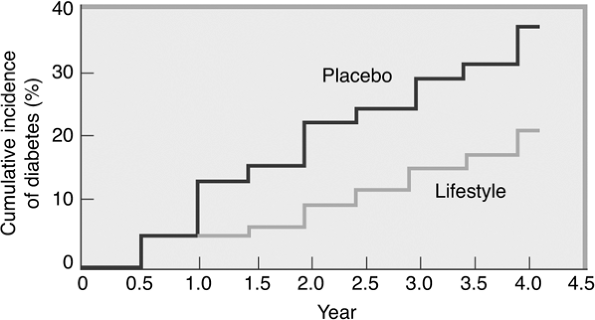 |
Figure 4-2 Modest Weight Loss Prevents Diabetes in Overweight and Obese Persons with Impaired Glucose Tolerance. Modest weight loss can prevent the development of type 2 diabetes. This figure shows data from the Diabetes Prevention Program Research Study, which examined the effect of lifestyle intervention (reducing energy intake and increasing physical activity) on the incidence of diabetes. At the initiation of the study, the participants were 51 years old, had a body mass index of 34 kg per m2, and comprised 68% women and 45% ethnic minorities. The average follow-up was 2.8 years. Participants treated with the lifestyle-modification program experienced a 6% weight loss and 58% decrease in the incidence of diabetes compared with placebo (P < .001). (From Knowler WC, Barrett-Connor E, Fowler SE, et al., and the Diabetes Prevention Program Research Group. Reduction in the incidence of type 2 diabetes with lifestyle intervention or metformin. N Engl J Med. 2002;346:393.) |
DPP subjects were randomized into one of three treatment arms: (a) intensive individualized lifestyle intervention with the aim of reducing weight by 7% through low-fat diet and exercising 150 minutes per week, (b) treatment with metformin (850 mg twice daily), or (c) a standard group taking placebo pills in place of metformin. The metformin and placebo groups also received information about the importance of diet and exercise. A fourth arm of the study, using troglitazone combined with standard diet and exercise recommendations, was discontinued in June 1998 because of the potential for liver toxicity. DPP participants ranged in age from 25 to 85 years, with an average of 51 years. On entry into the trial, all had IGT, as measured by an oral glucose tolerance test, and all were overweight, with an average BMI of 34 kg per m2.
P.126
Lifestyle intervention worked as well in men and women as well as in all ethnic groups irregardless of their baseline BMIs.11 In subjects older than 60 years, lifestyle intervention reduced the progression to diabetes by 71%. Metformin was not as effective as lifestyle intervention in reducing diabetes risk in the population older than 60 years or in those who were less obese.
Diets that include mono- or polyunsaturated fatty acids may alter the composition of membrane phospholipids and improve insulin sensitivity. Specific dietary patterns that are high in fruits, vegetables, and whole grains and low in red or processed meat, sugars, and high-fat dairy products also appear to reduce the risk of T2DM.11
Physical activity improves insulin sensitivity independent of its effect on weight loss or improvement of fat distribution.13 A study of Pima Indians showed that the incidence of T2DM, as determined by oral glucose tolerance testing, was lower in more active individuals regardless of their BMI.14
Although lifestyle intervention might be useful in preventing or reducing diabetes risk, the adaptation of interventional strategies may be expensive or unacceptable to certain ethnically, socially, and culturally diverse populations. To that end, pharmacologic interventions have also been found to delay or prevent diabetes in the short term. The DPP demonstrated that metformin reduced the incidence of diabetes by 31% in comparison with placebo. However, metformin was less effective in patients with lower fasting glucose levels who were not obese. Metformin has been shown to improve insulin sensitivity in obese adolescents.15
High-risk Hispanic women with a history of gestational diabetes who took troglitazone were able to preserve the pancreatic beta-cell function and prevent T2DM, as demonstrated in the TRIPOD study.16 While being monitored for an average of 30 months, these subjects also received dietary and exercise counseling. Troglitazone reduced the annual incidence of T2DM to 5.4% versus 12.1% of women treated with placebo. The 50% reduction in the annual incidence of T2DM was dependent on an initial improvement in insulin sensitivity and reduction in glucose-stimulated insulin production from the beta cells. Although the protective effects of troglitazone on beta-cell function were effective for 8 months after the discontinuation of the drug, persistence of the improved beta-cell status has not been consistently demonstrated.17 The TRIPOD study does suggest that using an insulin-sensitizer drug such as a TZD early in the course of diabetes successfully rests beta cells, thereby preserving and prolonging beta-cell responsiveness to future hyperglycemic challenges.
The use of acarbose has been shown to reduce the incidence of T2DM by 25% over a 3.3-year period compared with placebo, regardless of age, sex, or BMI.18 However, unlike treatment with troglitazone, the beneficial effects of acarbose stopped as soon as the drug was discontinued. In addition, subjects in the trial experienced significant gastrointestinal (GI) side effects from the study drug, which limits its clinical usefulness.
P.127
Small reductions in body mass may reduce the potential of T2DM developing in high-risk individuals. Orlistat, a gastrointestinal lipase inhibitor, reduces dietary fat absorption by approximately 30% and provides a pharmacologic means of promoting weight loss. The XENDOS study19 showed that orlistat plus lifestyle changes resulted in a 37% decrease in progression toward T2DM in patients with IGT.
Type 2 diabetes can be prevented or delayed by pharmacologic agents that affect glucose metabolism and facilitate weight loss (Table 4-4). In addition, drugs that do not directly affect weight or glucose management may delay the onset of T2DM (Table 4-5). Hypertensive patients are at almost 2.5 times higher risk of developing T2DM in comparison with normotensive individuals.20 Several studies that evaluated cardiovascular outcomes in hypertensive patients treated with angiotensin-converting enzyme (ACE) inhibitors,21,22 calcium channel blockers,23,24 and angiotensin II receptor agents (ARBs)25 noted a reduced incidence of new-onset T2DM. The Heart Outcomes Prevention Evaluation (HOPE) trial demonstrated that the ACE inhibitor ramipril reduced the incidence of macrovascular and microvascular complications in hypertensive individuals with and without T2DM.21 Post hoc analysis of 5,720 HOPE trial participants with vascular disease but without diabetes at study entry, followed up for a mean of 4.5 years, had a 40% reduction in the diagnosis of T2DM compared with placebo-treated patients.
Similar results were reported in the Captopril prevention project (CAPPP)22 and Antihypertensive and Lipid-Lowering Treatment to Prevent Heart Attack Trial (ALLHAT).24 Although many clinical trials with antihypertensive agents have reported a positive effect on T2DM prevention, other investigations have not shown any benefit with similar drugs in delaying the onset of diabetes.20,26 Thiazide diuretics and beta blockers may confer an increased risk of T2DM.20,23 Speculations as to why ARBs and ACE inhibitors appear to reduce the risk of diabetes progression are listed in Table 4-6.
The Diabetes Reduction Assessment with Ramiprial and Rosiglitazone Medication (DREAM) study followed 5,269 subjects with IFG or IGT (prediabetes) for 3 years, evaluating their development of diabetes, death, and regression to normoglycemia. Participants were randomized to receive either placebo or ramipril 15 mg per day or to receive placebo or rosiglitazone 8 mg per day. The rosiglitazone cohort demonstrated a 60% reduction in the primary outcome of progression to diabetes or death compared with those given placebo and a 62% reduction in the rate of diabetes development alone. The DREAM trial investigators suggested that for every 1,000 people treated with rosiglitazone for about 3 years, 144 cases of diabetes will be prevented and 200 people with prediabetes will progress to normoglycemia. Although rosiglitazone may be associated with a slight increase in the risk of heart failure, especially in individuals with diastolic dysfunction, this study did suggest that patients with either IFG or IGT can benefit from chemoprevention. Although not FDA approved for use in treating prediabetes, TZDs should certainly be scrutinized as a therapeutic agent in patients at high risk for diabetes progression.26a,b
P.128
TABLE 4-4 Pharmacologic Interventions to Prevent Progression to Type 2 Diabetes | |||||||||||||||||||||||||||||||||||
|---|---|---|---|---|---|---|---|---|---|---|---|---|---|---|---|---|---|---|---|---|---|---|---|---|---|---|---|---|---|---|---|---|---|---|---|
| |||||||||||||||||||||||||||||||||||
P.129
P.130
TABLE 4-5 Prevention of Type 2 Diabetes Identified through Secondary or Post Hoc Analysis | ||||||||||||||||||||||||||||||||||||||||||||||||
|---|---|---|---|---|---|---|---|---|---|---|---|---|---|---|---|---|---|---|---|---|---|---|---|---|---|---|---|---|---|---|---|---|---|---|---|---|---|---|---|---|---|---|---|---|---|---|---|---|
| ||||||||||||||||||||||||||||||||||||||||||||||||
Statins may have beneficial effects on reducing progression to T2DM in addition to their lipid-lowering action. The West of Scotland Coronary Prevention Study (WOSCOP) reported a 30% reduction in new-onset T2DM in subjects treated with pravastatin.27 The Heart Protection Study, however, demonstrated no difference in new-onset T2DM between subjects treated with simvastatin and placebo.28
TABLE 4-6 Possible Links between ACE Inhibitors and ARBs in Delaying Progression of T2DM from Impaired Glucose Tolerance | ||
|---|---|---|
|
P.131
Women with known coronary artery disease who were given hormone replacement therapy demonstrated a lower incidence of T2DM progression over a 4-year period in comparison with placebo-treated women in the Heart and Estrogen/Progestin Replacement Study (HERS).29 However, hormone replacement therapy is not indicated for T2DM prevention because of an unfavorable risk of thrombolic disease developing.
Although one may infer a positive benefit on cardiovascular risk for patients using ACE inhibitor drugs or ARBs, their direct effect on delaying progression to diabetes might be questioned. Uncertainty exists with the ARBs and ACE inhibitors as to whether these drugs actually prevent new-onset diabetes or if the comparator drugs (beta-blockers and thiazide diuretics) are responsible for increasing the risk of diabetes. Long-term prospective clinical trials, such as NAVIGATOR, are necessary to address this issue.
The NAVIGATOR trial (Nateglide and Valsartan Impaired Glucose Tolerance Outcomes Research),30 currently under way in 40 countries, will evaluate the use of the short-acting secretagogue nateglinide (Starlix) and ARB valsartan (Diovan) in preventing T2DM and cardiovascular events in patients with IGT. Subjects (ages 50 years and older) in the NAVIGATOR trial will have at least one cardiovascular risk factor as well as IGT. Of the 9,000 participants, 25% will be randomized to receive nateglinide, 60 mg TID, with valsartan, 160 mg daily; 25% will receive nateglinide and placebo; 25%, valsartan and placebo; and 25% will receive only placebo. Lifestyle-intervention strategies will also be evaluated in all groups. Patients will be advised to reduce their fat and caloric intake, exercise 150 minutes per week, and target a 7% baseline weight reduction if overweight. The study is scheduled to conclude in 2008. However, NAVIGATOR is an event-driven trial in that the study will not conclude until 1,374 subjects have at least one major adverse cardiovascular event such as acute myocardial infarction, acute coronary syndrome, stroke, hospitalization for heart failure, renal failure, or require coronary revascularization.
One of the most interesting statistics that has emerged from the NAVIGATOR trial involves the screening process that is used before randomization. Of the 9,000 subjects screened who had existing cardiovascular disease, 24% had unrecognized diabetes, and 30% had IGT. This suggests that the prevalence of unrecognized impaired glycemia is quite prominent in patients with cardiovascular disease.
Prevention and Reversal of Type 2 Diabetes with Surgical Intervention
Clinically severe obesity is defined as a BMI greater than 40 kg per m2 or a BMI greater than 35 kg per m2 in the presence of a serious comorbid condition such as hypoventilation, sleep apnea, diabetes, hypertension, cardiomyopathy, or musculoskeletal dysfunction. A BMI more than 40 kg per m2
P.132
corresponds to being 100 pounds above ideal body weight or more than 200% of ideal body weight.31 Not only the absolute percentage of body fat, but also the distribution of the fat influences the development of comorbidities. Central obesity carries a greater risk of morbidity and mortality than does peripheral obesity.32 The probability that diabetes will develop doubles for every 20% increase above ideal body weight. Patients with clinically severe obesity have a 10% to 28% incidence of T2DM, with an additional 10% to 31% incidence of IGT.33 In patients with clinically severe obesity, a weight loss of 50% of excess body weight can result in a 30-fold risk reduction in the development of T2DM.34 In rodent models, the excision and removal of visceral fat was found to improve hepatic insulin sensitivity and alter the expression of tumor necrosis factor (TNF) and leptin genes in subcutaneous fat cells, while restoring normal glycemia.35
Approximately 40,000 bariatric operations are performed annually in the United States, primarily with the goal of reducing the comorbidities associated with clinically severe obesity.36 The four main surgical procedures include the vertical band gastroplasty, roux-en-Y gastric bypass, biliopancreatic diversion, and adjustable silicone gastric banding.33 The most popular procedure is the roux-en-Y gastric bypass, which produces weight reduction by restricting caloric intake (because of the reduction in the patient's gastric capacity) and inducing anorexia or early satiety. Gastric bypass operations may result in a 42% baseline weight reduction maintained for 11 years postoperatively.37
Bariatric surgery may play a role in reducing one's risk of T2DM developing. A nonrandomized clinical trial consisting of 136 subjects with IGT and severe obesity (>45 kg excess body weight) were followed up for 2 to 10 years.34 Of the 109 of these individuals who underwent bariatric surgery, in only one did diabetes develop, whereas in 6 subjects in the control group, diabetes developed. The authors concluded that surgical intervention in the severely obese, high-risk patients reduced the progression from IGT to diabetes by more than 30-fold.
The exact mechanisms for improvement in glycemia after gastric bypass surgery are uncertain. The resolution of diabetes after bariatric surgery is independent of weight loss alone, and exclusion of the foregut appears to play a necessary role. Excessive food intake in subjects with diabetes is thought to result in the production of incretin-antagonist hormones, leading to glucose intolerance and dysregulated insulin production.31 Incretin hormones, such as glucagon-like peptide-1 (GLP-1) and glucose-dependent insulinotropic polypeptide (GIP), are released from the small intestines in response to a mealtime stimulus. Once released, the incretin hormones reduce blood glucose levels in a glucose-dependent fashion (significant postprandial hyperglycemia triggers a greater incretin hormone response to re-establish normoglycemia). Patients with T2DM are GLP-1 deficient.38 Gastric bypass may normalize GLP-1 levels, improving beta-cell response to an oral glucose or protein stimulus.
P.133
Rapid presentation of nutrients into the more distal gut, as occurs after bariatric surgery, may also induce the production of pro-insulin hormones similar to GLP-1. GIP and GLP-1 have been noted to be elevated for 20 years after gastric bypass surgery.39
Complications reported by bariatric surgery centers suggest a mortality rate of 1% and an early postoperative complication rate of 10%.40 Postoperative complications include gastrointestinal leak, deep venous thrombosis, bleeding, anastomotic stricture, incisional or internal hernia, marginal ulceration, vitamin and protein malnutrition, gallstone formation, and wound infections. The more adept a surgeon is at performing gastric bypass procedures, the fewer complications the patient experiences.41 Postoperative patients must be evaluated frequently for deficiencies in calcium, iron, thiamine, folate, and B12.
The majority of patients with T2DM (83%) or glucose intolerance (99%) will experience normalization of glucose, A1C, and insulin levels after bariatric surgery.42 Maintenance of normal metabolic parameters as well as persistence of weight loss has been described at 10 to 14 years after bypass surgery.43 No randomized clinical trials have been performed to compare the benefits of intensive lifestyle intervention with the effects of bariatric surgery in improving glycemic control in clinically severe obese patients. However, surgery for clinically severe obesity provides a potential for cure in patients with T2DM and should be considered in all severe obese individuals with diabetes. Table 4-7 lists the indications for bariatric surgery.
TABLE 4-7 Indications for Bariatric Surgery in Clinically Severely Obese Adults | ||
|---|---|---|
|
P.134
P.135
P.136
Case 2
This 45-year-old female patient was seen for her initial office visit with a 13-year history of diabetes. She was insulin-naive and had been taking Glucovance 5/500 twice daily over the previous 2-year period. Her baseline A1C was 9%, and she was symptomatic, complaining of urinary frequency, recurrent vaginitis, blurred vision, and fatigue. Her comorbidities included hypertension, proteinuria, hypothyroidism, and atherogenic dyslipidemia. She weighed 119 kg and had a BMI of 42 kg per m2. Because her A1C was greater than 8.5% and she was symptomatic, the patient was started on a basal-bolus insulin regimen with preprandial lispro plus bedtime lantus. As soon as insulin therapy was initiated, the patient experienced a significant weight gain, requiring increasingly higher doses of insulin. The weight gain continued despite starting insulin pump therapy, exercising 5 days per week, and attending monthly diabetes education classes. Within 3 months of starting insulin, her A1C decreased to 7.2%, but her weight increased by 18 kg. Figure 4-3A demonstrates the severity of the IR she experienced while pumping more than 150 units of insulin daily.
After the patient's weight peaked at 144 kg with insulin pump therapy, she was referred for a bariatric surgical consult. The patient successfully completed a comprehensive presurgical evaluation and underwent a laparoscopic adjustable gastric-banding procedure. Ten months after her successful surgery, the patient recorded a weight loss of 47 kg. Her BMI decreased to 29.5 kg per m2. Considerable improvement in metabolic parameters such as A1C, lipids, hypertension, and proteinuria were also noted at 9 months after surgery (Fig. 4-3C, chart). Figure 4-3B shows the improvement in her glucose levels after gastric bypass surgery.
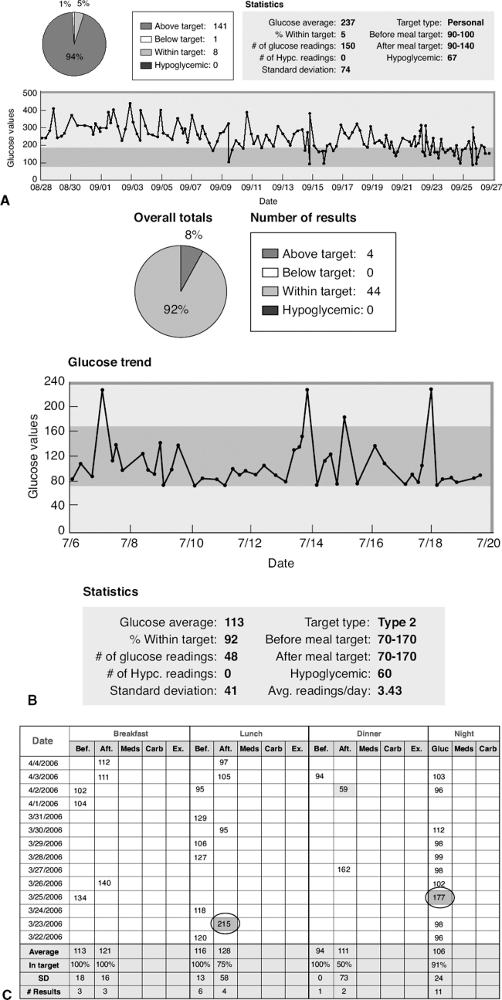 |
Figure 4-3 A: The patient's average glucose reading over a 30-day period was 237 mg per dL. Only 5% of her glucose levels were in the acceptable range of 70 to 170 mg per dL. The trend line shows significant and consistent hyperglycemia. B: The improvement in her glucose levels after gastric bypass surgery. C: Although she still experiences hyperglycemia (circled), the blood glucose levels are significantly improved. The average fasting glucose has dropped from 220 mg per dL to 104 mg per dL, and 92% of her blood glucose readings are now within the acceptable range of 70 to 170. |
The patient continues to use an insulin pump, with her basal rate reduced by 80% compared with her presurgical parameters. She provides bolus insulin based on her meal carbohydrate content. As a result of successful medical and surgical management of diabetes, her A1C has decreased from 7.7% before surgery to 5.7% 9 months after surgery.
| Parameter | Initial Visit | Pre-op Gastric Bypass Surgery | 9 Months after Bypass |
|---|---|---|---|
| Weight | 119 kg | 142 kg | 95 kg |
| BMI | 37 kg/m2 | 44 kg/m2 | 29.5 kg/m2 |
| A1C | 9.8% | 7.7% | 5.7% |
| Fasting glucose | 252 mg/dL | 265 mg/dL | 88 mg/dL |
| Total cholesterol | 224 mg/dL | 213 mg/dL | 102 mg/dL |
| HDL-C | 40 mg/dL | 30 mg/dL | 42 mg/dL |
| LDL-C | 116 mg/dL | 108 mg/dL | 52 mg/dL |
| Triglycerides | 339 mg/dL | 339 mg/dL | 111 mg/dL |
| Triglyceride:HDL-C ratioa | 8.47 | 11.3 | 2.64 |
| Non-HDL-C cholesterol | 184 mg/dL | 176 mg/dL | 74 mg/dL |
| 24-hour urine protein | 177 mg/24 h | 75 mg/24 h | |
| Blood pressure | 188/80 mm Hg | 120/70 mm Hg | 100/70 |
| Diabetes medications | Glucovance | Insulin 270 U/day via insulin pump | 19.2 U/day via insulin pump |
| Additional medicationsb,c | Simvastatin, levothyroxine, trandolapril | Simvastatin, aspirin, levothyroxine, valsartan | Simvastatin, aspirin, levothyroxine, valsartan |
| BMI, body mass index; HDL-C, high-density lipoprotein cholesterol; LDL, low-density lipoprotein cholesterol. aNote the triglyceride/HDL ratio as being >3.5 at baseline and before her surgical procedure. This indicates a state of deteriorating IR, which places the patient at a higher risk for cardiovascular disease. This ratio improved tremendously in association with the patient's postoperative weight reduction. bLevothyroxine doses were titrated to achieve a thyroid-stimulating hormone (TSH) target of 1 to 2 MIU/L. cAs the patient's blood pressure improved, her valsartan was reduced from 320 mg/d to 80 mg/d. The simvastatin was reduced from 40 mg/d before bypass to 20 mg/d postoperatively. The 45% reduction in body weight significantly improved this patient's metabolic status, but she continues to use an insulin pump. Frequent home blood glucose monitoring has demonstrated occasional postprandial glucose elevations >240 mg/dL. The patient has been instructed to give a correction bolus for the postprandial hyperglycemia to the target of 150 mg/dL. | |||
Fifty percent to 70% of children and adolescents who are obese carry their obesity into adulthood, thus increasing their risks of developing serious and life-threatening conditions. This astounding risk increases to 80% if just one parent is obese.44 Behavioral-therapy approaches to weight reduction have
P.137
been demonstrated to be more effective for children and adolescents than for adults.45 Bariatric surgery should be reserved for very severely obese adolescents with comorbidities after the patient has been thoroughly evaluated by a multidisciplinary team that specializes in adolescent weight management. The surgical team should carefully consider the indications, contraindications, risks, and benefits of bariatric surgery for individual patients.
Pathogenesis of Type 2 Diabetes
Type 2 diabetes is characterized by hyperglycemia, IR, and relative impairment of insulin secretion. The clinical features associated with T2DM are based on genetic and environmental influences. Whether an individual remains euglycemic or advances toward the hyperglycemic pathway is ultimately determined by the ability of one's pancreatic beta cells to produce and secrete enough insulin to maintain normoglycemia.
The Cellular Mechanisms That Impair Insulin Secretion and Promote Insulin Resistance
The hallmark of the metabolic dysfunction associated with T2DM includes a reduction in insulin secretion as well as altered insulin action, resulting in hyperglycemia. Unlike autoimmune type 1 diabetes (T1DM), the progression to T2DM occurs over a period of from 7 to 10 years (Fig. 4-4). In the prediabetes states of impaired fasting glucose (IFG) and IGT, pancreatic beta cells excrete increasing amounts of insulin in an attempt to maintain normal glycemia. The higher insulin output is accompanied by reduced insulin activity in the liver, adipose tissue, and skeletal muscles, resulting in diminished intracellular glucose disposal. A further decline in beta-cell insulin secretion and an increase in hepatic glucose production lead to overt diabetes with fasting and postprandial hyperglycemia. Patients proceed through a spectrum of abnormal glucose states, including IFG and IGT, until ultimately progressing to diabetes. At the time one is initially diagnosed as having T2DM, less than 50% of the beta-cell mass remains functioning46 (Fig. 4-5).
Several hormones (insulin, glucagon, amylin, leptin, epinephrine, resistin, GLP-1, and adiponectin) must interact in unity to maintain a normal metabolic environment. Insulin plays a crucial role in modulating the metabolism of fats and protein while being the primary regulator of cellular uptake and the use of glucose. Insulin regulates glucose homeostasis in the liver, skeletal muscle, and adipose tissue.47
An elevated plasma free fatty acid (FFA) level antagonizes insulin action and is the cornerstone of IR, reduced beta-cell response to hyperglycemia, and beta-cell apoptosis. Animal studies suggest that beta-cell failure and death are preceded by an increase in plasma FFAs, accompanied by an accumulation of triglyceride within the beta cell48,49,50 (Fig. 4-6).
IR is characterized by a reduction in the ability of insulin's target tissues (skeletal muscle cells, adipocytes, and hepatocytes) to promote glucose
P.138
P.139
utilization, which is 30% to 60% lower in diabetics than in normoglycemic subjects.51 In the early diabetes phases of IGT or IFG, hyperinsulinemia occurs as the pancreas increases insulin secretion to compensate for the ineffectual response of insulin at the target tissue.
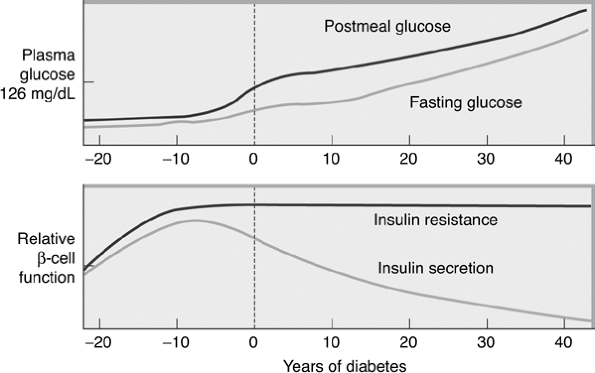 |
Figure 4-4 Progressing from Normoglycemia to Diabetes Is a Process Taking Many Years. Approximately 7 years before the diagnosis of clinical diabetes, patients may have postprandial glucose levels greater than 140 mg per dL. Just before the diagnosis of diabetes, the fasting glucose levels increase greater than 126 mg per dL. Beta cells produce a high level of insulin to overcome insulin resistance that occurs at the liver, adipose tissue, and skeletal muscle cells. At the time of diagnosis of diabetes, insulin resistance is prominent, yet endogenous insulin production by beta cells is reduced by 50%. When only 20% of the beta-cell mass remains functioning, patients require exogenous insulin therapy. |
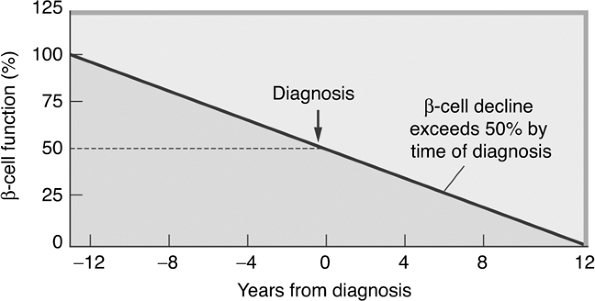 |
Figure 4-5 Beta-cell Function Decline over Time. Pancreatic beta-cell function worsens over time. By the time one is diagnosed as having T2DM, beta-cell mass is reduced by 50%. (Adapted from UK Prospective Diabetes Study Group. UK Prospective Diabetes Study 16: Overview of 6 years' therapy of type II diabetes: a progressive disease. Diabetes. 1995;44:1249 1258.) |
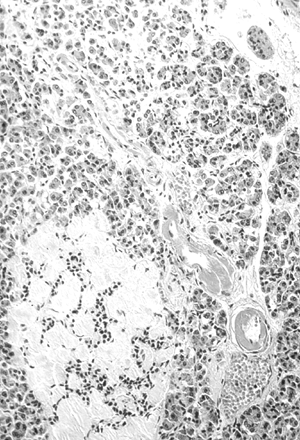 |
Figure 4-6 Amyloidosis (Hyalinization) of an Islet in the Pancreas of a Patient with Type 2 Diabetes. The blood vessel adjacent to the islet shows the advanced hyaline arteriolosclerosis characteristic of diabetes. This is pathologic for beta-cell destruction. (Image from Rubin E, Farber JL. Pathology, 3rd ed. Philadelphia: Lippincott Williams & Wilkins; 1999.) |
Peroxisome proliferator activated receptors (PPARs) also play an important role in IR. When activated by prostaglandins and leukotrienes, PPAR-
P.140
regulates gene expression of proteins involved in the storage of free fatty acids. Obesity and T2DM are both linked to PPAR- activation. This notion is supported by the recent description of two families whose mutations in PPAR- caused both severe IR and diabetes.52
IR may be the best predictor of future T2DM risk. The likelihood that a patient has IR can be assessed by calculating the ratio of one's plasma triglycerides to HDL-C. A level greater than 3.5 is strongly associated with IR2 (Case 1).
Insulin secretion and insulin sensitivity are interrelated. In T2DM, insulin secretion initially increases in response to IR, to maintain normal blood glucose regulation. At first, the insulin secretory defect is mild and selectively involves glucose-stimulated insulin secretion. Over time, insulin secretion deteriorates and becomes inadequate in response to glucose stimulation. Chronic hyperglycemia paradoxically impairs beta-cell function and leads to worsening hyperglycemia. Improvement in glycemic control and weight reduction is often associated with improved beta-cell function.53
Insulin Resistance: The Link to the Hepatocyte
Endogenous insulin produced and secreted by the pancreatic beta cell regulates hepatic glucose production.54 The amount of glucose released from the liver determines one's fasting (basal) plasma glucose level. Insulin directly inhibits glycogenolysis (the conversion of hepatic stored glycogen to glucose) and gluconeogenesis (the synthesis of glucose from noncarbohydrate sources).
Glucagon is secreted from the pancreatic alpha cells located around the periphery of the islet in response to a hypoglycemic trigger. The protective mechanism of glucagon activates hepatic gluconeogenesis and glycogenolysis, thereby raising ambient glucose levels. When released from the adrenal glands in response to stress or a threat, epinephrine also induces glycogenolysis.
Gluconeogenesis occurs primarily in hepatocytes, and to a smaller degree in the kidneys, to ensure that skeletal muscles, the central nervous system, and the heart all have an adequate supply of glucose as an energy source.
A doubling of insulin secretion in a nondiabetic individual reduces hepatic glucose production by 60%, effectively shutting down glycogenolysis. Higher levels of insulin secretion begin to inhibit gluconeogenesis.55
As prediabetes progresses toward beta-cell failure, the reduced levels of circulating plasma insulin can no longer inhibit glucogenesis or glycogenolysis. As blood glucose levels can no longer be maintained within the range of 70 to 140 mg per dL, postprandial and fasting hyperglycemia begins to develop. When only 50% of the beta-cell mass remains functional, patients have persistent hyperglycemia regardless of their fasting state. The increased hepatic glucose production in diabetes is coupled with the reduction of insulin's ability to facilitate glucose transport into skeletal muscle cells, further intensifying the severity of the hyperglycemic state (Fig. 4-7).
P.141
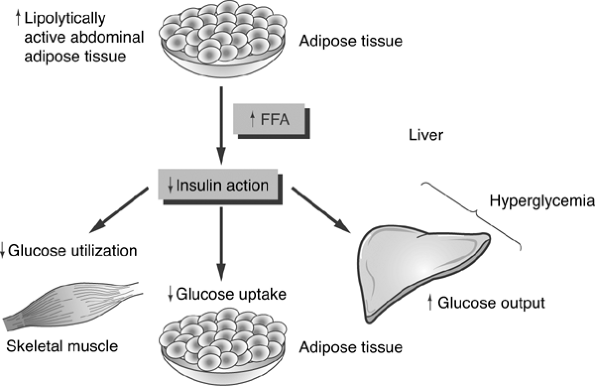 |
Figure 4-7 Mechanism of Insulin Resistance. Insulin resistance is thought to originate from three distinct organ systems. Lipolysis of adipose tissue results in an increase in circulating levels of free fatty acids (FFAs). The FFA blocks insulin action, which is supposed to suppress hepatic conversion of glycogento glucose. Thus, glucose levels increase, resulting in hyperglycemia. FFAs also infiltrate and damage pancreatic beta cells, reducing their insulin-secreting capacity in genetically susceptible individuals [i.e., obese patients with a family history of type 2 diabetes (T2DM) or a personal history of impaired glucose tolerance]. FFAs also reduce the ability of insulin to use glucose as an energy source in skeletal muscle cells. FFAs directly interfere with the insulin receptor's ability to bind insulin and also alter the insulin signaling ability of the skeletal muscle cells so that glucose cannot be transported across the cell membrane. Hyperglycemia is the result of increased glucose output as well as decreased intracellular transport of glucose. Elevated blood glucose levels are cytotoxic to pancreatic beta cells. |
Pancreatic Beta-cell Receptor and Signaling Abnormalities Reduce Insulin Secretion
Within the beta cells, IR results from mutations affecting either the structure of the insulin receptor or any one of multiple intracellular insulin-signaling mechanisms. Ultimately, both intracellular glucose transport and delivery of insulin from the beta cell to the plasma are impaired. Environmental factors, such as lack of physical activity, obesity, age, and dietary factors, fuel the resultant hyperglycemia triggered by these genetic anomalies.
Although insulin receptor numbers are reduced in obese individuals, no reduction in insulin receptor activity occurs in liver or skeletal muscle in patients with T2DM. This suggests that IR arises from intracellular postreceptor abnormalities.57 The insulin receptors in T2DM have decreased tyrosine kinase activity, resulting in postbinding defects in glucose transport mechanisms.58 Alterations in the structure of the insulin receptor coupled with the
P.142
inability of cells to transport glucose from the interstitial or plasma fluid into the cell for use as an energy source intensifies IR59 (Fig. 4-8).
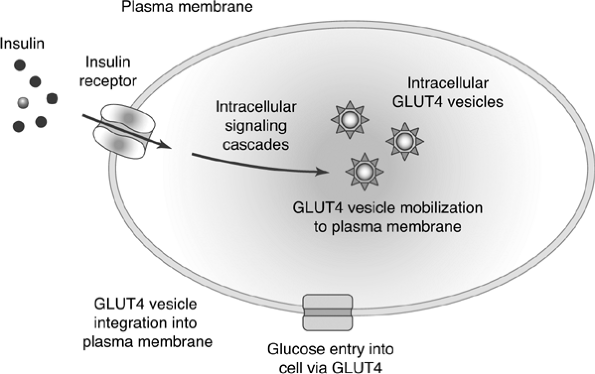 |
Figure 4-8 Insulin Action in Muscle and Fat Cells. Insulin binds to the insulin receptor on the cell membrane. The binding induces a long series of intracellular molecular actions, which mobilize GLUT4 transporter protein to the cell surface. Glucose gains entry into the cell via the GLUT4 transport mechanism. Insulin resistance may involve mutations of the insulin receptor or alterations in normal intracellular insulin signaling. |
Insulin secretion from the pancreas occurs in two phases. The first-phase insulin response represents an immediate release of insulin from the beta cells. Normally this insulin release occurs as beta cells excrete preformed insulin for 10 to 20 minutes after a glucose stimulus (Fig. 4-9). The second-phase insulin release will continue until the blood glucose level returns to normal, approximately 90 minutes after eating. First-phase insulin response is genetically predetermined and frequently abnormal in subjects with a first-degree relative with diabetes.60 First-phase insulin response is also impaired because of the effects of chronic hyperglycemia on beta-cell function and postreceptor signaling, which promote intracellular glucose transport.61,62 Direct beta-cell death resulting from an elevation in FFA levels will also impair first-phase insulin response.
Role of the Adipocyte in Promoting Both Insulin Resistance and Reduced Insulin Secretion
Lipotoxicity promotes IR, reduced insulin secretion, beta-cell death, and subsequent progression to T2DM. In response to IR, lipotoxicity results in the mobilization of FFA from adipocytes. Adipocytes store and release FFA in
P.143
response to the body's need of an immediate energy source. When plasma glucose levels are diminished, such as during a prolonged fast or period of starvation, the FFAs supply energy in the form of ketone bodies. This alternative fuel is used primarily by the skeletal muscle and heart, ensuring that the central nervous system will lay claim to any remaining glucose as its obligatory energy source. Unregulated FFA release, however, promotes IR and impaired insulin secretion.
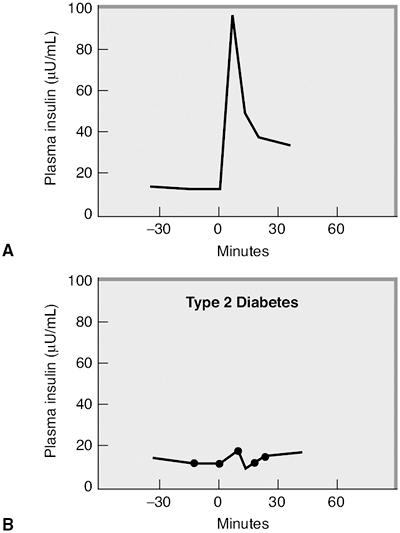 |
Figure 4-9 A: First-phase insulin response is blunted in type 2 diabetes. Normal glycemic subject who was given an intravenous glucose challenge at time 0 after an overnight fast. The insulin levels increase quickly in response to the glucose stimulus, but decrease within 30 minutes. This is a normal first-phase insulin response. (Adapted with permission from Robertson RP, Porte D Jr. The glucose receptor. A defective mechanism in diabetes mellitus distinct from the beta-adrenergic receptor. J Clin Invest. 1973;52:870 876.) B: This patient with type 2 diabetes was given a similar intravenous glucose challenge and demonstrates an absence of first-phase insulin response. |
The two main types of adipose tissue are subcutaneous and visceral adipose tissue (VAT). Eighty percent of body fat is located in the subcutaneous adipose tissue, and 10% is located in VAT.63 Ten percent of the body fat is located in perirenal and peritoneal adipose tissue. Visceral fat, which is prominent in
P.144
obesity, produces higher levels of FFA, which explains the link between obesity and the progression to T2DM. The increase in circulating FFA reduces glucose utilization by skeletal muscle and insulin secretion by the pancreas while promoting hepatic gluconeogenesis. Hyperglycemia is worsened in accordance with the degree of lipolysis (Fig. 4-7). Individuals whose first-degree relative has T2DM tend to have elevated levels of circulating FFA.64 FFA levels are also elevated in prediabetic states (IGT and IFG), resulting in hyperinsulinemia, suggesting that FFAs may actually enhance beta-cell production of insulin. FFAs are a potent insulin secretagogue and can compensate for most of the IR they produce. FFAs induce 30% to 50% of secreted basal insulin.65 In first-degree relatives of patients with T2DM, FFAs are unable to compensate beta-cell insulin secretion fully to overcome the IR they produce.64 Patients with IGT and T2DM also are deficient in FFA-stimulated insulin secretion.65 Therefore, obese individuals in whom T2DM develops have a genetic predisposition to pancreatic beta-cell failure.67 As diabetes progresses, the FFA becomes toxic to beta cells.68 Figure 4-10 depicts the cellular mechanisms by which FFA worsens IR.
Whereas insulin promotes hepatic glucose storage, FFA has the opposite effect by promoting the breakdown of glycogen to glucose as an energy source.69 Insulin also favors hepatic storage of FFA and the production of
P.145
triglycerides. As pancreatic beta-cell functioning diminishes, insulin levels decrease. Rather than being stored as an energy source, FFA plasma levels increase, adding to one's IR. FFA oxidation produces ketone bodies, which are acidic and are not used as an energy source by the body in large numbers. As ketone bodies accumulate in the plasma in association with hyperglycemia driven by low insulin levels, ketoacidosis develops.
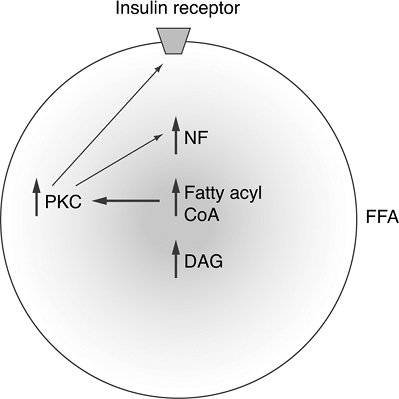 |
Figure 4-10 Mechanism of Insulin Resistance at the Molecular Level via Free Fatty Acid (FFA) Accumulation in Skeletal Muscle Cells. Once FFAs accumulate in skeletal muscle cells, fatty acyl coenzyme A (CoA) and diacylglycerol (DAG) accumulate and activate the protein kinase C (PKC) pathway. High levels of PKC alter the structure of the insulin receptor on the cell membrane, resulting in insulin resistance. An increase in DAG is accompanied by activation of the nuclear factor (NF) pathway. NF has been linked to the pathogenesis of coronary artery disease, which may explain the increased prevalence of heart disease in obese patients with T2DM. (Adapted from Petersen KF, Shulman GI. Etiology of insulin resistance. Am J Med. 2006;119[5 Suppl 1]: S10-S16.) |
Figures 4-8 and 4-11 summarize the pathogenesis of IR at the cellular level and the resulting reduction in insulin secretion in patients with T2DM.
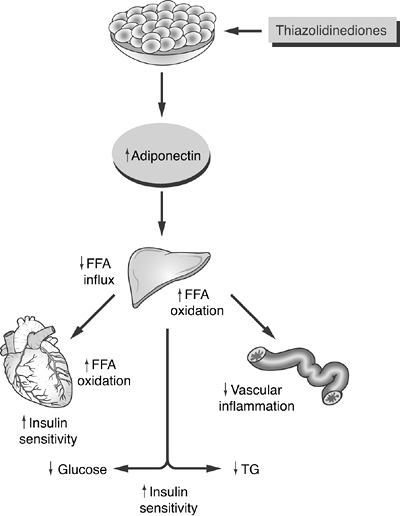 |
Figure 4-11 Possible Model for the Actions of Adiponectin and Thiazolidinediones (TZDs) on Improving Insulin Resistance. In skeletal muscle, adiponectin increases free fatty acid (FFA) oxidation and utilization through direct enhancement of insulin receptors. While FFA levels decrease, insulin sensitivity improves. In the liver, the lowered FFA influx and improved FFA oxidation result in lower levels of hepatic glucose output (gluconeogenesis), as well as lower triglyceride synthesis. Finally, adiponectin stabilizes endothelial cells and reduces inflammatory changes that are associated with atherosclerosis. TZDs directly increase circulating adiponectin levels, which are deficient in the insulin-resistant state. TG, triglyceride. (Adapted with permission from Chandran M, Phillips SA, Ciaraldi T, Henry RR. Adiponectin: more than just another fat cell hormone? Diabetes Care. 2003;26:2442 2450.) |
P.146
Nonalcoholic Steatohepatitis (A Precursor to Type 2 Diabetes)
Seventy-five percent of patients with T2DM have evidence of nonalcoholic steatohepatitis (NASH).70 This fatty liver infiltration has two presentations. Primary NASH is associated with metabolic syndrome, obesity, and T2DM. Secondary NASH develops after bariatric surgery; rapid weight loss in severe clinical obesity; pregnancy; total parenteral nutrition; and as an adverse event in patients using certain drugs such as amiodarone, warfarin, corticosteroids, tamoxifen, methotrexate, estrogen, and tetracycline. NASH is found in 18.5% of obese patients, compared with 2.7% of lean individuals.71 Most patients with fatty liver infiltration are asymptomatic. However, half of patients with NASH report persistent fatigue, malaise, or upper abdominal discomfort. Progression of NASH to cirrhosis or fibrosis can result in ascites, edema, jaundice, and fever. The diagnosis of NASH can be made only with a liver biopsy. The laboratory findings suggestive of NASH are noted in Table 4-8.
NASH develops in two stages. As peripheral resistance to insulin action begins in visceral fat, increasing lipolysis, the transport of FFA from adipose tissue to the liver is increased, resulting in steatosis.72 Next, oxidative stress and cytokine tumor necrosis factor (TNF) directly damage hepatic mitochondria, beginning an inflammatory process, hepatocellular degeneration, and fibrosis.73
PPARs play an important role in defending the liver against FFA-induced toxicity by sensing elevated FFA levels and upregulating genetic programs to clear the FFAs.70 PPARs cannot overcome the effects of hyperinsulinemia on increased lipolysis.
Currently, no widely accepted and U.S. Food and Drug Administration (FDA) approved pharmacologic approaches exist for NASH. Treatment should focus on normalizing risk factors considered to be involved in the etiology of NASH, as listed in Table 4-9. Thiazolidinediones improve insulin sensitivity by binding with the PPAR receptors. As genetic modulation is enhanced within adipose tissue, plasma FFA levels are reduced, thereby protecting the liver against NASH and improving IR. Both rosiglitazone74 and pioglitazone75 have been shown to improve alanine aminotransferase (ALT) levels and reduce hepatic fat content. Whether the improvements in liver disease are the result of improved peripheral insulin sensitivity or the direct anti-inflammatory effects these drugs may have on hepatocytes is uncertain. Metformin also shows promise as a NASH therapeutic agent. Metformin inhibits the action of TNF, which, as a cytokine, may directly promote hepatic steatosis and cell death. In one study, treatment of 14 NASH patients with metformin, 500 mg TID for 4 months, normalized transaminase levels, improved insulin sensitivity, and decreased liver volume in 50% of the patients.76 Cytoprotective agents, adiponectin, antioxidants, iron-reduction therapy, and lipid-lowering medications are currently being investigated for the treatment of NASH.
P.147
TABLE 4-8 Diagnostic Criteria for Nonalcoholic Steatohepatitis (NASH) | ||||||||||||||||||||||||
|---|---|---|---|---|---|---|---|---|---|---|---|---|---|---|---|---|---|---|---|---|---|---|---|---|
| ||||||||||||||||||||||||
P.148
TABLE 4-9 Treatment Approaches for Patients with NASH | ||
|---|---|---|
|
Role of Environmental Factors in the Pathogenesis of Type 2 Diabetes
Clearly, environmental factors, such as obesity, favor the progression of genetically susceptible individuals from a state of normal glycemia through IGT and into chronic hyperglycemia. Obesity causes peripheral resistance to insulin-mediated glucose uptake as well as a decrease in the sensitivity of pancreatic beta cells to hyperglycemia.77 These metabolic abnormalities are largely reversed with moderate weight reduction. The mechanisms by which obesity induces IR include the following:
Free fatty acids. The elevated FFA levels associated with obesity impair insulin secretion and inhibit insulin-stimulated glucose uptake in patients with T2DM.68
Tumor necrosis factor- . Studies in genetically altered obese animals have demonstrated an increase release of TNF- from adipocytes, which results in impairment of insulin action. Weight reduction in obese animals is associated with improvement in insulin activity and a decrease in TNF- gene expression.78
Adiponectin. A number of observations suggest that a deficiency of adiponectin, an adipocyte-derived hormone, plays a role in the development of IR and the progression towards T2DM (see Chapter 2).79
Resistin and leptin (adipocytokines). Leptin influences feeding behavior, energy balance, and body-fat stores, whereas resistin, as modulated through PPAR- receptors, antagonizes insulin action and impairs glucose tolerance. These hormones appear to link obesity with diabetes.80
P.149
TABLE 4-10 Drugs That Induce Hyperglycemia
- Thiazide diureticsa
- Central beta-blockers
- Monoxidil
- Beta-blocking agentsb
- Protease inhibitors
- Atypical antipsychotic agents
- Corticosteroids
- Oral contraceptives
- Pentamidine
- Isoniazid
- L-Dopa
- Theophylline
aEffects may be dose dependent, with hyperglycemia seen most commonly at higher doses.
bIndividual beta-blocking agents have variable effects on insulin resistance. Carvedilol, with both beta- and alpha-blocking properties, may have favorable effects on insulin sensitivity and glucose tolerance when compared with metoprolol or atenolol.Pattern of fat distribution. Android (upper body) obesity has a much greater association with IR and IGT than does gynoid (lower body) obesity.
Intrauterine development. Malnutrition during fetal or early life may lead to the expression of the thrifty genotype. Intrauterine growth restriction leading to low birth weight appears to be associated with an increased risk of adulthood IR, glucose intolerance, T2DM, dyslipidemia, and hypertension.81
Drug-induced hyperglycemia. Many commonly used drugs have been associated with treatment-emergent hyperglycemia and diabetic ketoacidosis (Table 4-10). The specific causes for the induction of hyperglycemia in many of these agents is uncertain. High-risk patients, such as those requiring the use of corticosteroids, second-generation antipsychotics, or protease inhibitors, should be carefully monitored for treatment-emergent hyperglycemia (Table 4-11). Drugs should not be withheld from use simply because of their potential for inducing hyperglycemia. Patients in whom hyperglycemia develops when using agents such as corticosteroids, second-generation antipsychotics, or protease inhibitors should have their diabetes managed concurrently by using appropriate therapeutic modalities.
P.150
TABLE 4-11 Screening Recommendations for Diabetes Mellitus in Patients Receiving Treatment with Protease Inhibitors or Atypical Antipsychotic Agents | ||
|---|---|---|
|
Genetic Susceptibility for Type 2 Diabetes
The development of T2DM diabetes is strongly influenced by genetics. Thirty-nine percent of patients with T2DM have at least one parent with the disease.82 The lifetime risk for a first-degree relative of a patient with T2DM diabetes is 5 to 10 times higher than that of age- and weight-matched subjects without a family history of diabetes.83 Among monozygotic twin pairs with one affected twin, T2DM eventually develops in 60% to 90% of unaffected twins.82 First-degree relatives of patients with T2DM often have impaired glucose tolerance, delayed first-phase insulin response, and beta-cell dysfunction years before diabetes develops.84,85
Approximately 2% to 5% of patients with type 2 diabetes are first seen at a young age, have mild disease, and show autosomal dominant transmission. This condition was formerly called maturity-onset diabetes of the young (MODY). In the new classification, the MODY subtypes have been eliminated and replaced by specific descriptions of the known genetic defects. It is anticipated that other subtypes of type 1 and type 2 diabetes will become more clearly defined in the future. Six different genetic abnormalities have been identified. The currently recognized genetic defects of beta-cell function are described in Table 4-12.
P.151
TABLE 4-12 Genetic Defects Associated with Type 2 Diabetes | ||||||||||||||||
|---|---|---|---|---|---|---|---|---|---|---|---|---|---|---|---|---|
| ||||||||||||||||
Pharmacologic Intervention for Type 2 Diabetes
When lifestyle interventions including weight reduction and exercise fail to reduce glycemia to the desirable range, oral antihyperglycemic agents should be initiated. Nine years after randomization, only 9% of obese patients with T2DM in the United Kingdom Prospective Diabetes Study (UKPDS)86 were able to maintain an A1C less than 7%.
P.152
Because of the progressive nature of the disease, nearly all patients with T2DM will eventually require insulin to treat their hyperglycemia. Additionally, T2DM is associated with metabolic abnormalities such as hypertension, hyperlipidemia, endothelial inflammation, and procoagulation, all of which increase one's risk of early cardiovascular morbidity and mortality. The assessment and management of these comorbid conditions are imperative. One can understand how T2DM is in no way a simple form of diabetes, as many patients are led to believe.
The goals of pharmacologic intervention in T2DM are to normalize hyperglycemia, improve insulin sensitivity, preserve beta-cell function, reduce hepatic glucose output, improve peripheral glucose utilization, and delay or prevent microvascular and microvascular complications. Many factors must be considered when designing treatment programs for patients with T2DM, including
The age and gender of the patient
The length of time the patient has had T2DM
The individual patient's coexisting metabolic abnormalities (hyperlipidemia, hypertension, obesity, hypertension, infertility, thyroid disorder)
The presence of microvascular or macrovascular complications
A family history of microvascular or macrovascular complications
Socioeconomic status
Type of employment as well as work hours (sleep dysfunction or erratic sleep schedules may complicate the ability of the patient to achieve targeted A1C levels)
Lifestyle variables: smoking, alcohol, or substance-abuse history, activity level, meal schedule
Prior treatment successes and failures
Presence and severity of diabetes-related symptoms
The development of new classes of blood glucose lowering medications to supplement the older therapies, such as lifestyle-directed interventions, insulin, sulfonylureas, and metformin, has increased the treatment options for T2DM. Whether used alone or in combination with other blood glucose lowering interventions, the availability of the newer agents has provided an increased number of choices for practitioners and patients and heightened uncertainty regarding the most appropriate means of treating this widespread disease.
Although the ADA does not provide guidelines on when oral hypoglycemic agents should be initiated, a consensus panel has suggested that an A1C of 7% or greater should serve as a call to action. Patients with A1Cs of 7% or greater should intensify their treatment regimens to achieve an A1C as close to the nondiabetic range ( 6%) as possible or, at a minimum, strive to lower their A1C to less than 7% (Table 4-13). Of course, clinical judgment based on the potential benefits and risks of intensification needs to be exercised for each patient. Patients with a short life expectancy, those at high risk of hypoglycemia (especially if they live alone), and individuals with history of medical comorbidities such as coronary artery disease or stroke may not be
P.153
suitable candidates for treatment intensification.86a The best outcomes for T2DM management have been noted when intensive treatment is initiated early in the course of the disease (46,89). Although the method by which one targets normoglycemia is less important than actually safely achieving the desired goals, clinicians should be mindful of their many treatment options as shown in Figure 4-12.
TABLE 4-13 Glycemic Targets for Adults with Diabetes Based on Guidelines Published by the American Diabetes Association (ADA) and the American Association of Clinical Endocrinologists (AACE) | |||||||||||||||
|---|---|---|---|---|---|---|---|---|---|---|---|---|---|---|---|
| |||||||||||||||
Metformin should be initiated concurrent with lifestyle intervention at the time of the diagnosis. Because T2DM is a metabolic disorder in which the level of hyperglycemia mirrors the progressive failure of beta-cell function, lifestyle interventions fail to achieve and maintain targeted glycemic goals in most patients.
Metformin is an excellent choice as the initial pharmacologic therapy because of its effect on glycemia, absence of weight gain or induction of hypoglycemia, generally well accepted side effect profile, low cost, and broad-based formulary acceptance.
When metformin is initiated as monotherapy, titrate to the maximum effective dose over 1 to 2 months as tolerated. Supplement with additional glucose-lowering drugs in the setting of persistent hyperglycemia.
When adding a second agent to metformin, consider which agent will most likely allow the patient to achieve his or her targeted A1C level.
Consider initiating insulin therapy for patients having an A1C greater than 8.5 %, especially if they have symptomatic hyperglycemia.
P.154
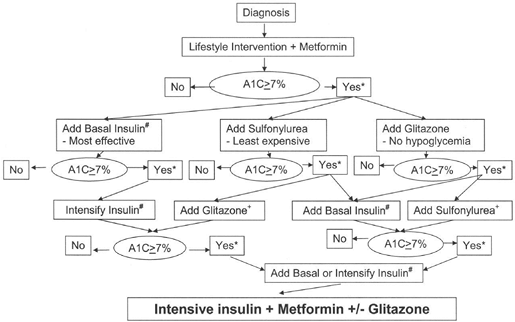 |
Figure 4-12 Initiation and Intensification of T2DM Pharmacotherapy. (From Nathan DM, Buse JB, Davidson MB, et al. Management of hyperglycemia in type 2 diabetes: a consensus algorithm for the initiation and adjustment of therapy. Diabetes Care. 2006;29:1963 1972, with permission.) |
One should be mindful that the consensus guidelines shown in Figure 4-12 do not specifically mention which patients should be treated with incretin mimetic agents or dipeptidyl peptidase IV (DPP-IV) inhibitors. When initiating insulin therapy, should the oral agents be maintained or discontinued? Is inhaled insulin an appropriate bridge therapy for patients taking oral agents? Which patients might respond to novel treatment regimens, such as basal insulin analogues plus prandial doses of pramlintide or exenatide? PCPs have many treatment options for their patients. Although the means to intensify T2DM therapy may be unique for each patient, the ultimate goals for all patients are similar:
Achieve and maintain normal glycemia.
Once type 2 diabetes is diagnosed, begin lifestyle intervention and metformin.
Rapidly add other medications to a patient's treatment regimen when glycemic targets are not achieved or sustained.
Insulin should be added sooner (as opposed to later) to the patient's treatment regimen if the A1C cannot be maintained below 7% on oral agents or if the patient has symptomatic hyperglycemia.86a
In 2006, The American Association of Clinical Endocrinologists (AACE) published a Road Map, which is an effective tool for managing patients in
P.155
all stages of diabetes.87 AACE members philosophically believe that the ultimate goal of diabetes management should be targeting blood glucose and A1C levels as to near normal as possible. By using the Diabetes Control and Complication (DCCT)-referenced nondiabetic A1C range of 4% to 6%, management of T2DM should strive to achieve an A1C as close to 6% as possible. Normal 2-hour postprandial blood glucose levels are less than 140 mg per dL, whereas normal physiologic fasting glucose levels are less than 110 mg per dL. Attaining these targeted goals requires a great deal of time and effort on the part of the patient and the medical providers. Although some may argue that achieving and maintaining an A1C less than 6.5% is unrealistic for many patients, those who can safely reach this A1C should notice a reduction in long-term diabetes-related complications.
The level to which the A1C should actually be targeted for patients with T2DM may become less controversial once the results from the Action to Control Cardiac Risk in Diabetes (ACCORD) trial are revealed.
The ACCORD trial is a multicenter trial funded by the National Heart and Lung Institute designed to determine whether intensive glycemic control, treatment to increase HDL-C and lower triglycerides, and intensive blood pressure control reduce cardiovascular events in patients with T2DM.88 More than 10,000 patients with diabetes at high risk for cardiovascular disease will be recruited and followed up for 4 to 8 years. The results of the study will be available in 2007. The primary outcomes of the ACCORD trial include the following:
Blood sugar. ACCORD will determine whether reducing blood glucose to a goal closer to normal than called for in current guidelines reduces cardiovascular risk. The targeted A1C will be less than 6%.
Blood pressure. The blood pressure part of the trial will evaluate the effects of reducing blood pressure in the context of good blood glucose control. ACCORD will determine whether reducing systolic blood pressure to less than 120 mm Hg will reduce cardiovascular risk better than the usually targeted level of less than 140 mm Hg.
Lipids. This part of the study will look at the cardiovascular end points associated with reducing LDL-C and triglyceride levels, and increasing HDL-C, compared with an intervention that reduces only LDL-C, all in the context of good blood glucose control. Fibrates will be used to reduce triglycerides and increase HDL levels, whereas statins will be used to reduce LDL-C levels.
Oral Hypoglycemic Agents
Until the 1990s, prescribers in the United States had only two drug-therapy classes to choose from to control hyperglycemia associated with T2DM: insulins and sulfonylureas. The introduction of metformin (a biguanide, in 1995), acarbose (an glucosidase inhibitor, in 1995), and troglitazone (a thiazolidinedione, in 1997) in the United States gave clinicians the opportunity to treat
P.156
hyperglycemia in ways other than by increasing circulating insulin concentration, including ways that directly affected the underlying pathophysiology of the disease. More recently, other oral agents (e.g., repaglinide), thiazolidinediones (rosiglitazone and pioglitazone), combination drugs (e.g., glyburide plus metformin), and the DPP-IV inhibitors (sitagliptin and vildagliptin) have further expanded the therapeutic arsenal.
The six available classes of oral agents target different metabolic defects associated with T2DM. Each drug promotes improved glycemia when used alone or in combination therapy. Initiation of an oral agent should be guided by the targeted metabolic defect that must be managed at any given time.
Once oral hypoglycemic therapy is initiated, patients must become active participants in diabetes self-management. Contrary to the belief held by many patients, T2DM is certainly not a mild form of diabetes. Blood glucose self-monitoring, medical nutrition therapy, enhancing one's active lifestyle, and professional surveillance to determine if the targeted metabolic goals are being achieved are all necessary to lessen the impact associated with diabetes-related complications. Patients should be aware of the potential risks and clinical benefits of the different types of oral hypoglycemic agents. Some medications may increase weight or induce hypoglycemia, whereas others must be held before undergoing certain diagnostic procedures. The continued use of oral hypoglycemic agents in the acute hospital setting may be detrimental.90 Insulin is the preferred drug for patients with diabetes admitted to the hospital for acute illness. Insulin may also be necessary in certain situations that complicate the management of T2DM, such as during the concomitant use of corticosteroids, for patients requiring surgery, for patients with restricted oral intake, or in those patients who become pregnant while taking oral agents.
Sulfonylureas
The first oral agents for treating T2DM were initially marketed in 1957 as sulfonylureas. Although the first-generation sulfonylureas (orinase, tolinase, and diabinese) can improve hyperglycemia, potential drug interactions resulting in hypoglycemia make these drugs less attractive than the second-generation drugs. The second-generation sulfonylureas (glipizide and glyburide) were first introduced in 1984, and glimepiride followed in 1996. During the 11-year period from 1990 to 2001, a 3.9-fold increase (from 23.4 million to nearly 92 million) occurred in the dispensing of outpatient prescriptions for oral antidiabetic drugs.91 Only 21.5 million prescriptions were dispensed in 1986.92 This rapid increase in prescriptions coincides with the increase in the incidence of T2DM diabetes in the United States.
Sulfonylureas are known as secretagogues because their binding to pancreatic beta-cell receptors results in an increase in insulin production and secretion through a complex series of intracellular events. Once bound to the sulfonylurea (SUR) receptor on the pancreatic beta-cell plasma membrane,
P.157
the potassium channel closes. This reduces the exit of potassium from the beta cell, resulting in depolarization, allowing calcium influx through the plasma membrane. Increased levels of intracellular calcium result in prompt release of insulin into the plasma.93
All sulfonylureas may not be equal in regard to efficacy and side-effect profile. Glimepiride has been shown to improve first- and second-phase insulin output,94 whereas other sulfonylureas are thought to improve only second-phase insulin response. Glimepiride has been shown in a European study to have many fewer incidents of hypoglycemia than glibenclamide, a European sulfonylurea.95 Although long-term therapy with any sulfonylurea can result in weight gain, a meta-analysis study of more than 14,000 patients demonstrated far less weight gain with glimepiride in comparison with other sulfonylureas.96
Glimepiride may have a different mechanism of action than that of other sulfonylureas. Glimepiride improves hyperglycemia by improving the efficiency of the intracellular glucose transporter protein known as GLUT4.97 Glucose is cleared from the bloodstream by a family of facilitative transporters (GLUTs), which catalyze the transport of glucose down its concentration gradient and into cells of target tissues, primarily striated muscle and adipocytes. GLUT4 transporter proteins are sequestered into specialized storage vesicles that remain within the cell's interior under fasting conditions. As postprandial glucose levels increase, the subsequent increase in circulating insulin activates intracellular signaling cascades that move (translocate) GLUT4 storage compartments to the plasma membrane (Fig. 4-8). As plasma insulin levels decline, GLUT4 transporters are moved away from the cell membrane and back into intracellular storage compartments. Alterations in GLUT4 translocation will result in inadequate insulin release in response to hyperglycemia.98 Glimepiride may be insulin sparing. Subjects taking glimepiride have been shown to have lower fasting plasma insulin and C-peptide (a measure of endogenous insulin secretion) than do those taking glyburide.97
Treatment with sulfonylureas generally results in a 1% to 2% reduction in A1C levels.99,100 Sulfonylureas are effective agents as monotherapy or in combination with other oral agents and insulin, which have different mechanisms of action.101 Side effects of sulfonylureas include weight gain,102 which could be significant when used in patients who are already struggling with obesity. Hypoglycemia risk becomes a factor as patients' overall glycemic control approaches normal targets. Elderly patients may be at increased risk of developing hypoglycemia when initially placed on sulfonylureas.103 Long-acting sulfonylureas such as chlorpropamide and glyburide are more likely to cause hypoglycemia.104
Sulfonylureas should be initiated at low doses and increased weekly until target fasting blood glucose levels are less than 110 mg per dL. For best efficacy, sulfonylureas should be given 1 hour before breakfast (to improve first-phase insulin release) and/or at bedtime (to reduce overnight hepatic glucose production).5
P.158
P.159
Patients first seen with newly diagnosed type 2 diabetes and blood glucose levels more than 300 mg per dL could be started on glipizide XL, 20 mg at bedtime, and monitored for glycemic improvement. Usually blood glucose levels and diabetes-related symptoms improve dramatically within 3 to 4 days. After 2 weeks, assuming glucose control is improved, the dose of the glipizide can be reduced and metformin initiated. Another option would be to continue the same high-dose glipizide while adding metformin to the treatment regimen.5 Long-duration hyperglycemia can induce beta-cell toxicity, which may not respond to low-dose secretagogue therapy. Higher-dose sulfonylureas might therefore be more appropriate in these patients.
Case 3
A 43-year-old Hispanic woman with a history of gestational diabetes at the time of her last pregnancy (12 years ago) appears in the emergency department complaining of thirst, fatigue, blurred vision, weight loss, and frequent urination for 7 days. She denies any other significant medical history, other than having had a C-section for her last pregnancy 5 years ago because of failure to progress in labor. The baby's weight at birth was 9 pounds 4 ounces. On examination, the patient is not in any distress. Blood pressure is 138/92, pulse is 78, temperature is 98.6 , respirations are 16, BMI is 32 kg per m2, and her waist circumference is 41 inches.
Her baseline laboratory values are as follows:
Blood glucose, 387 mg per dL
Na+, 138 mmol per L
K+, 4.6 mmol per L
Blood urea nitrogen (BUN), 20 mg per dL
Creatinine, 1.1 mg per dL
Chloride, 104 mmol per L
Carbon dioxide, 25 mmol per L
Urine ketones, trace +
Serum ketones, negative
A1C, 9.2% (ADA target, <7%)
Liver function tests
ALT, 72 U per L (normal range, 2 to 60)
Aspartate aminotransferase (AST), 61 U per L (normal range, 2 to 50)
Lipid panel
Triglycerides, 335 mg per dL
HDL-C, 32 mg per dL
LDL-C, 130 mg per dL
Total cholesterol, 224 mg per dL
Non HDL-C, 192 (target, <130)
Thyroid studies: Normal
CBC: Normal
The patient was diagnosed as having T2DM with comorbidities including obesity, hypertension, NASH, and an atherogenic dyslipidemia. She was advised to take glipizide XL, 20 mg at bedtime, and to begin home blood glucose monitoring, fasting and at bedtime, until seen by her PCP in 2 weeks. The table shows the results of her blood glucose monitoring.
| Date | AM Glucose (mg/dL) | Bedtime Glucose (mg/dL) |
|---|---|---|
| 9/4 | 322 | 301 |
| 9/5 | 245 | 276 |
| 9/6 | 221 | 193 |
| 9/7 | 176 | 189 |
| 9/8 | 134 | 201 |
| 9/9 | 121 | 154 |
| 9/10 | 102 | 125 |
| 9/11 | 121 | 113 |
When evaluated on 9/12, she is no longer symptomatic and has gained 1 pound over the past week. The decision is made to decrease the glipizide XL to 10 mg at bedtime and to begin metformin, 500 mg, with breakfast and dinner. On her return in 9 weeks, a point-of-service A1C documents a decrease in her baseline level to 7.1%. Her blood pressure is 124/72, and her BMI is 30 kg per m2. The patient has been attending group diabetes education classes, has joined a ladies-only workout center, and is exercising 30 minutes, 5 days weekly. Repeated liver function studies revealed that her transaminase levels had normalized, most likely because of her 10-pound weight reduction. Her non HDL-C is now 126 mg per dL. The patient was advised to continue her metformin and to begin monitoring her blood glucose level, fasting and 2 hours after supper (her largest meal of the day), on 3 days each week until her next visit. Because her metabolic condition appears to be stabilized, renal function studies will be performed, including a spot urine for microalbuminuria and a glomerular filtration rate (GFR) determination. An ophthalmology consult will be scheduled for the patient.
Of interest is the fact that although this patient had gestational diabetes, she gave birth to a son weighing 10 pounds. When asked by the PCP how much her 12-year-old now weighs, she did not hesitate in saying his weight was well over 160 pounds. His pediatrician had been concerned that the boy was becoming clinically obese. The PCP mentions that her son is at high risk for developing T2DM as an adolescent, which could result in significant cardiovascular risk when he reaches his 20s (see Chapter 2). Lifestyle interventions that were beneficial for the patient should also be used by the son to reduce the chance of diabetes and cardiovascular disease developing.
P.160
TABLE 4-14 Cardiovascular Risks Associated with the Use of Oral Hypoglycemic Agents | ||||||||||
|---|---|---|---|---|---|---|---|---|---|---|
| ||||||||||
The use of sulfonylureas may improve the chance of microvascular complications developing.46 However, no outcome data from prospective clinical trials have been published demonstrating a reduction in macrovascular risk associated with the use of sulfonylureas. Some105,106 but not all107,108 retrospective analyses have demonstrated worse cardiovascular outcomes in patients taking sulfonylureas compared with those taking metformin or TZDs (Table 4-14).
Meglitinides
Although patients with T2DM may have high fasting insulin levels and a reduction in insulin action, a blunted or absent first-phase insulin response to a glycemic challenge is also present. Most sulfonylureas (except glimepiride) increase pancreatic beta-cell insulin secretion as well as plasma insulin concentrations, yet fail to improve first-phase insulin release. The meglitinides do increase early insulin response, allowing improved postprandial glycemic control.109 Drugs in this class include nateglinide (Starlix) and repaglinide (Prandin). Both agents are rapid-acting insulin secretagogues. When the drugs are taken 15 minutes before a meal, postprandial glucose excursions can be minimized. This is important because significant postprandial hyperglycemia has been associated with cardiovascular morbidity.110,111,112 In randomized placebo-controlled clinical trials, repaglinide appears to reduce
P.161
the A1C more significantly than nateglinide (-1.9% at 6 months vs. 1% at 24 weeks).113,114 Side effects are similar to those of sulfonylureas and include weight gain. Hypoglycemia is less common with meglitinides than with sulfonylureas,15 because the stimulation of insulin release is rapid, easily reversible, and glucose dependent from beta cells.116 In low doses, these drugs may prove beneficial in slowing the progression from IGT to diabetes by reducing postprandial hyperglycemia.117 However, their use in patients with IGT may result in more frequent hypoglycemia, suggesting that the lowest doses of meglitinides should be used in prediabetes.
Meglitinides are more expensive than sulfonylureas. Both repaglinide and nateglinide are approved for use as monotherapy and in combination with TZDs and metformin. Although long-term outcome data are unavailable for this drug class, their effects on improving diabetes-related complications are likely to be at least similar to those observed with sulfonylureas.
-Glucosidase Inhibitors
-Glucosidase inhibitors (AGIs) block the action of -glucosidase enzymes at the brush border of the intestine. The inhibition slows the breakdown of dietary oligosaccharides and disaccharides. The delayed digestion of carbohydrates decreases postprandial glucose concentrations.118 The two members of this drug class include acarbose (Precose) and miglitol (Glyset). In placebo-controlled trials, AGIs have been shown to reduce AIC levels by only 0.5% to 1.0%119,120,121,122 and are therefore considered less effective than other oral agents. AGIs are approved for use as monotherapy and in combination with sulfonylureas and metformin.
The use of AGIs in managing diabetes has been limited in the United States because of the side effects, which include abdominal bloating, cramping, and flatulence. Patients will frequently discontinue use of these drugs because of these uncomfortable side effects. The use of acarbose has been shown to reduce the incidence of T2DM by 25% over a 3.3-year period compared with placebo, regardless of age, sex, or BMI.18 In post hoc analysis of data from the Study to Prevent Non Insulin-Dependent Diabetes Mellitus trial (Stop NIDDM), acarbose was observed to have an impressive effect on risk of myocardial infarction, supporting the view that postprandial hyperglycemia has a greater influence on cardiovascular events than does fasting glucose.123
Metformin
Metformin, a biguanide, is commonly referred to as an insulin sensitizer because glucose levels improve without stimulation of insulin secretion. Metformin acts by decreasing hepatic glucose production, decreasing glucose absorption, and increasing glucose uptake into skeletal muscle.124,125 As circulating glucose levels are reduced, peripheral IR at the skeletal muscle site and adipose tissue may also improve. At the molecular level, metformin appears
P.162
to improve glucose transport into skeletal muscle cells. This action appears to be additive in the presence of insulin, suggesting an insulin-dependent enhancement to the drug's effect.126
Metformin as monotherapy has numerous beneficial effects on metabolic parameters and diabetes prevention. In the DPP, patients with IGT or impaired fasting glucose receiving metformin, 850 mg twice daily, had a 31% reduction in progression toward diabetes. Those individuals randomized to lifestyle intervention (exercising 150 minutes per week and weight loss of 7% of baseline body weight) had a reduction of 58%. Metformin was found to be most effective in reducing progression toward diabetes12 in subjects younger than 45 as well as in individuals with a BMI greater than 35 kg per m2. The diagnosis of the primary outcome, diabetes, was based either on a 75-g oral glucose tolerance test (OGTT) with FPG or 2-hour glucose exceeding 125 or 199 mg per dL, respectively, or on 6-month FPG, exceeding 125 mg per dL. Metformin was particularly effective in decreasing diabetes among individuals with FPG exceeding 110 mg per dL, whereas the lifestyle intervention was similarly effective in persons above and below this level. Half of those treated with metformin experienced GI side effects, and some reduced the dose to 850 mg once daily. No evidence indicates whether combined lifestyle metformin treatment would have an additive benefit. Patients with prediabetes who are unable to or unwilling to participate in lifestyle-intervention programs might benefit from pharmacologic therapy using metformin.
Metformin has been shown to improve inflammatory markers linked to cardiovascular risk. The drug reduces triglyceride levels by 10% to 30%,127 LDL-C and total cholesterol by 5% to 10%,128 while having no significant influence on HDL-C levels.129 Metformin has no effect on blood pressure.127 Levels of fibrinogen130 and CRP131 are also lower in metformin-treated patients.
The UKPDS showed that obese patients using metformin as monotherapy had a lower risk of myocardial infarction and stroke when compared with subjects taking metformin with a sulfonylurea.105 Although the risk of vascular disease was slightly higher when metformin was used in combination with a sulfonylurea, most authorities believe these numbers to be statistically insignificant.132
In placebo-controlled trials,133,134,135 metformin consistently lowers A1C by 1% to 2%, similar to secretagogues. Metformin is approved for use alone or in combination with all other antidiabetic agents, as well as exenatide and pramlintide. Patients with polycystic ovary syndrome who take metformin have improved ovulatory function and show a reduction in parameters suggestive of IR136.
Extended-release metformin (Glucophage XR, Fortamet, Glumetza) offers the option of giving the drug as a single daily dose with the largest meal of the day. Improvements in glycemic control have been shown to be similar in patients taking once-daily extended-release metformin or the traditional twice-daily dosing schedule, whereas the gastrointestinal side effects were equal in both groups over a 24-week period.137
Gastrointestinal side effects of metformin are common and can be minimized by slow-dose titration and by taking the medication while in the process of eating. Because of the rare risk of lactic acidosis (characterized by
P.163
elevated blood lactate levels more than 5 mmol per L, an increased lactate-to-pyruvate ratio, and an increased anion gap), several contraindications limit this drug's use, including renal and liver dysfunction, heart failure, dehydration, and alcohol abuse. Metformin therapy is considered inappropriate if the baseline serum creatinine level is 1.5 mg per dL or more for men or 1.4 mg per dL or more for women. Adverse-event reports suggest that the incidence of metformin-associated lactic acidosis is between 1 in 10,000 and 1 in 100,000 patient-years.138
In the first 14 months after metformin was released in the United States, the FDA received confirmation of 47 cases of metformin-associated lactic acidosis, with a 42% mortality rate.139 More than 90% of patients in whom lactic acidosis developed had a relative or absolute contraindication for using metformin. In elderly patients, the GFR may the best way to evaluate renal function and predict one's increased risk of metformin treatment-emergent lactic acidosis developing. Serum creatinine levels overestimate the GFR by up to 19%.140 A GFR calculator is available at the National Kidney Foundation Web site: http://www.kidney.org/professionals/kls/gfr_calculator.cfm. A GFR of 60 mL per minute or less for more than 3 months is considered diagnostic of chronic renal failure.141 Metformin should not be used in these individuals.
Lactic acidosis is subtle in onset. Symptoms include malaise, myalgias, respiratory distress, fatigue, and abdominal discomfort. As the acidosis intensifies, patients will become hypothermic, hypotensive, and drug-resistant bradyarrhythmias may develop. Despite the warnings regarding treatment-emergent lactic acidosis associated with the use of metformin, 22% to 54% of patients taking the drug have an absolute or relative contraindication to its use.138,142 Hospitalized patients taking metformin often do not have the drug discontinued despite having at least one risk factor for lactic acidosis developing.143 A recent review of patients discharged from the hospital with a diagnosis of congestive heart failure and diabetes found that 11% were given a prescription for metformin.144 Most experts on diabetes management believe that metformin should not be used in the acute hospital setting.
The use of iodinated contrast material for studies including intravenous pyelography, intravenous cholangiography, angiography, and computed tomography (CT) scanning may induce acute renal failure, resulting in lactic acidosis in metformin-treated patients. Metformin should be temporarily stopped immediately before the planned procedure and withheld for 48 hours once the procedure is completed. The patient's renal status should always be reassessed before resuming metformin.
Thiazolidinediones
The two TZDs currently available are pioglitazone and rosiglitazone. Thiazolidinediones act (a) by stimulating the PPAR- receptor, which promotes insulin-sensitizing effects on skeletal muscle and adipose tissue; and (b) by inhibiting hepatic gluconeogenesis. Stimulation of the PPAR receptors modulates the activity of the cell's genes and helps to regulate both carbohydrate and lipid
P.164
metabolism. In adipose tissue, PPAR- activation causes pre-adipocytes to differentiate into mature fat cells while promoting lipid synthesis.145
TZDs enhance the effects of insulin on the liver, thereby reducing hepatic glucose production (gluconeogenesis and glycogenolysis).146 FFA suppression by TZDs can improve insulin sensitivity while preserving pancreatic beta-cell function. TZDs suppress both fasting and postprandial levels of FFA, which can significantly improve IR affecting the liver and skeletal muscles.146,147
Adiponectin also plays an important role in the modulation of glucose and lipid metabolism. Low levels of circulating adiponectin have been linked with human obesity148 as well as IR and dyslipidemia.149 Plasma adiponectin levels are significantly lower in patients with T2DM but can be increased rapidly when TZDs are initiated.150 In addition, plasma adiponectin levels in diabetes patients with evidence of coronary artery disease (CAD) are lower than those in diabetes patients without CAD, suggesting that adiponectin may be cardioprotective as well as endothelial cell protective.151
Studies of skeletal muscle function in mice have suggested that adiponectin improves FFA transport and oxidation. Lower levels of circulating FFA improve IR. In the liver, low levels of adiponectin have been shown to reduce FFA transport,151 which in turn worsens IR (Fig. 4-11).
The exact means by which TZDs improve plasma levels of adiponectin may involve the ability of PPAR- to enhance the expression of adipocyte genes responsible to increase the production of adiponectin.152
PPAR- activation by TZDs promotes the differentiation of small adipocytes into larger adipocytes, resulting in weight gain and an absolute increase in adipose cell mass. As a result, patients who use TZDs may experience modest weight gain in association with improvement in their blood glucose and lipid levels. TZDs have been postulated to improve insulin sensitivity by redistributing fat from visceral to subcutaneous adipose tissue.153 PPAR- is expressed at highest concentrations in adipose tissue and at much lower concentrations in liver and muscle,154 suggesting that the primary action of TZDs is on adipose tissue.
IR occurs in association with a number of metabolic abnormalities that improve when TZDs are added to the therapeutic regimen. For example, patients with IR tend to have a predominance of small, dense, atherogenic LDL particles that are susceptible to oxidation, an important step in the atherosclerotic process. TZDs increase the ratio of large, buoyant LDL to small, dense LDL particles, reducing the degree of atherogenesis.155,156 Small, dense LDL particles easily lodge themselves into vessel walls that have been damaged by inflammation, where they become oxidized. Large, buoyant LDL particles are too hefty to become wedged within the vessel walls and instead simply bounce through the blood vessels, causing minimal harm. Although lipid profiles tend to improve with the use of TZDs, patients older than 40 with diabetes should still be provided with statins.157
Pioglitazone may decrease the concentration of conjugated oral contraceptives (COCs). Therefore, patients taking pioglitazone and COCs should
P.165
be informed of this potential interaction.158 Additionally, TZDs may cause resumption of ovulation in premenopausal anovulatory women.159
In summary, activation of PPAR- results in higher expression of adiponectin from adipose tissue, reducing plasma levels of FFA, thereby improving IR and redistributing fat from metabolically active VAT to metabolically inactive subcutaneous fat. In diabetes, as FFA levels increase, IR worsens, within both the liver and the skeletal muscle sites, causing the pancreatic beta cells to produce more endogenous insulin. Individuals with a genetic predisposition for diabetes cannot produce and secrete enough endogenous insulin to maintain euglycemia. TZDs appear to improve IR by directly affecting PPAR- activation in adipose tissue, hepatocytes, and skeletal muscle cells. The metabolic effects of the TZDs are displayed in Table 4-15.
The two currently marketed TZDs (pioglitazone and rosiglitazone) are equipotent in reducing A1C levels, typically in the same range as metformin and sulfonylureas. These agents are approved as monotherapy and in combination with other agents, including metformin, sulfonylureas, and insulin. Side effects include weight gain (range, 0.9 2.6 kg) and edema. The weight gain tends to occur early and is not associated with a prolonged upward trend. TZDs should not be used in patients with advanced heart-failure symptoms (New York Heart Association class III or IV).160
No comparative head-to-head trials show that one TZD is superior to the other. Because of the unique features of the TZDs, patients must be assessed individually to determine which agent might be most appropriate.161 Subtle differences between the two drugs are apparent. For example, pioglitazone is associated with the most weight gain, whereas rosiglitazone causes a more significant increase in LDL-C and triglyceride levels.
Patients with diabetes are twice as likely to have hypertension as are those individuals with normoglycemia.162 The UKPDS blood pressure substudy revealed a significant reduction in microvascular and macrovascular complications when blood pressure is controlled in patients with diabetes.163 Rosiglitazone decreases systolic and diastolic blood pressure by 5 to 6 mm Hg in patients with T2DM,164 which may provide another mechanism by which long-term diabetes-related complication rates may be reduced. Pioglitazone appears to have a similar effect on both systolic and diastolic blood pressure reduction in patients with T2DM.165
A direct correlation exists between IR, T2DM, and increased levels of plasminogen activator inhibitor type-1 (PAI-1). Elevation of PAI-1 inhibits fibrinolysis, thereby increasing one's risk of arterial thrombosis. Higher A1C levels correlate with higher PAI-1 levels.166 Patients with suboptimal diabetes control therefore are at higher risk of vascular thrombosis. Whereas sulfonylureas increase PAI-1 levels, TZDs in combination with sulfonylureas appear to decrease PAI-1 activity by more than 33%.167 TZDs may play a critical role in reducing endothelial damage by improving fibrinolytic activity, leading to lowered cardiovascular risk in patients with T2DM.
CRP is an independent marker of vascular inflammation. Elevated CRP levels are associated with an increased cardiovascular risk as well as IR.
P.166
P.167
TZDs reduce CRP levels by 30% and improve endothelial cell function.168,169 Table 4-15 summarizes the effects of TZDs on cardiovascular risk factors.
TABLE 4-15 Summary of Effects of Thiazolidinediones on Cardiovascular Risk Factors | |||||||||||||||||||||
|---|---|---|---|---|---|---|---|---|---|---|---|---|---|---|---|---|---|---|---|---|---|
| |||||||||||||||||||||
The current available clinical data show that no hepatotoxicity occurs with the two marketed TZDs. However, patients using TZDs should have liver function tests performed on initiation of the drug. TZDs should not be started if a patient has evidence of active liver disease or if the ALT levels are greater than 2.5 times the upper limits of normal. Patients with normal liver function tests should have an ALT performed every 2 months for the first year, followed by periodic testing. If at any time during treatment with a TZD, the ALT levels exceed 3 times the upper limits of normal, complete liver function testing should be repeated immediately. If on repeated testing, the ALT remains 3 or more times the upper limits of normal, the drug should be discontinued. Liver enzymes should also be checked if a patient experiences symptoms suggesting hepatic dysfunction while taking the TZDs.170
Use of TZDs should begin early in the course of diabetes treatment and, in most patients, be considered cornerstone therapy. TZDs improve insulin sensitivity, hyperglycemia, and pancreatic beta-cell function. Lipid profiles, vascular dynamics, inflammatory markers, fibrinolysis, blood pressure, and endothelial cell function are all positively affected with TZD therapy. TZDs have also been useful in delaying the onset of diabetes in high-risk patients (TRIPOD Study)16 while improving the likelihood of ovulation in patients with PCOS.
The A Diabetes Outcome Progression Trial (ADOPT) evaluated the efficacy of a thiazolidinedione (rosiglitazone), metformin, and glyburide as initial treatments for patients newly diagnosed with T2DM.170a The 4,360 patients treated in this randomized placebo controlled trial were treated for a median period of 4 years. The primary outcome was the time to monotherapy failure (defined as a confirmed FPG >180 mg/dL). Secondary outcomes included levels of FPG and A1C, insulin sensitivity, and beta-cell function. Patients randomized to the rosiglitazone arm demonstrated a 32% risk of treatment failure compared with metformin and a 63% reduction in risk of failure compared with glyburide over 4 years. Rosiglitazone was associated with weight gain. On average, patients gained 6.9 kg compared with metformin and 2.5 kg compared with glyburide. Cardiovascular events were similar in the rosiglitazone and metformin arms but lower in the glyburide arm. Rosiglitazone was most effective, probably because of its effects on insulin sensitivity and beta-cell function. The use of rosiglitazone early in diabetes is preferable to glyburide because rosiglitazone was substantially more effective.
Despite the positive effects of rosiglitazone on modest improvements in long-term glycemia, one must also weigh the drug's long-term adverse effects, such as weight gain, fluid retention, and even a higher incidence of extremity fractures. Even with the data supporting long-term efficacy with rosiglitazone, metformin still remains the logical choice as initial therapy for T2DM.170b
The pharmacologic actions of all oral hypoglycemic agents are compared in Tables 4-16 and 4-17. Issues related to possible cardiovascular risk that may be associated with the use of oral hypoglycemic agents are addressed in Table 4-14.
P.168
P.169
TABLE 4-16 Oral Pharmacologic Agents Used to Treat Type 2 Diabetes | ||||||||||||||||||||||||||||||||||||||||||||||||||||||||||||||||||||||||||||||||||||||||||||||||||||||||||||||||||||||||||||||||||||||||||||||||||||||
|---|---|---|---|---|---|---|---|---|---|---|---|---|---|---|---|---|---|---|---|---|---|---|---|---|---|---|---|---|---|---|---|---|---|---|---|---|---|---|---|---|---|---|---|---|---|---|---|---|---|---|---|---|---|---|---|---|---|---|---|---|---|---|---|---|---|---|---|---|---|---|---|---|---|---|---|---|---|---|---|---|---|---|---|---|---|---|---|---|---|---|---|---|---|---|---|---|---|---|---|---|---|---|---|---|---|---|---|---|---|---|---|---|---|---|---|---|---|---|---|---|---|---|---|---|---|---|---|---|---|---|---|---|---|---|---|---|---|---|---|---|---|---|---|---|---|---|---|---|---|---|
| ||||||||||||||||||||||||||||||||||||||||||||||||||||||||||||||||||||||||||||||||||||||||||||||||||||||||||||||||||||||||||||||||||||||||||||||||||||||
Combination Therapies
Although monotherapy may be effective initially in the treatment of T2DM, a more intensified management strategy is often needed to maintain optimal glycemic control within 5 years of drug initiation.55 Data from the UKPDS demonstrated a relation between the progressive decline in beta-cell function and the inability of oral hypoglycemic agents to maintain a therapeutic A1C
P.170
P.171
P.172
P.173
level. Of the patients in the UKPDS, 50% were adequately controlled on monotherapy 3 years after diagnosis; by 9 years, this figure had declined to 25%.46 Combination therapy involving agents with complementary mechanisms of action is not only logical, but also is frequently necessary to achieve the targeted A1C level of 7% or less.171,172
TABLE 4-17 Pharmacologic Comparisons between Oral Hypoglycemic Drug Classes | ||||||||||||||||||||||||||||||||
|---|---|---|---|---|---|---|---|---|---|---|---|---|---|---|---|---|---|---|---|---|---|---|---|---|---|---|---|---|---|---|---|---|
| ||||||||||||||||||||||||||||||||
When combination therapy is initiated, always consider using drugs with different mechanisms of action. Side effects of combination drug therapy may become problematic. For example, weight gain can be significant when insulin is combined with a TZD or a secretagogue.
Several single-dose combination drugs are also available for use in patients with T2DM (sulfonylurea plus metformin, sulfonylurea plus a TZD, and metformin with a TZD) (Table 4-16). Combination drugs do have some advantages over the necessity to use two different existing drugs. Most combination agents cost the same as or less than the retail value of their individual drug components, and in some cases, combination drugs are considerably less expensive than the sum of the individual components.173 For example, the use of the combination drug Metaglip costs $50 less per month in California than if a patient were to fill two individual prescriptions for metformin and glyburide. The same is true when one compares the cost of Avandamet with the cost of rosiglitazone plus metformin. Patient adherence to diabetes-treatment regimens may improve when a single drug is used for glycemic control, rather than two.
Combining agents from different therapeutic classes appears to have additive benefits on glucose control. Typically, the A1C reduction resembles the effect of the added individual agent when used as monotherapy. These drugs do not appear to work in a synergistic manner, and their ability to affect different metabolic parameters remains a great area of interest.
Most important, the use of a combination drug shortly after one is diagnosed as having diabetes may increase the clinical inertia toward diabetes therapy intensification.
Parenteral Agents
In 2005, two novel therapeutic agents were introduced that offer a means of providing safe and effective physiologic diabetes management to patients (see Chapter 12). Clinicians can now simulate human GLP-1 action by using a synthetic GLP-1 incretin mimetic hormone (exenatide). GLP-1 is secreted from enteroendocrine cells located in the ileum and colon in response to a meal. The incretin effect, which is GLP-1 dependent, refers to the difference in insulin secretion from the beta cells when glucose is administered orally versus intravenously. Intravenous glucose produces a much smaller endogenous insulin response than does an identical oral glucose challenge. Patients with IGT and T2DM are GLP-1 deficient. When administered before a meal in patients with type 2 diabetes, exenatide restores first-phase insulin response, reduces postprandial glucagon levels, increases insulin release from the beta cells, improves gastric
P.174
emptying, reduces satiety, and appears to reduce beta-cell death (apoptosis).174 Exenatide functions in a glucose-dependent fashion, meaning that the effects of the drug are prominent only in the presence of hyperglycemia.
Amylin is a peptide hormone that is secreted with insulin from the pancreatic beta cells and is deficient in patients with diabetes. Amylin inhibits glucagon secretion, delays gastric emptying, and decreases appetite. Pramlintide, a synthetic version of amylin, possesses pharmacokinetic and pharmacodynamic properties similar to those of native amylin in patients with both T1DM and T2DM. Both drugs improve A1C levels and favor weight loss rather than weight gain.175
Because diabetes is a progressive disease, over time most patients will need to be transitioned to exogenous insulin therapy. Many simple protocols allow patients to achieve an A1C of 7% or lower by using basal insulin as monotherapy176 or in a combination of oral agents.177 Single or multiple daily doses of mixed insulin analogues can also be used as monotherapy or in combination with oral agents.178,179 Preprandial inhaled insulin may be used with oral hypoglycemic agents or in conjunction with a basal insulin. Patients who are still unable to achieve successfully and safely the targeted A1C, or those experiencing significant glycemic variability, may require intensification of their regimen by using either multiple daily injections of insulin or insulin pump therapy, possibly combined with either pramlintide or exenatide.
Dipeptidyl Peptidase IV Inhibitors
Although native incretin hormones have a powerful effect on glucose regulation, their release in response to an oral glucose stimulus is tempered by rapid degradation from DPP-IV. Thus, as soon as GLP-1 is released from the intestinal L cells, one's own endogenous enzyme systems will act to neutralize the hormone's glycemic effects. Deficiencies in GLP-1 secretion can be treated with exogenous GLP-1 formulations (such as exenatide), which mimic the human characteristics of GLP-1 yet are immune to rapid DPP-IV degradation. One could also use medications that directly inhibit the actions of DPP-IV, thereby allowing endogenous GLP-1 to have a more profound glucodynamic effect after meals are consumed.
DPP-IV inhibitors are orally administered drugs that improve glycemic control by preventing the rapid degradation of incretin hormones, thereby resulting in postprandial increases in levels of biologically active intact GLP-1.
Sitagliptin (Januvia) was approved for the treatment of type 2 diabetes in the United States on October 17, 2006. Sitagliptin was approved for use either as monotherapy or as combination therapy when added to either metformin or a thiazolidinedione. The usual dose is 100 mg daily; however, patients with renal impairment may require a reduction in dose to either 50 mg or 25 mg.
In a 24-week randomized, placebo-controlled trial, sitagliptin 100 mg lowered A1C 0.8%, reduced fasting plasma glucose levels 21 mg/dL, and decreased 2-hour postprandial glucose level 54 mg/dL when compared with
P.175
placebo. Weight reduction was not observed, yet pancreatic beta-cell function did improve in patients using sitagliptin.180
An open-label trial in poorly controlled patients (mean baseline A1C = 8.8%) demonstrated a significant mean placebo-subtracted reduction in A1C of 2.1% with sitagliptin (100 mg per day) plus metformin (2 g per day) as initial therapy. Also, in the primary analysis of the study, sitagliptin plus metformin provided substantial mean placebo-subtracted reductions of PPG (mean reduction of 117 mg/dL) and FPG levels (mean reduction of 70 mg/dL). Initial co-administration of sitagliptin plus metformin led to 66% of patients achieving the ADA-recommended A1C goal level of less than 7% compared with 38.4% of patients on metformin alone. Modest weight loss was observed in the groups receiving sitagliptin plus metformin or metformin alone (-20.6 to -21.3 kg from baseline). All doses of sitagliptin plus metformin were generally well tolerated.181
Vildagliptin (Galvus) should be approved by the FDA in 2007 for use in T2DM. However, the specific indications for using vildagliptin remain uncertain. When added to metformin, vildagliptin appears to improve beta-cell secretion of insulin. The main effect was observed already within the initial 12-week treatment and was sustained throughout the 52-week study period.182
Although the DPP-IV drugs offer clinicians yet another treatment option for managing patients with T2DM, several questions should be addressed prior to initiating therapy with these agents:
Will the patient be able to achieve the A1C target of 7% when these drugs are used alone or in combination with other agents?
When using DPP-IV drugs in combination with a TZD, the cost of daily therapy could be prohibitive for many patients. Could one achieve the same benefits at a lower cost using time-proven drug therapies such as metformin plus a sulfonylurea?
Would a patient be better starting basal insulin therapy and continuing with oral agents rather than starting therapy with a DPP-IV inhibitor?
Considering that few individuals actually lose weight on the DPP-IV drugs, would a patient be better off injecting incretin mimetic (such as exenatide), which should result in a similar A1C reduction (1.1%) yet significantly more weight reduction?
Perhaps the best candidates for a DPP-IV would be individuals with newly diagnosed T2DM who have A1C levels lower than 8% and who are not excessively overweight (BMI <30 kg/mL2).
Treatment Recommendations for Patients with Type 2 Diabetes
Striving to normalize glucose levels is reasonable in the majority of our patients with both T1DM and T2DM. The AACE has published a road map suggesting treatment regimens one might consider prescribing for patients based
P.176
on (a) their current A1C, (b) whether the patients are treatment na ve, or (c) a current veteran of diabetes therapy. Some PCPs may consider the AACE road map too intensive for many of their T2DM patients. However, those patients who are unable to reduce their A1C to less than 8.5% after using combination therapy for more than 4 months are unlikely to reach a goal of 7% A1C by adding a third oral agent. These patients will require exogenous insulin therapy, either as monotherapy or in combination with oral hypoglycemic agents. Table 4-18 provides a treatment algorithm integrating lifestyle and pharmacologic interventions for all patients with T2DM.
Specialists and PCPs intensify diabetes management in different ways.183 Although PCPs are not afraid to add a second or third oral agent to a patient's treatment regimen, diabetes specialists are aggressive with insulin management. Patients with an A1C greater than 8.5% are 5 times more likely to be placed on insulin by a specialist than by a PCP. Patients who consult specialists for poorly controlled diabetes are more likely to be successfully managed to a targeted A1C by the specialist than by the primary care provider.180 However, fewer than 50% of patients with poor glycemic control receive intensification of their glucose-lowering regimen by either specialists or a PCP. By familiarizing themselves with the ADA and AACE clinical practice guidelines, PCPs may also become more successful in treating patients to target, rather than having them struggle through long periods of failure.
P.177
P.178
P.179
P.180
P.181
P.182
Case 4
Patrick is a 49-year-old man initially seen by a family physician for a complete physical. His doctor noted that he had a fasting blood glucose of 133 mg per dL. He was placed on glyburide, 5 mg at bedtime, when his A1C increased to 7%. However, when first evaluated at the diabetes center, he had not taken any medication for 4 months and was asymptomatic. His family history is significant because his younger brother has type 1 diabetes. Over the past 5 years, he was taking lisinopril, 10 mg daily, for hypertension. When first evaluated, the patient admitted to doing no exercise. He did not smoke or drink.
Examination results were as follows:
Physical exam:
Weight, 96 kg
BMI, 29 kg per m2
Blood pressure, 122/94 mm Hg
Waist circumference, 38 inches
Pertinent physical findings: no evidence of peripheral sensory neuropathy or cardiac disease.
Exercise stress test, normal
TABLE 4-18 Treatment Algorithm for Management of Type 2 Diabetes
Patient A1C Level Author Suggestions AACE Guidelines for Treatment-naive Patients AACE Guidelines for Currently Treated Patients 6% 7% Lifestyle intervention
Wt. reduction
Exercise 30 min 5 d/wk
Achieve FPG <110 mg/dL
Achieve 2-h PPG <140 mg/dL
Monitor BG levels fasting and bedtime 1st 7 days monthly
Begin metformin 500 mg BID if FPG levels begin to exceed 110 mg/dL or 2 h postprandial glucose levels exceed 140 mg/dL
Target A1C 7%
Monitor other metabolic parameters (lipids, blood pressure, renal function) and treat them to target6% 7% A1C
Monotherapy or combination therapy with preferred drugs: metformin, TZD, AGI
Goals: FPG <110 mg/dL, 2-h PPG <140 mg/dL, A1C 6.5%6% 6.5%
Adjust therapy as needed to meet AACE FPG and PPG targets using monotherapy or combination therapy
Keep A1C <6.5%7% 8% Begin combination therapy with one component being metformin. A DPP-IV inhibitor may also be considered as monotherapy.
Titrate doses of oral agents
Consider exenatide or Exubera
Consider basal insulin analogue + oral agent
Monitor blood glucose fasting and at bedtime >3 days weekly
Recheck A1C in 4 mo
Monitor metabolic parameters
Continue exercise programAdd to monotherapy: meglitinides, AGI, metformin, TZd, SUs
Consider premixed insulin analogues or rapidacting insulin analogues for postprandial hyperglycemia6.5 8.5%
Maximize combination therapy
Maximize insulin therapy:- if FPG elevated add basal insulin
- if PPG elevated add bolus insulin
- if elevated FPG + PPG add basalbolus or premixed insulin therapy
8% 9% Basal insulin analogue + oral agents
Exenatide + orals
Mixed analogues
Basal insulin analogue + Exubera
Basal insulin titrated to fasting glucose target <100 mg/dL
Basal insulin titrated to treat fasting glucose target + add prandial insulin targeting largest meal of the day (usually supper)Combine therapies to address FPG and PPG:
Metformin
TZD
SU
Glargine
Rapid-acting analogue
Premixed analogues
NPH insulin
Other approved combinations>8.5
Basal-bolus insulin
Premixed insulin analogues9% 10% Start insulin. Target FPG at first. When A1C <8.5% begin adjusting insulin doses to target PPG levels
Use basal-bolus insulin or mixed-dose analoguesCombine therapies to address FPG and PPG:
Metformin
TZD
SU
Glargine
Rapid-acting analogue
Premixed analogues
NPH insulin
Other approved combinations>10% General measures should include the following: - Reduce carbohydrate intake
- Inject analogue insulin 15 30 min prior to meals
- Strongly consider using pramlintide, which should also be injected 15 min prior to meals
- Consider using continuous glucose sensor or an insulin pump with augmented sensor to help reduce glycemic variability
Insulin pump therapy pramlintide exenatide
Blood glucose monitoring fasting, postprandial, and at bedtime
Consider specialty referral if no response to treatmentBasal-bolus insulin (rapidacting insulin analogue + glargine or detemir Premixed insulin analogues AACE, American Association of Clinical Endocrinologists; AGI, -glucosidase inhibitor; BG, blood glucose; FPG, fasting plasma glucose; PPG, postprandial glucose; SU, sulfonylurea;. TZD, thiazolidinedione; Wt., weight.
Adapted from American College of Endocrinology. ACE road map to achieve glycemic goals: treated patients (type 2). Available at: http://www.aace.com/meetings/consensus/odimplementation/roadmap.pdf
Accessed May 19, 2006.
Laboratory studies:
A1C, 6.9%
Total cholesterol (TC), 205 mg per dL
HDL-C, 30 mg per dL
LDL-C, 113 mg per dL
Triglycerides, 310 mg per dL
Urinalysis: showed 2+ glucose, -2 protein.
Thyroid, liver, and blood chemistry tests were all normal.
Patrick was advised to begin home blood glucose monitoring, fasting and at bedtime, on Monday, Wednesday, and Sunday for 2 weeks. He was also encouraged to begin an exercise program by walking 30 minutes daily, 5 days per week. Low-dose aspirin, 81 mg, at bedtime was prescribed, and the antihypertensive medication was continued. He attended the group's monthly diabetes group education programs.
On his return 2 months later, Patrick's home blood glucose meter was downloaded. His average fasting glucose (28 readings) was 136 mg per dL, and his bedtime readings (30 readings) averaged 178 mg per dL. He had no readings greater than 200 mg per dL and was diagnosed as having IGT. Lifestyle intervention was stressed once again. Six months after his diagnosis of IGT, he returned for follow-up, having lost 8.5 kg. His physical and laboratory findings were as follows:
Weight, 91.3 kg
BMI, 27 kg per m2
Blood pressure, 142/88
A1C, 5.9%
TC, 195 mg per dL
HDL-C, 34 mg per dL
LDL-C, 108 mg per dL
Triglycerides, 255 mg per dL
24-hour urine for albumin, 108 mg per 24 hours (normal, 30 mg per 24 h)
Because of the reduced A1C, the patient was advised to continue home blood glucose monitoring, fasting and at bedtime, during the first 7 days of each month. He was started on Niaspan +1 g at dinner to be taken with the low-dose aspirin in an attempt to improve his atherogenic dyslipidemia (low HDL-C and elevated triglycerides). A statin was also prescribed because he was a high-risk cardiovascular disease patient older than 40 years with an LDL-C greater than 100 mg per dL. After his lisinopril dose was increased to 40 mg daily, a dry, hacking cough developed. The ACE inhibitor was discontinued, and he was started on valsartan, 160 mg daily (an ARB), for the hypertension and proteinuria.
At his next visit, 6 months later, Patrick admitted to feeling a bit more fatigued than usual, especially after eating large meals. He continued his exercise program and was following a modified Atkins Diet. Although his weight had not increased since the last visit, his point-of-service A1C test had risen from 5.9% to 6.8%. His home blood glucose monitoring downloads showed an average fasting glucose of 156 mg per dL, whereas the 2-hour postdinner readings were averaging 187 mg per dL. However, this time, 30% of his postprandial glucose readings were between 200 and 260 mg per dL. Patrick was started on a twice-daily metformin plus rosiglitazone combination drug (Avandamet).
Three months later, Patrick's A1C increased to 7.7%. His blood glucose meter downloads revealed that although his fasting glucose levels were fairly well controlled (10% of fasting glucoses were more than 110 mg per dL), his postprandial glucose levels remained elevated. Repaglinide, 4 mg taken 30 minutes before each meal, was prescribed. Fortunately his lipid profile had stabilized on the niacin and statin combination:
TC, 194 mg per dL
HDL-C, 45 mg per dL
LDL-C, 74 mg per dL
Triglycerides, 132 mg per dL
At his follow-up appointment 4 months later, Patrick's A1C decreased to 7.2%. Despite his increasingly rigorous training program and dietary modifications, his weight returned to baseline of 96 kg. Thinking that the TZD component of his therapy in addition to the secretagogue might be responsible for his weight gain, Patrick asked to discontinue the TZD. His physician advised Patrick of the nonglycemic benefits associated with TZDs and encouraged continuation of the drug. Feeling a bit uncomfortable with his weight, Patrick opted to stop the TZD. He was continued on metformin, 500 mg BID, and repaglinide, 4 mg TID, Niaspan, 1 g plus the statin at bedtime with low dose-aspirin, and valsartan, 160 mg daily.
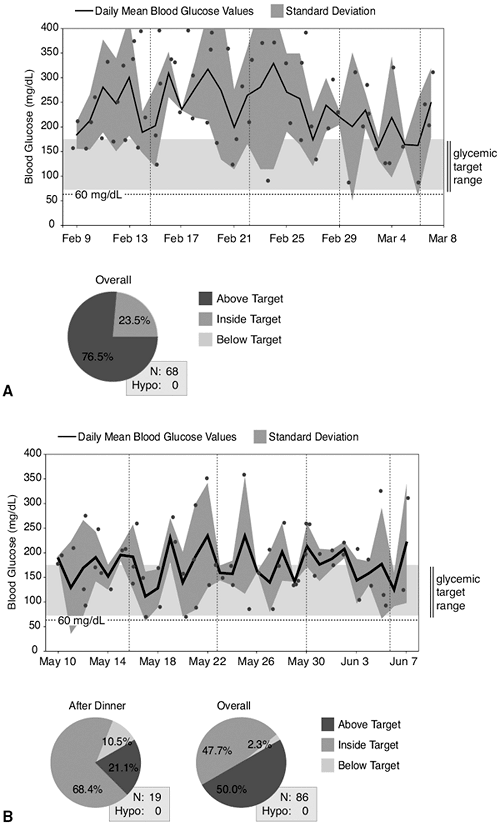 |
Figure 4-13 A: Patrick's home blood glucose meter download demonstrating that only 23.5% of his blood glucose readings recorded over a 30-day period are within the target range of 70 to 170 mg per dL while taking metformin, 500 mg BID, and repaglinide, 4 mg TID. His point-of-service A1C was 8%, and he was becoming increasingly symptomatic. B: Three months after being placed on a combination of metformin > a basal insulin and using a treat-to-target protocol, the patient's A1C decreased to 6.8%. This was accompanied by a 2-kg weight reduction and resolution of his hyperglycemic symptoms. |
Eighteen months after his initial diagnosis of IGT, Patrick's A1C increased again to 8.0%. His average blood glucose level was 223 mg per dL. His lipid profile and blood pressure remained at target. Since stopping the TZD 5 months earlier, his weight had decreased 1.8 kg. Because the last two A1C levels were above the ADA-recommended target, intensification of the diabetes regimen was discussed.
Patrick opted to begin treatment with bedtime basal insulin while continuing his twice-daily dose of metformin, 500 mg. The basal insulin dose was initiated at 10 U and adjusted weekly by the patient using a fixed dose-adjustment chart provided by his physician, targeting fasting blood glucose levels less than 100 mg per dL. Three months after starting his new diabetes regimen, Patrick had been successfully titrated to a basal insulin dose of 22 units at bedtime while on metformin BID. Although he recorded two blood glucose levels of 58 and 61 mg per dL before eating dinner 1 week that he had the flu, he had no documented episodes of nocturnal hypoglycemia. His point-of-service A1C was 6.7%, and he had lost 2 kg since starting his insulin regimen. Patrick understands that further intensification of his diabetes regimen may be necessary in the future. Patrick's home blood glucose meter downloads are presented in Figure 4-13.
Summary
Type 2 diabetes is a progressive disease, the pathophysiology of which is dependent on the ability of the pancreatic beta cells to produce enough insulin to maintain normoglycemia. Impaired insulin action at sites that include the liver, adipose tissue, and skeletal muscle limit the ability of insulin to bind with receptors, so that intracellular glucose transport is reduced. Postreceptor signaling defects further limit intracellular glucose transport and secretion of insulin from the pancreatic beta cells. The resultant glucose toxicity is cytotoxic to beta cells and minimizes the storage of FFAs within the adipose tissue. FFAs are beta-cell toxins and also worsen IR.
Management of patients with T2DM should combine lifestyle intervention with pharmacotherapy. Intervention should be aggressive to minimize beta-cell apoptosis in the short term and reduce the long-term risk of diabetes-related complications. As most patients with T2DM will eventually require insulin therapy, physicians should not hesitate to discuss this possibility during the early stages of the disease. Doing so will likely make the transition from oral agents to injectable therapy more acceptable to the patient.
References
1. Unwin N, Shaw J, Zimmet P, Alberti KG. Impaired glucose tolerance and impaired fasting glycaemia: the current status on definition and intervention. Diabetes Med. 2002;19:708 723.
2. Laws A, Reaven GM. Evidence for an independent relationship between insulin resistance and fasting plasma HDL-cholesterol, triglyceride and insulin concentrations. J Intern Med. 1992;231:25 30.
P.183
3. Ridker PM, Rifai N. Rose L, Buring JE, Cook NR. Comparison of C-reactive protein and low-density lipoprotein cholesterol levels in the prediction of first cardiovascular events. N Engl J Med. 2002;347:1557 1565.
4. American Diabetes Association Web Site: http://www.diabetes.org/diabetes-statistics/national-diabetes-fact-sheet.jsp. Accessed 8/8/05.
5. Unger J. Intensive management of type 2 diabetes. Emerg Med. 2001;33:28 43.
6. American Diabetes Association. Clinical practice recommendations 2005. Diabetes Care. 2005;suppl 1:S5-S7.
7. Unger J. Screening for type 2 diabetes in primary care. The Female Patient. 2004;29:27 29.
8. Hu FB, Manson JE, Stampfer MJ. Diet, lifestyle, and the risk of type 2 diabetes in women. N Engl J Med. 2001;345:790 797.
9. Hedley AA, Ogden CI, Johnson CL. Prevalence of overweight and obesity among US children, adolescents, and adults, 1999 2002. JAMA. 2004;291:2847 2850.
10. Tuomilehto J, Linstrom J, Eriksson JG. Prevention of type 2 diabetes mellitus by changes in lifestyle among subjects with impaired glucose tolerance. N Engl J Med. 2001;344:1343 1350.
11. Pan XR, Li GW, Hu YH. Effects of diet and exercise in preventing NIDDM in people with impaired glucose tolerance: the Da Qing IGT and Diabetes Study. Diabetes Care. 1997;20:537 544.
12. Knowler WC, Barrett-Connor E, Fowler SE, et al, and the Diabetes Prevention Program Research Group. Reduction in the incidence of type 2 diabetes with lifestyle intervention or metformin. N Engl J Med. 2002;346:393 403.
13. Ivy JL, Zderic TW, Fogt DL. Prevention and treatment of non-insulin dependent diabetes mellitus. Exerc Sport Sci Rev. 1999;27:1 35.
14. Kriska AM, Saremi A, Hanson RL. Physical activity, obesity, and the incidence of type 2 diabetes in a high risk population. Am J Epidemiol. 2003;158:669 675.
15. Freemark M. Pharmacologic approaches to the prevention of type 2 diabetes in high risk pediatric patients. J Clin Endocrinol Metab. 2003;88:3 13.
16. Buchanan TA, Xiang AH, Peters RK. Preservation of pancreatic beta-cell function and prevention of type 2 diabetes by pharmacological treatment of insulin resistance in high-risk Hispanic women. Diabetes. 2002;46:701 710.
17. The Diabetes Prevention Program Research Group. Prevention of type 2 diabetes with troglitazone in the diabetes prevention program [abstract]. Diabetes. 2003;52(suppl 1):A58-A59.
18. Chiasson JL, Josse RG, Leiter LA. The effect of acarbose on insulin sensitivity in subjects with impaired glucose tolerance. Diabetes Care. 1996;19:1191 1194.
19. Heymsfield SB, Segal KR, Hauptman J, et al. Effects of weight loss with orlistat on glucose tolerance and progression to type 2 diabetes in obese adults. Arch Intern Med. 2000;160:1321 1326.
20. Gress TW, Nieto FJ, Shahar E, et al. Hypertension and antihypertensive therapy as risk factors for type 2 diabetes mellitus: Atherosclerosis Risk in Communities Study. N Engl J Med. 2000;342:905 912.
21. Yusef DP, Gerstein H, Hoogwerf B, et al, for the HOPE Study Investigators. Ramipril and the development of diabetes. JAMA. 2001;286:1882 1885.
22. Hansson L, Lindholm LH, Niskanen L, et al. Effect of angiotensin-converting-enzyme inhibition compared with conventional therapy on cardiovascular morbidity and mortality in hypertension: the Captopril Prevention Project: (CAPPP) randomised trial. Lancet. 1999;353:611 616.
23. Brown MJ, Palmer CR, Castaigne A, et al. Morbidity and mortality in patients randomised to double-blind treatment with a long-acting calcium-channel blocker or diuretic in the International Mifedipine GITS study: intervention as a goal in hypertension treatment (INSIGHT). Lancet. 2000;356:366 372.
24. ALLHAT Officers and Corordinators for the ALLHAT Collaborative Research Group. Major outcomes in high-risk hypertensive patients randomized to angiotensin-converting enzyme inhibitor or calcium channel blocker vs. diuretic: the Antihypertensive and Lipid-Lowering Treatment to Prevent Heart Attack Trial (ALLHAT). JAMA. 2002;288:2981 2997.
P.184
25. Devereux RB, Dahlof B, Kjedlsen SE, et al, for the LIFE Study. Effects of losartan or atenolol in hypertensive patients without clinically evident vascular disease: a substudy of the LIFE randomized trial. Ann Intern Med. 139:169 177.
26. Hansson L, Lindholm LH, Ekbom T, et al. Randomised trial of old and new antihypertensive drugs in elderly patients: cardiovascular mortality and morbidity the Swedish Trial in Old Patients with Hypertension-2 study. Lancet. 1999;354:1751 1756.
26a. Bosch J, Yusuf S, Gerstein HC, et al. Results of the DREAM trial (Diabetes Reduction Assessment with Ramipril and Rosiglitazone Medication). Presented at the European Association for the Study of Diabetes 42nd Annual Meeting. Copenhagen, Denmark, September 14 17, 2006.
26b. Effect of ramipril on the incidence of diabetes. DREAM Trial Investigators. N Engl J Med. 2006;355:1608 1610.
27. Freeman DJ, Norrie J, Sattar N, et al. Pravastatin and the development of diabetes mellitus: evidence for a protective treatment effect in the West of Scotland Coronary Prevention Study. Circulation. 2001;103:357 362.
28. Colins R, Armitage J, Parish S, et al, for the Heart Protection Study Collaborative Group. MRC/BHF Heart Protection Study of cholesterol-lowering with simvastatin in 5963 people with diabetes; a randomized placebo-controlled trial. Lancet. 2003;361:2005 2016.
29. Kanaya AM, Herrington D, Vittinghoff E, et al. Glycemic effects of postmenopausal hormone therapy: the Heart and Estrogen/Progestin Replacement Study: a randomised, double-blind, placebo-controlled trial. Ann Intern Med. 2003;138:1 9.
30. Nateglinide and Valsartan in Impaired Glucose Tolerance Outcomes Research. Rationale and design of the NAVIGATOR trial [abstract]. Diabetes. 2002;51(suppl 2):A116.
31. Rubino F, Gagner M. Potential of surgery for curing type 2 diabetes. Ann Surg. 2002;236:554 559.
32. Arner P. Not all fat is alike. Lancet. 1998;351:1301 1302.
33. Greenway SE, Greenway FL, Klein S. Effects of obesity surgery on non-insulin-dependent diabetes mellitus. Arch Surg. 137:2002;1108 1117.
34. Long SD, O'Brien K, MacDonald KG Jr, et al. Weight loss in severely obese subjects prevents the progression of impaired glucose tolerance to type to type II diabetes: a longitudinal interventional study. Diabetes Care. 1994;17:372 375.
35. Barzilai N, She L, Liu BQ, et al. Surgical removal of visceral fat reverses hepatic insulin resistance. Diabetes. 1999;48:94 98.
36. Hickey MS, Pories WJ, MacDonald KG Jr, et al. A new paradigm for type 2 diabetes mellitus: could it be a disease in the foregut? Ann Surg. 1998;227:637 644.
37. Pories WJ, MacDonald KG Jr, Flickinger EG, et al. Is type II diabetes mellitus (NIDDM) a surgical disease? Ann Surg. 1992;215:633 643.
38. Drucker DJ. Glucagon-like peptide 2. J Clin Endocrinol Metab. 2001;86:1759 1764.
39. Naslund E, Backman L, Holst JJ, Theodorsson E, Hellstrom PM. Importance of small bowel peptides for the improved glucose metabolism 20 years after jejunoileal bypass for obesity. Obes Surg. 1998;8:253 260.
40. Mun EC, Blackburn GL, Matthews JB. Current status of medical and surgical therapy for obesity. Gastroenterology. 2001;120:669 681.
41. Schauer P, Ikramuddin S, Hamad G, Gourash W. The learning curve for laparoscopic Roux-en-Y gastric bypass is 100 cases. Surg Endosc. 2003;17:212 215.
42. Pories WJ, Swanson MS, MacDonald KG, et al. Who would have thought it? An operation proves to be the most effective therapy for adult-onset diabetes mellitus. Ann Surg. 1995; 222:339 350.
43. Papasavas PK, Hayetian FD, Caushaj PF, et al. Outcome analysis of laparoscopic Roux-en-Y gastric bypass for morbid obesity: the first 116 cases. Surg Endosc. 2002;16:1653 1657.
44. Whitaker RC, Wright JA, Pepe MS, Seidel KD, Dietz WH. Predicting obesity in young adulthood from childhood and parental obesity. N Engl J Med. 1997;337:869 873.
45. Epstein LH, Valoski A, Wing RR, McCurley J. Ten-year follow-up of behavioral, family-based treatment for obese children. JAMA. 1990;264:2519 2523.
P.185
46. UK Prospective Diabetes Study (UKPDS) Group. Intensive blood-glucose control with sulphonylureas or insulin compared with conventional treatment and risk of complications in patients with type 2 diabetes (UKPDS 33). Lancet. 1998;352:837 853. Erratum in: Lancet 1999;14;354:602.
47. Davis DN, Granner DK. Insulin, oral hypoglycemic agents, and the pharmacology of the endocrine pancreas. In: Hardman JG, Limbird LE, eds. Goodman and Gilman's the Pharmacological Basis of Therapeutics, 10th ed. New York: McGraw-Hill;2001.
48. Lee Y, Hirosel T, Ohneda M, et al. Beta cell lipotoxicity of non-insulin dependent diabetes mellitus of obese rats: impairment in adipocyte-beta cell relationships. Proc Natl Acad Sci U S A. 1994;91:10878 10882.
49. Shimabukuro M, Ohneda M, Lee Y, Unger RH. Role of nitric oxide in obesity-induced beta cell disease. J Clin Invest. 1991;100:290 295.
50. Gremlich S, Bonny C, Waeber G, Thorens B. Fatty acids decrease IDX-1 expression in rat pancreatic islets and reduce GLUT2, glucokinase insulin and somatostatin levels. J Biol Chem. 1997;272:30261 30269.
51. Harrison On Line. Chapter 323. http://www.accessmedicine.com/content.aspx?aID=99097. Accessed 8/23/05.
52. Barroso I, Gurnell M, Crowley VE, et al. Dominant negative mutations in human PPAR associated with severe insulin resistance, diabetes mellitus and hypertension. Nature. 1999; 402:880 883.
53. Wannamethee SG, Shaper AG. Weight change and duration of overweight and obesity in the incidence of type 2 diabetes. Diabetes Care. 1999;22:1266 1272.
54. DeFronzo RA, Bonadonna RC, Ferrannini E: Pathogenesis of NIDDM: a balanced overview. Diabetes Care. 1992;15:318 368.
55. Ader M, Bergman R. Peripheral effects of insulin dominate suppression of fasting hepatic glucose production. Am J Physiol. 1990;258:E1020.
57. Caro JF, Sinha MK, Raju SM, et al. IR kinase in human skeletal muscle from obese subjects with and without noninsulin dependent diabetes. J Clin Invest. 1987;79:1330 1337.
58. Paz K, Hemi R, LeRoith D, et al. A molecular basis for insulin resistance: elevated serine/threonine phosphorylation of IRS-1 and IRS-2 inhibits their binding to the juxtamembrane region of the insulin receptor and impairs their ability to undergo insulin-induced tyrosine phosphorylation. J Biol Chem. 1997;272:29911 29918.
59. Auwerx J. PPAR-g, the ultimate thrifty gene. Diabetologia. 1999;42:1033 1049.
60. Kosaka K, Kuzuya T, Hagura R, Yoshinaga H. Insulin response to oral glucose load is consistently decreased in established non-insulin-dependent diabetes mellitus: the usefulness of decreased early insulin response as a predictor of non-insulin-dependent diabetes mellitus. Diabetes Med. 1996;13:S109-S119.
61. Leahy JL, Bonner-Weir S, Weir GC: Beta-cell dysfunction induced by chronic hyperglycemia: current ideas on mechanism of impaired glucose-induced insulin secretion. Diabetes Care. 1992;15:442 455.
62. Del Prato S, Leoanetti F, Simonson DC, et al. Effect of sustained physiologic hyperinsulinaemia and hyperglycaemia on insulin secretion and insulin sensitivity in man. Diabetologia. 1994;37:1025 1035.
63. Arner P: Free fatty acids: do they play a central role in type 2 diabetes? Diabetes Obes Metab. 2001;3(suppl 1):11 19.
64. Kashyap S, Belfort R, Gastaldelli A, et al. A sustained increase in plasma free fatty acids impairs insulin secretion in nondiabetic subjects genetically predisposed to develop type 2 diabetes metabolism. Diabetes. 2003;52:2461 2474. Accessed on line: http://www.findarticles.com/p/articles/mi_m0922/is_10_52/ai_108787539. 8/23/05.
65. Boden G, Chen X, Iqbal N. Acute lowering of plasma fatty acids lowers basal insulin secretion in diabetic and nondiabetic subjects. Diabetes. 1998;47:1609 1612.
66. Kashyap S, Belfort R, Gastaldelli A, et al. A sustained increase in plasma free fatty acids impairs insulin secretion in nondiabetic subjects genetically predisposed to develop type 2 diabetes. Diabetes. 2003;52:2461 2474.
P.186
67. Pimenta W, Korytkowski M, Mitrakou A, et al. Pancreatic beta-cell dysfunction as the primary genetic lesion in NIDDM: evidence from studies in normal glucose-tolerant individuals with a first-degree NIDDM relative. JAMA. 1995;273:1855 1861.
68. Boden G, Chen X. Effects of fat on glucose uptake and utilization in patients with non-insulin dependent diabetes. J Clin Invest. 1995;96:1261 1268.
69. Ferrannini E, Barrett EJ, Bevilacqua S, DeFronzo RA. Effect of fatty acids on glucose production and utilization in man. J Clin Invest. 1983;72:1737 1747.
70. Medina J, Fernandez-Salazar LI, Garcia-Buey L, Moreno-Ortero R. Approach to the pathogenesis and treatment of nonalcoholic steatohepatitis. Diabetes Care. 2004;27:2057 2066.
71. Wanless IR, Lentz J. Fatty liver hepatitis (steatohepatitis) and obesity: an autopsy study with analysis of risk factors. Hepatology. 1990;12:1106 1110.
72. Musso G, Gambino R, Michieli FD, et al. Dietary habits and their relations to insulin resistance and postprandial lipemia in nonalcoholic steatohepatitis. Hepatology. 2003;37:909 916.
73. Day CP. Non-alcoholic steatohepatitis (NASH): where are we now and where are we going? Gut. 2002;50:585 588.
74. Neuschwander-Tetri BA, Brunt E, Wehmeier K, Oliver D, Bacon B. Improved nonalcoholic steatohepatitis after 48 weeks of treatment with the PPAR-gamma ligand rosiglitazone. Hepatology. 2003;38:1008 1017.
75. Promrat K, Lutchman G, Uwaifo G, et al. A pilot study of pioglitazone treatment for nonalcoholic steatohepatitis. Hepatology. 2004;39:188 196.
76. Marchesini G, Brizi M, Bianchi G, et al. Metformin in non-alcoholic steatohepatitis. Lancet. 2001;358:893 894.
77. Henry RR, Schaeffer L, Olefsky JM. Glycemic effects of intensive caloric restriction and isocaloric refeeding in non-insulin-dependent diabetes mellitus. J Clin Endocrinol Metab. 1985;61:917.
78. Hofmann C, Lorenz K, Braithwaite SS, Colca JR. Altered gene expression for tumor necrosis factor-alpha and its receptors during drug and dietary modulation of insulin resistance. Endocrinology. 1994;134:264.
79. Lindsay RS, Funahashi T, Hanson RL, et al. Adiponectin and development of type 2 diabetes in the Pima Indian population. Lancet. 2002;360:57.
80. Steppan CM, Bailey ST, Bhat S, et al. The hormone resistin links obesity to diabetes. Nature. 2001;409:307.
81. Forsen T, Eriksson J, Tuomilehto J, et al. The fetal and childhood growth of persons who develop type 2 diabetes. Ann Intern Med. 2000;133:176.
82. Barnett AH, Eff C, Leslie RD, Pyke DA. Diabetes in identical twins: a study of 200 pairs. Diabetologia. 1981;20:87.
83. Bennett PH. Epidemiology of diabetes mellitus. In: Rifkin H, Porte D Jr, eds. Ellenberg and Rifkin's Diabetes Mellitus. New York: Elsevier;1990:363.
84. Eriksson J, Franssila-Kallunki A, Ekstrand A, et al. Early metabolic defects in persons at increased risk for non-insulin-dependent diabetes mellitus. N Engl J Med. 1989;321:337.
85. Knowles NG, Landchild MA, Fujimoto WY, Kahn SE. Insulin and amylin release are both diminished in first-degree relatives of subjects with type 2 diabetes. Diabetes Care. 2002; 25:292.
86. Turner RC. The U.K. prospective diabetes study: a review. Diabetes Care. 1998;21 (suppl 3):C35-C38.
86a. Nathan DM, Buse JB, Davidson MB, et al. Management of hyperglycemia in type 2 diabetes: a consensus algorithm for the initiation and adjustment of therapy. Diabetes Care. 2006;29:1963 1972.
87. ACE/AACE Diabetes Recommendations Implementations Conference. Road map for the prevention and treatment of type 2 diabetes. ACE/AACE Diabetes Road Map Task Force: Davidson JA, Blonde L, Jellinger PS, et al. Available online: http://www.aace.com/meetings/consensus/odimplementation/roadmap.pdf. Accessed and verified 12/18/06.
P.187
88. ACCORD web site: http://www.accordtrial.org/public/index.cfm#. Assessed 5/23/06.
89. Hellman R, Regan J, Rosen F. Effect of intensive treatment of diabetes on the risk of death or renal failure in NIDDM and IDDM. Diabetes Care. 1997;20:258 264.
90. Unger J, Marcus AO. Glucose control in the hospitalized patient. Emerg Med. 2004;12 18.
91. Wysowski DK, Armstrong G, Governale L. Rapid increase in the use of oral antidiabetic drugs in the United States, 1990 2001. Diabetes Care. 2003;26:1852 1855.
92. Kennedy DL, Piper JM, Baum C. Trends in use of oral hypoglycemic agents 1964 1986. Diabetes Care. 1988;1:558 562.
93. Doar JW, Thompson ME, Wilde CE, Sewell PF. Diet and oral antidiabetic drugs and plasma sugar and insulin levels in patients with maturity-onset diabetes mellitus. Br Med J. 1976;1:498 500.
94. Korytkowski M, Thomas A, Reid L, et al. Glimepiride improves both first and second phases of insulin secretion in type 2 diabetes. Diabetes Care. 2002;25:1607 1611.
95. Holstein A, Plaschke A, Egberts E-H. Lower incidence of severe hypoglycaemia in type 2 diabetic patients treated with glimepiride versus glibenclamide [abstract]. Diabetologia. 2000;43(suppl 1):A40.
96. Bugos C, Austin M, Viereck C, Atherton T. Long-term treatment of type 2 diabetes mellitus with glimepiride is weight neutral: a meta-analysis. Diabetes Res Clin Pract. 2000;50 (suppl 1):29 31.
97. Luis Bautista J, Bugos C, Dirnberger G, Atherton T. Efficacy and safety profile of glimepiride in Mexican American patients with type 2 diabetes mellitus: a randomized, placebo-controlled study. Clin Ther. 2003;25:194 209.
98. Watson RT, Pessin JE. Intracellular organization of insulin signaling and GLUT4 translocation. Recent Prog Horm Res. 2001;56:175 194.
99. Schade DS, Jovanovic L, Schneider J. A placebo-controlled, randomized study of glimepiride in patients with type 2 diabetes mellitus for whom diet therapy is unsuccessful. J Clin Pharmacol. 1998;38:636 641.
100. Simonson DC, Kourides IA, Feinglos M, Shamoon H, Fischette CT: Efficacy, safety, and dose-response characteristics of glipizide gastrointestinal therapeutic system on glycemic control and insulin secretion in NIDDM: results of two multicenter, randomized, placebo-controlled clinical trials. Diabetes Care. 1997;20:597 606.
101. Kimmel B, Inzucchi SE. Oral agents for type 2 diabetes: an update. Clin Diabetes. 2005; 23:64 76.
102. Zimmerman BR. Sulfonylureas. Endocrinol Metab Clin North Am. 1997;26:511 521.
103. Shorr RI, Ray WA, Daugherty JR, Griffin MR. Individual sulfonylureas and serious hypoglycemia in older people. J Am Geriatr Soc. 1996;44:751 755.
104. Campbell IW. Hypoglycaemia and type 2 diabetes: sulphonylureas. In: Frier BM, Fisher BM, eds. Hypoglycaemia and Diabetes: Clinical and Physiological Aspects. London: Edward Arnold;1993:387 392.
105. Johnson JA, Majumdar SR, Simpson SH, Toth EL. Decreased mortality associated with the use of metformin compared with sulfonylurea monotherapy in type 2 diabetes. Diabetes Care. 2002;25:2244 2248.
106. Garratt KN, Brady PA, Hassinger NL, et al. Sulfonylurea drugs increase early mortality in patients with diabetes mellitus after direct angioplasty for acute myocardial infarction. J Am Coll Cardiol. 1999;33:119 124.
107. Klamann A, Sarfert P, Launhardt V, et al. Myocardial infarction in diabetic vs non-diabetic subjects: survival and infarct size following therapy with sulfonylureas. Eur Heart J. 2000; 21:220 229.
108. Halkin A, Roth A, Jonas M, Behar S. Sulfonylureas are not associated with increased mortality in diabetics treated with thrombolysis for acute myocardial infarction. J Thromb Thrombolysis. 2001;12:177 184.
109. Hollander PA, Schwartz SL, Gatlin MR, et al. Nateglinide, but not glyburide, selectively enhances early insulin release and more effectively controls post-meal glucose excursions with less total insulin exposure [abstract]. Diabetes. 2000;49(suppl 1):447P.
P.188
110. Haffner SM, Stern MP, Hazuda HP, Mitchell BD, Patterson JK. Cardiovascular risk factors in confirmed prediabetic individuals: does the clock for coronary heart disease start ticking before the onset of clinical diabetes? JAMA. 1990;263:2893 2898.
111. Hanefeld M, Koehler C, Henkel E, et al. Post-challenge hyperglycaemia relates more strongly than fasting hyperglycaemia with carotid intima-media thickness: the RIAD Study: Risk Factors in Impaired Glucose Tolerance for Atherosclerosis and Diabetes. Diabetes Med. 2000;17:835 840.
112. DECODE Study Group. Glucose tolerance and mortality: comparison of WHO and American Diabetic Association diagnostic criteria. Lancet. 1999;354:617 621.
113. Jovanovic L, Dailey G 3rd, Huang WC, Strange P, Goldstein BJ. Repaglinide in type 2 diabetes: a 24-week, fixed-dose efficacy and safety study. J Clin Pharm. 2000;40:49 57.
114. Horton ES, Clinkingbeard C, Gatlin M, et al. Nateglinide alone and in combination with metformin improves glycemic control by reducing mealtime glucose levels in type 2 diabetes. Diabetes Care. 2000;23:1660 1665.
115. Hollander PA, Schwartz SL, Gatlin MR, et al. Importance of early insulin secretion: comparison of nateglinide and glyburide in previously diet-treated patients with type 2 diabetes. Diabetes Care. 2001;24:983 988.
116. Hu S, Wang S, Dunning BE. Glucose-dependent and glucose-sensitizing insulinotropic effects of nateglinide: comparison to sulphonylureas and repaglinide. Int J Exp Diabetes Res. 2001;2:63 72.
117. Saloranta C, Guitard C, Pecher E, et al. Nateglinide improves early insulin secretion and controls postprandial glucose excursions in a prediabetic population. Diabetes Care. 2002;25:2141 2146.
118. Goke B, Herrmann-Rinke C. The evolving role of alpha-glucosidase inhibitors. Diabetes Metab Rev. 1998;14(suppl 1):S31-S38.
119. Hanefeld M, Fischer S, Schulze J, et al. Therapeutic potentials of acarbose as first-line drug in NIDDM insufficiently treated with diet alone. Diabetes Care. 1991;14:732 737.
120. Hotta N, Kabuta H, Sano T, et al. Long-term effect of acarbose on glycaemic control in non-insulin-dependent diabetes mellitus: a placebo-controlled double-blind study. Diabetes Med. 1993;10:134 138.
121. Scott R, Lintott CJ, Zimmet R, et al. Will acarbose improve the metabolic abnormalities of insulin-resistant type 2 diabetes mellitus? Diabetes Res Clin Pract. 1999;43:179 185.
122. van de Laar FA, Lucassen PL, Kemp J, et al. Is acarbose equivalent to tolbutamide as first treatment for newly diagnosed type 2 diabetes in general practice? A randomised controlled trial. Diabetes Res Clin Pract. 2004;63:57 65.
123. Chiasson JL, Josse RG, Gomis R, et al. The STOP-NIDDM Trial Research Group: acarbose treatment and the risk of cardiovascular disease and hypertension in patients with impaired glucose tolerance: the STOP-NIDDM trial. JAMA. 2003;290:486 494.
124. Inzucchi SE, Maggs DG, Spollett GR, et al. Efficacy and metabolic effects of metformin and troglitazone in type II diabetes mellitus. N Engl J Med. 1998;338:867 872.
125. Iozzo P, Hallsten K, Oikonen V, et al. Effects of metformin and rosiglitazone monotherapy on insulin-mediated hepatic glucose uptake and their relation to visceral fat in type 2 diabetes. Diabetes Care. 2003;26:2069 2074.
126. Klip A, Leiter LA. Cellular mechanism of action of metformin. Diabetes Care. 1990;13:696 704.
127. Nagi D, Yudkin J. Effects of metformin on insulin resistance, risk factors for cardiovascular disease, and plasminogen activator inhibitor in NIDDM subjects. Diabetes Care. 1993;16:621 629.
128. DeFronzo R, Goodman A. The multicenter study group: efficacy of metformin in patients with non-insulin dependent diabetes mellitus. N Engl J Med. 1995;333:541 549.
129. Grant P. The effects of high- and medium-dose metformin therapy on cardiovascular risk factors in patients with type II diabetes. Diabetes Care. 1996;19:64 66.
130. Grant PJ. The effects of metformin on the fibrinolytic system in diabetic and non-diabetic subjects. Diabetes Metab. 1991;17:168 173.
P.189
131. Chu NV, Kong APS, Kim DD, et al. Differential effects of metformin and troglitazone on cardiovascular risk factors in patients with type 2 diabetes. Diabetes Care. 2002;25:542 549.
132. Nathan DM. Some answers, more controversy, from UKPDS. Lancet. 1998;352:832 833.
133. Garber AJ, Larsen J, Schneider SH, et al. Simultaneous glyburide/metformin therapy is superior to component monotherapy as an initial pharmacological treatment for type 2 diabetes. Diabetes Obes Metab. 2002;4:201 208.
134. DeFronzo RA, Goodman AM. Efficacy of metformin in patients with non-insulin-dependent diabetes mellitus. N Engl J Med. 1995;333:541 549.
135. Garber AJ, Duncan TG, Goodman AM, Mills DJ, Rohlf JL. Efficacy of metformin in type II diabetes: results of a double-blind, placebo-controlled, dose-response trial. Am J Med. 1997;103:491 497.
136. Lord JM, Flight IH, Norman RJ. Metformin in polycystic ovary syndrome: systematic review and meta-analysis. Br Med J. 2003;327:951 953.
137. Fujioka K, Ledger G, Stevens J, et al. Once-daily dosing of a metformin extended release (Met-XR) formulation: effects on glycemic control in patients with type 2 diabetes currently treated with metformin [abstract]. Diabetes. 2000;49(suppl 1):431P.
138. Misbin RI, Green L, Stadel BV, et al. Lactic acidosis in patients with diabetes treated with metformin. N Engl J Med. 1998;338:265 266.
139. Howlett HC, Bailey CJ. A risk-benefit assessment of metformin in type 2 diabetes mellitus. Drug Saf. 1999;20:489 503.
140. Levey AS, Bosch JP, Lewis JB, et al. A more accurate method to estimate glomerular filtration rate from serum creatinine: a new prediction equation: modification of diet in renal disease study group. Ann Intern Med. 1999;130:461 470.
141. National Kidney Foundation. K/DOQI clinical practice guidelines for chronic kidney disease: evaluation, classification, and stratification. Am J Kidney Dis. 2002;39(Suppl 1):S1-S266.
142. Horlen C, Malone R, Bryant B, et al. Frequency of inappropriate metformin prescriptions. JAMA. 2002;287:2504 2505.
143. Calabrese A, Coley K, DaPos S, Swanson D, Rao R. Evaluation of prescribing practices: risk of lactic acidosis with metformin therapy. Arch Intern Med. 2002;162:434 437.
144. Masoudi FA, Wang Y, Inzucchi SE, et al. Metformin and thiazolidinedione use in Medicare patients with heart failure. JAMA. 2003;290:81 85.
145. Spiegelman BM: PPAR- : adipogenic regulator and thiazolidinedione receptor. Diabetes. 1998;47:507 514.
146. Miyazaki Y, Mahankali A, Matsuda M, et al. Improved glycemic control and enhanced insulin sensitivity in type 2 diabetic subjects treated with pioglitazone. Diabetes Care. 2001;24:710 719.
147. Ikeda M, Nakahara I, Shiba Y, Matsuhisa M, Hori M. High plasma free fatty acids decrease splanchnic glucose uptake in patients with non-insulin-dependent diabetes mellitus. Endocr J. 1998;45:165 173.
148. Arita Y, Kihara S, Ouchi N, et al. Paradoxical decrease of an adipose-specific protein, adiponectin, in obesity. Biochem Biophys Res Commun. 1999;257:79 83.
149. Yamauchi T, Kamon J, Waki H, et al. The fat derived hormone adiponectin reverses insulin resistance associated with both lipoatrophy and obesity. Nat Med. 2001;7:941 946.
150. Weyer C, Funahashi T, Tanaka S, et al. Hypoadiponectimia in obesity and type 2 diabetes: close association with insulin resistance and hyperinsulinemia. J Clin Endocrinol Metab. 2001;86:1930 1935.
151. Hotta K, Funahashi T, Arita Y, et al. Plasma concentration of a novel adipose specific protein adiponectin in type 2 diabetic patients. Arterioscler Thromb Vasc Biol. 2000;20:1595 1599.
152. Yu JG, Javorschi S, Hevener AL, et al. The effect of thiazolidinediones on plasma adiponectin levels in normal, obese and type 2 diabetic subjects. Diabetes. 2002;51:2968 2974.
153. Adams M, Montague CT, Prins JB, et al. Activators of peroxisome proliferator-activated receptor gamma have depot-specific effects on human preadipocyte differentiation. J Clin Invest. 1997;100:3149 3153.
P.190
154. Kruszynska YT, Mukherjee R, Jow L, et al. Skeletal muscle peroxisome proliferator-activated receptor-gamma expression in obesity and non-insulin-dependent diabetes mellitus. J Clin Invest. 1998;101:543 548.
155. Howard G, O'Leary DH, Zaccaro D, et al. The Insulin Resistance Atherosclerosis Study (IRAS) Investigators: insulin sensitivity and atherosclerosis. Circulation. 1996;93:1809 1817.
156. Ovalle F, Bell DSH. Lipoprotein effects of different thiazolidinediones in clinical practice. Endocr Pract. 2002;8:406 410.
157. American Diabetes Association. Standards of medical care for patients with diabetes mellitus. Diabetes Care. 2005;25(suppl 1):S15-S16.
158. Pioglitazone package insert. Lincolnshire, IL: Takeda Pharmaceuticals America, Inc.; January 2002.
159. Greenberg AS, Pittas AG. Thiazolidinediones in the treatment of type 2 diabetes. Expert Opin Pharmacother. 2002;3:529 540.
160. Nesto RW, Bell D, Bonow RO, et al. Thiazolidinedione use, fluid retention, and congestive heart failure: a consensus statement from the American Heart Association and American Diabetes Association. Circulation. 2003;108:2941 2948.
161. King AB. A comparison in a clinical setting of the efficacy and side effects of three thiazolidinediones. Diabetes Care. 2000;23:557.
162. Simonson DC. Etiology and prevalence of hypertension in diabetic patients. Diabetes Care. 1988;11:821 827.
163. UK Prospective Diabetes Study Group. Efficacy of atenolol and captopril in reducing risk of macrovascular and microvascular complications in type 2 diabetes (UKPDS 39). Br Med J. 317:713 720.
164. Bakris GL, Dole JF, Porter LE, Huang C, Freed MI. Rosiglitazone improves blood pressure in patients with type 2 diabetes mellitus. Diabetes. 2000;49(suppl 1):Abstract 96.
165. F llert S, Schneider F, Haak E, et al. Effects of pioglitazone in non-diabetic patients with arterial hypertension: a double-blind, placebo-controlled study. J Clin Endocrinol Metab. 2002;87:5503 5506.
166. Bruno G, Cavallo-Perin P, Bargero G, et al. Association of fibrinogen with glycemic control and albumin excretion rate in patients with non-insulin dependent diabetes mellitus. Ann Intern Med. 1996;125:653 657.
167. Freed M, Fuell D, Menci L, Heise M, Goldstein B. Effect of combination therapy with rosiglitazone and glibenclamide on PAI-1 antigen, PAI-1 activity and tPA in patients with type 2 diabetes (abstract). Diabetoliogia. 2000;43(suppl 1):A267.
168. Mohanty P, Aljada A, Ghanim H, et al. Rosiglitazone imporves vascular reactivity, inhibits reactive oxygen species (ROS)f generation, reduces p47phox subunit expression in mononuclear cells (MNC) and reduces C-reactive protein (CRP) and monocyte chemotactic protein-1 (MCP-1): evidence of a potent anti-inflammatory evvect (abstract). Diabetes. 2001;50(suppl 2) A68.
169. Nash DT. Insulin resistance, ADMA levels, and cardiovascular disease. JAMA. 2002;287:1451 1452.
170. Defronzo R. Pharmacological therapy for type 2 diabetes mellitus. Ann Intern Med. 1999; 131:281 303.
170a. Kahn SE, Haffner SM, Heise MA, et al. for the ADOPT Study Group. Glycemic durability of rosiglitazone, metformin or glyburide monotherapy. N Engl J Med. 2006;355:2427 2443.
170b. Nathan DM. Thiazolidinediones for initial treatment of type 2 diabetes? N Engl J Med. 2006;355:2477 2480.
171. Einhorn D, Rendell M, Rosenzweig J, et al. Pioglitazone hydrochloride in combination with metformin in the treatment of type 2 diabetes mellitus: a randomized, placebo-controlled study: the Pioglitazone 027 Study Group. Clin Ther. 2000;22:1395 1409.
172. Fonseca V, Rosenstock J Patwardhan R, Salzman A. Effect of metformin and rosiglitazone combination therapy in patients with type 2 diabetes mellitus. JAMA. 2000;283:1695 1702.
P.191
173. Leichter SB, Thomas S. Combination medications in diabetes care: an opportunity that merits more attention. Clin Diabetes. 2003;21:175 178.
174. Mojsov S, Weir GC, Habener JF. Insulinotropin: Glucagon-like peptide I (7-37) co-encoded in the glucagons gene is a potent stimulator of insulin release in the perfused rat pancreas. J Clin Invest. 1987;79:616 619.
175. Unger J. Glucose regulations and clinical shortcomings: diabetes consult collection. Emerg Med [Suppl]. 2006;3 4.
176. Hermansen K, et al. European Association for the Study of Diabetes. Munich, Germany; 2004; Poster 754:PS 064.
177. Riddle MC, Rosenstock J, Gerich J. The treat-to-target trial: randomized addition of glargine or human NPH insulin to oral therapy of type 2 diabetic patients. Diabetes Care. 2003;26:3080 3086.
178. Garber AJ, Wahlen J, Wahl T, et al. Attainment of glycaemic goals in type 2 diabetes with once-, twice-, or thrice- daily dosing with biphasic insulin aspart 70/30 (The 1-2-3 study). Diabetes Obes Metab. 2006;8:58 66.
179. Malone JK, Beattie SD, Campaigne BN, et al. Therapy after single oral agent failure: adding a second oral agent or an insulin mixture? Diabetes Res Clin Pract. 2003;62:187 195.
180. Aschner P, Kipnes MS, Lunceford JK. Effect of the dipeptidyl peptidase-R inhibitor sitagliptin as monotherapy on glycemic control in patients with type 2 diabetes. Diabetes Care. 2006;29:2632 2637.
181. Charbonnel B, Karasik A, Liu J, et al. Efficacy and safety of sitagliptin added to ongoing metformin therapy in patients with type 2 diabetes who were inadequately controlled on metformin therapy. Presented at the European Association for the Study of Diabetes 42nd Annual Meeting. Copenhagen, Denmark, September 14 17, 2006.
182. Ahren B, Pacini G, Foley JE, et al. Improved meal-related -b-cell function and insulin sensitivity by the dipeptidyl peptidase-IV inhibitor vildagliptin in metformin treated patients with type 2 diabetes over 1 year. Diabetes Care. 2005;28:1936 1940.
183. Shah BR, Hux JE, Laupacis A, Zinman B, van Walraven C. Clinical inertia in response to inadequate glycemic control. Diabetes Care. 2005;28:600 606.
EAN: 2147483647
Pages: 19