Creating Geographical Mapping
|
While the charting capabilities of Crystal Reports are useful, sometimes another graphical representation might better enhance the data trends of your report. Another useful visual tool is Crystal Reports' geographical mapping, which gives you the ability to create maps from geographically related information (such as Regions, as in the case of the report you've been creating in this chapter).
| Tip | Crystal Reports creates maps utilizing a third-party product called MapInfo. While Crystal Reports comes with several useful map files, you may purchase more directly from MapInfo (they are then made accessible from Crystal Reports by adding them to the following folder: \Program Files\Map Info X). Check out MapInfo's web site at www.mapinfo.com for more information about the additional map files that might be of benefit to you in your reporting endeavors. |
In Crystal Reports, geographical mapping capabilities are created through the Map Expert. To access the Map Expert, select Insert, Map from the menu bar. The Map Expert dialog box displays, as shown in Figure 12-10.
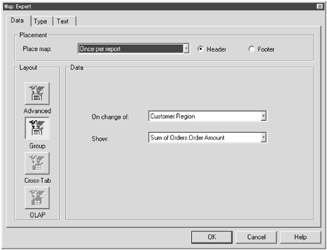
Figure 12-10: The Map Expert
| Note | Make sure you have your Crystal Reports CD handy just in case the third-party mapping files were not added during initial install. Crystal Reports may ask for the CD to install the required mapping .dll files in order to use the Map Expert properly. |
Working with the Data Tab
Like the Chart Expert Data tab, the Map Expert Data tab allows you to define the data that your map is to be based on and where it is to reside within your report. Also like the Chart Expert Data tab, the Map Expert Data tab contains the following three sections:
-
Placement: Allows you to select the location of the map on the report and how the map will recur throughout the report.
-
Layout: Defines the different data selection options the map allows — for example, Advanced (which provides optimal control of mapping options), Group (which is the default layout and allows two drop-down boxes to specify the creation of your map when you access the Data section), Cross-Tab (which only appears when your report is a Cross-Tab report), and OLAP (which only appears when your report utilizes an OLAP data source).
-
Data: Allows you to define the information that makes up the map.
Let's try an example. In the report you've created in this chapter, perform the following steps in the Map Expert Data tab:
-
In the Placement section, make sure the following is selected in the Place map drop-down field: Once per report.
-
Also in the Placement section, select the Header option button.
-
In the Data section, make sure the following is selected in the On change of drop-down field: Customer.Region.
-
Also in the Data section, make sure the following is selected within the Show drop-down field: Sum of Orders.Order Amount.
Once these settings are defined, select the Type tab at the top of the Map Expert dialog box.
Working with the Type Tab
The Map Expert Type tab provides five map options that you may select, each offering a different summarization category for your geographical mapping. Table 12-2 summarizes the different map types available within Crystal Reports.
| Map Icon | Map Type | Description |
|---|---|---|
| | Ranged | Divides data into ranges and then assigns a specific color to each range. |
| | Dot Density | Displays dots for each occurrence of a specified item in order to provide an overall impression of the distribution of that item. |
| | Graduated | Displays one symbol per instance of a specified item (such as a circle by default, although you can define any symbol you prefer). The symbol is proportional in size to the value of the item that it represents. |
| | Pie Chart | Displays a pie chart over each geographical area, with each slice within the pie representing individual data items. |
| | Bar Chart | Displays a bar chart over each geographical area, with each bar of the chart representing individual data items. |
Within the Type tab, you'll notice an Options section. In this section, you can further define the appearance of the map values as they display within your map (such as the colors for the lowest and highest intervals on your map). For now, let's just stick with the defaults. Your screen should look like Figure 12-11.
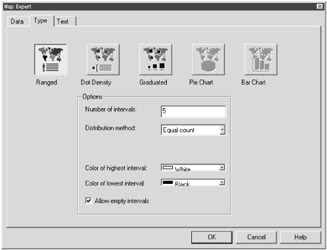
Figure 12-11: The Map Expert Type tab
Select the Text tab at the top of the Map Expert dialog box. You'll find yourself at the Text tab.
Working with the Text Tab
The Map Expert Text tab allows you to define a map title (if you wish) along with defining various display instructions for the title, subtitle, or legend information. To complete the map you've been creating, try the following:
-
In the Text tab, type the following in the Map title field: Sum of Orders by Region Geographical Map.
-
Press the OK button in the Map Expert.
You're returned to the Report Design area. Preview your report. You should see your newly created map above your chart. Figure 12-12 displays the results of your work.
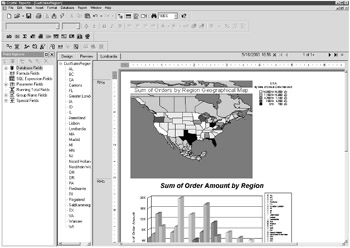
Figure 12-12: A report that utilizes a map
| Tip | As was the case with the Chart Expert, remember that the map displayed in the Design tab is not your completed map — it's just a graphical representation. You'll need to preview your report to actually see the correct orientation of your map. |
Editing Your Created Map
Like the Chart Expert, you can edit the appearance of your map by right-clicking on the map. An options menu displays. From there, select the Map Expert option. The Map Expert dialog box displays, containing the information from your defined map. You can now edit your map settings as needed.
Drilling Down on Map Data
Also like the Chart Expert, the Map Expert allows for drill-down functionality.
As an example, try double-clicking on "Texas" in your map. A drill-down tab is created for Texas, as shown in Figure 12-13. In this new tab, you can view the information that makes up the total of the Texas bar within your chart.
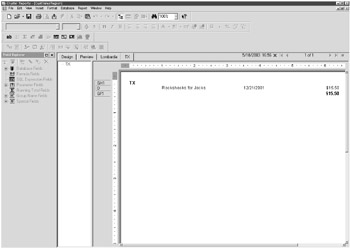
Figure 12-13: The drill-down tab of a map
Save the work you've done in this chapter as CustSalesRegion.rpt. We return to this report in the next chapter.
|
EAN: 2147483647
Pages: 177