Real-World Applications: Why We Analyze
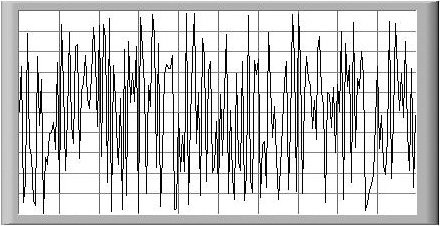
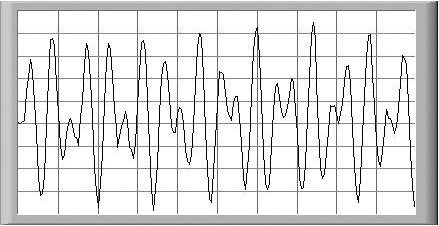
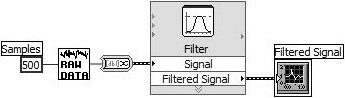
| Once you get data into your computer, you may want to process your data somehow. A few of the many possible analysis applications for LabVIEW include biomedical data processing, speech synthesis and recognition, and digital audio and image processing. The importance of integrating analysis libraries into laboratory stations is obvious: The raw data collected from your DAQ device or GPIB instrument does not always immediately convey useful information. Often you must transform the signal, remove noise, correct for data corrupted by faulty equipment, or compensate for environmental effects such as temperature and humidity. Figure 2.6 shows data containing noise that is obscuring our signal of interest. Figure 2.6. Data containing noise By analyzing and processing the digital data, you can extract the useful information from the noise and present it in a form more comprehensible than the raw data. The processed data looks more like what is displayed in Figure 2.7. Figure 2.7. Data that has been processed to remove noise The LabVIEW block diagram programming method and the extensive set of LabVIEW analysis VIs simplify the development of analysis applications. The following sample block diagram illustrates the LabVIEW programming concept (see Figure 2.8). Figure 2.8. Block diagram showing how you might process raw data and graph the results in LabVIEW Because the LabVIEW analysis functions give you popular data analysis techniques in discrete VIs, you can wire them together, as shown in the previous picture, to analyze data. Instead of worrying about implementation details for analysis routines as you do in most programming languages, you can concentrate on solving your data analysis problems. LabVIEW's analysis VIs are powerful enough for experts to build sophisticated analysis applications using digital signal processing (DSP), digital filters, statistics, or numerical analysis. At the same time, they are simple enough for novices to perform sophisticated calculations. The LabVIEW analysis VIs efficiently process blocks of information represented in digital form. They cover the following major processing areas:
|
EAN: 2147483647
Pages: 294