Developer Component: Communication App Inspector
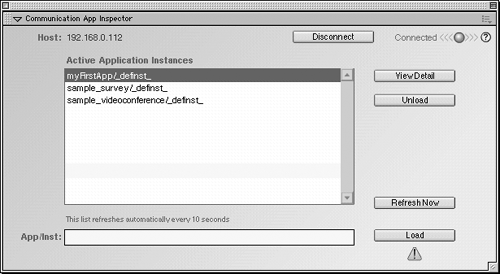
| When you are ready to tackle server-side scripting, the Communication Server's App Inspector will be your new best friend. The App Inspector is a view into the server from within the Flash authoring environment. It is one of the three tools you can use when you are debugging. The App Inspector operates similarly to the Flash MX Output window displaying compiler errors and trace activity at runtime. It also lets you monitor SharedObject connections and streams being sent or received. You need this tool to recompile (reload) your application when changes are made to the main.asc file. If you had Flash MX installed on your computer before you installed the Flash Communication Server, you are ready to open the Inspector. If you are working on Mac OS, or on a computer that is remote from the server, you will have to install the Inspector manually. Please refer to Chapter 1, "STEP 1: Installation and Setup," to learn how to install it manually. You can also access the Inspector from within the Communication Server Administration Console. The App Inspector presents you with the familiar login screen. Log in with your server host, name , and administration password. The virtual host password assigned to you by your system administrator can also be entered here. The familiar connection light will turn green; and if your login was successful, you will be pushed to the Application Instances panel. Application Instances PanelThe Application Instances panel is the first screen you see after you have logged in successfully (see Figure 5.7). The instances window immediately displays every loaded application. If you are using a virtual host account, only the applications within your host are displayed. Server administration logins will see every application from every host. Figure 5.7. Application Instances panel in the Communication App Inspector. This panel is the only panel that gives you some interaction with your application. From this panel, you can load and unload applications. It also acts as an application browser displaying each running application on the server. If you do not see any application instances in the window, you can load one. Let's practice loading and unloading application instances using this panel. Loading an Application Using the Macromedia Flash Communication Server MX App InspectorIf you completed the previous exercises using the application myFirstApp, use that as your example. If not, use a sample application installed with your server called sample_broadcast. Follow these steps to load the application:
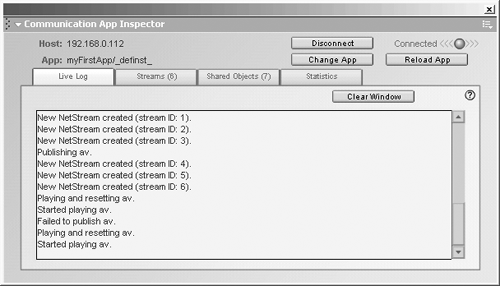
Keep your eye on the Instance window. In about 10 seconds, you should see a new instance of myFirstApp appear. Application instances automatically are created by the first Flash player to run an application if it is not already running. Normally, this is not a process you would follow, but it is good to understand how application instances are created, and how the App Inspector can help manage them. Let's move on. With the new instance of myFirstApp selected, click the View Detail button. The statistical details relating to that application instance open. There are four areas of monitoring within this Inspector: Live Log, Streams, Shared Objects, and Statistics. The Live Log PanelThe Live Log panel is similar to the Live Logs you saw in the Administration Console (see Figure 5.8). Specific information about the application's instance is displayed here. The Administration Console log displays information about system-wide communications and connections. Figure 5.8. The Live Log panel. When this panel is open, it streams live stats about the application. When a user starts her web camera, for example, the server starts a NetStream. This is represented in Figure 5.8. Three buttons are available above the panel:
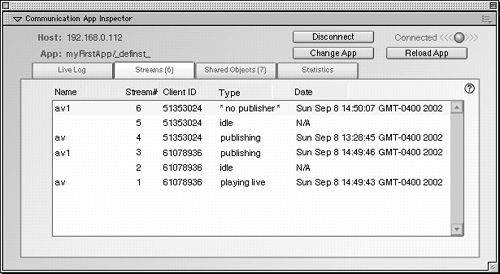
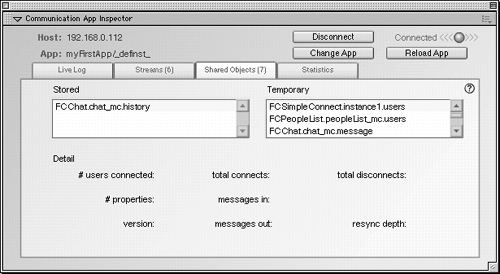
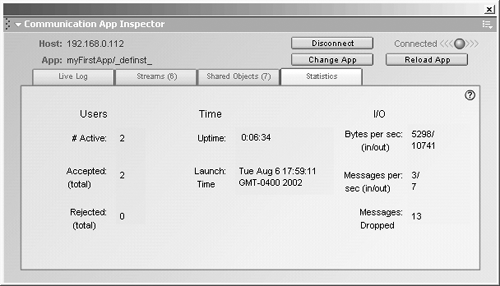
These buttons will always appear at the top of the App Inspector. The Streams PanelFigure 5.9 displays the log for the _definst_ instance of myFirstApp. The instance currently has two connected users and one AVPresence (camera) window open. This can be determined because only a single publisher is displayed, meaning only one user is transmitting. The two playing live streams show that two users (including the user who is publishing) are watching the live video stream. In this example, you can identify unique users by the ClientID declaration. Figure 5.9. The Streams Monitor displaying stream details for the myFirstApp/_definst_ application instance. This tool will come in handy particularly when debugging advanced applications where you have more control over the streams using ActionScript. There will be more explanation about the NetStream object in Chapter 7, "Streaming Video with NetStream()." The Shared Objects PanelSharedObjects are a cornerstone of the Communication Server. In concept, they are similar to the local SharedObject model in Flash MX; however, with the Communication Server, SharedObjects can also be created at the server by the server or through ActionScript. Their persistence can be either temporary or stored, as represented in Figure 5.10. Figure 5.10. The Shared Objects Monitor. These objects allow your Communication Server applications to share data, such as database information, or the position of a shared cursor. The Chat window used in the myFirstApp exercise is a great example of a persistent server-side SharedObject. The data in the Chat window is made available by accessing the shared chat object on the server. Each Flash client that connects with the server accesses that data object to return the chat text. This monitor displays both the persistent (stored) and temporary SharedObjects used by an application instance. The Statistics PanelThe Statistics panel displays the overall state of an application's instance (see Figure 5.11). This is helpful for tracking an instance's server resource consumption (RAM, processor, and so on). If you are running out of connections, or bandwidth, you can determine if this application instance is responsible and take the appropriate action. As you get more advanced, you will find this tool helpful for optimizing application performance. Figure 5.11. The Statistics panel. The number of Accepted or Rejected users, the application running time (Uptime), and when it was first instanced (Launch Time) are also displayed here. Bandwidth information displays bytes that the server has received and sent. In Figure 5.11 you can see there have been 5,298 bytes (or 5k) of data sent to the server, with 10,741 bytes (or 11k) of data sent from the server. Why is it double? There were two users connected. The server received a transmission (or publishing) stream from one computer and sent it out to two computers. The Messages per Second statistic operates similar to the bandwidth display. One computer sends a message, and the server broadcasts it to every connected user (including the publisher). A collected total of three messages were sent by the users. The server delivered two copies of each messageone for each userthus, the server shows seven messages out. Messages also include exchanges between client and server such as an ActionScript command informing the client to start playing a new video stream. Messages Dropped does not represent scripting command messages lost, but if a user disconnects and the message could not be delivered, it is recorded in this count. Drops also occur if a connected client falls behind in receiving data as a result of its local connection, computer speed, or the stability of the Flash application. The Statistics panel updates itself every 15 seconds. App Inspector SummaryThis tool will become an invaluable asset to the development of Communication Server applications. When using the SimpleConnect methods , as we have in the examples so far, you do lose some control of your application. This book will make reference to the App Inspector periodically, to monitor and debug some advanced scripting development. The third and final tool that Macromedia has shipped with the Communication Server is the NetConnection Debugger. The debugger allows you to watch ActionScript objects being sent between the server and the client. If you have used Flash Remoting MX, you will be familiar with the debugger. It is also used to monitor Action Message Format (AMF) exchanges when communicating with application servers such as Macromedia ColdFusion MX, Microsoft ASP.NET, or any Flash Remoting MX-enabled J2EE server. It is used to closely monitor AMF messages, server function invocations, and responses. It, like the App Inspector, is not an interactive debugging tool; its only purpose is to "watch" activity. |
EAN: 2147483647
Pages: 200
