InnoDB and Memory
| < Day Day Up > |
| This section cites ways to configure, monitor, and tune InnoDB's advanced memory-based buffering and caching capabilities for optimal performance. Buffer PoolMost modern database servers take advantage of system memory to increase performance by reducing and/or delaying the amount of interaction with the much slower disk drives. InnoDB is no exception: Its buffer pool offers sophisticated data analysis and caching algorithms that translate to significant response enhancements. The buffer pool contains many internal structures that determine what information is placed in the cache, how it is synchronized to disk, and what should be removed from the cache. The design and details of these internals are beyond the scope of this book, but it's important to understand that they exist and play a vital role in augmenting database speed. Database administrators set a number of key server variables that control the overall size of the buffer pool, along with its behavior. The following sections look at how to configure, monitor, and tune this essential module. Buffer Pool ConfigurationThe server variable that controls the amount of memory to be allocated to the buffer pool is innodb_buffer_pool_size. How much memory should you apportion to your buffer pool? The conventional wisdom ranges from 50% to 80% of all available memory, which is a good starting point. However, before picking a value, you should ponder several key considerations:
After settling on a buffer pool size, you then need to manage additional necessities for this cache. Given that the buffer pool is the main in-memory cache for InnoDB index and data information, two important requirements spring to mind:
The innodb_max_dirty_pages_pct server variable helps satisfy both of these obligations. With a range from 0 to 100, it instructs the primary InnoDB thread to synchronize (that is, flush) dirty pages to disk. For example, if set to 80, InnoDB does not allow more than 80% of the pages in the buffer pool to be marked as dirty. Instead, it flushes enough pages to bring the dirty page percentage in line with this parameter. However, in reality, it's fairly unlikely that adjusting this setting will make much of a difference in resolving a performance bottleneck. For example, if your system is configured with insufficient memory for the computing tasks at hand, the buffer pool page contention issue that you are attempting to address with this parameter is merely a symptom of the underlying problem: inadequate memory for the server's processing load. In recent years, Microsoft introduced enhanced virtual memory capabilities into its server-side operating system. Known as Address Windowing Extensions (AWE), it gives administrators access to substantially larger amounts of memory than the previous limit of 4GB. To make this memory available to the InnoDB buffer pool, just set the innodb_buffer_pool_awe_mem_mb to the amount of additional memory that you want to use, with a limit of 64GB. Chapter 10, "General Server Performance and Parameters Tuning," explains the differences among MySQL's in-memory caches. Recall that in addition to the buffer pool, InnoDB also employs a cache (known as the memory cache) to accumulate RAM-based information about database structure as well as other internal details. As an administrator, you have control over the size of this cache by setting the innodb_additional_mem_pool_size parameter. If you are running a very large and/or complex database and insufficient memory is assigned to the memory cache, MySQL requisitions supplementary memory from the operating system. In most cases, however, the out-of-the-box default value should suffice. Buffer Pool Monitoring and TuningTo help give you a better idea of how well your buffer pool is being used, you can create a collection of custom MySQL Administrator graphs that use the status variables introduced in version 5.0.2, as shown in the following two examples. The first explores a number of buffer pool specific indicators, whereas the second reports on InnoDB page and row operations. To begin, Figure 12.5 shows an example of monitoring a 256MB buffer pool's state just after InnoDB has started, but prior to any activity. Figure 12.5. Monitoring a quiet InnoDB buffer pool.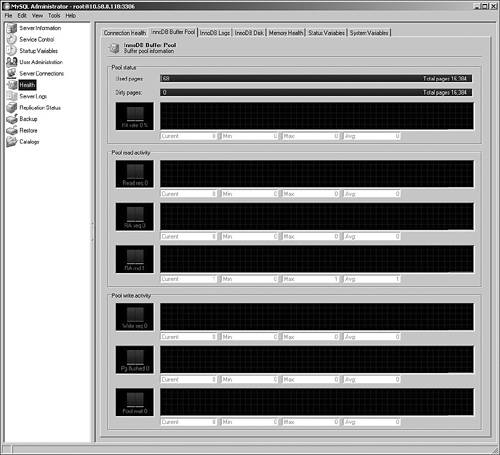 Because the next part of this chapter also refers to this custom MySQL Administrator graph, take a moment to explore its components. From top to bottom, they include the following:
061230 15:55:47InnoDB: Warning: difficult to find free blocks from InnoDB: the buffer pool (285 search iterations)! Consider InnoDB: increasing the buffer pool size. InnoDB: It is also possible that in your Unix version InnoDB: fsync is very slow, or completely frozen inside InnoDB: the OS kernel. Then upgrading to a newer version InnoDB: of your operating system may help. Look at the InnoDB: number of fsyncs in diagnostic info below. InnoDB: Pending flushes (fsync) log: 0; buffer pool: 0 InnoDB: 241586 OS file reads, 279151 OS file writes, 48757 OS fsyncs InnoDB: Starting InnoDB Monitor to print further InnoDB: diagnostics to the standard output. If you prefer character-oriented utilities, you can run SHOW INNODB STATUS. The section of its results that's relevant for the buffer pool is as follows: BUFFER POOL AND MEMORY ---------------------- Total memory allocated 317682874; in additional pool allocated 1529728 Buffer pool size 16384 Free buffers 1 Database pages 16298 Modified db pages 57 Pending reads 63 Pending writes: LRU 0, flush list 2, single page 0 Pages read 343297, created 572, written 22277 1.00 reads/s, 0.00 creates/s, 0.00 writes/s Buffer pool hit rate 999 / 1000 In Figure 12.6, a collection of heavy read-oriented processes is started; you can examine what things look like in the buffer pool. Figure 12.6. Buffer pool activity for a read-intensive server load. A second group of graphs, which focus on InnoDB page and row access, are shown in Figure 12.7. Figure 12.7. Page and row activity for a read-intensive server load.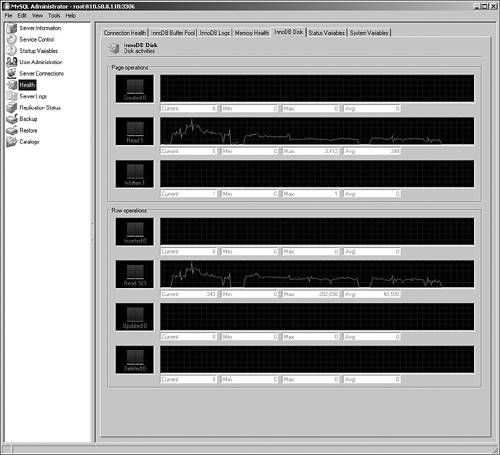 This second page tracks the following indicators:
The SHOW INNODB STATUS command generates a character-based counterpart to these graphs: -------------- ROW OPERATIONS -------------- 8 queries inside InnoDB, 0 queries in queue Main thread process no. 7818, id 1839139760, state: sleeping Number of rows inserted 10552, updated 0, deleted 0, read 14515057 5000.00 inserts/s, 0.00 updates/s, 0.00 deletes/s, 9000.00 reads/s ---------------------------- Observe that the graphs correctly reflect the heavy read activity on the server, whereas all indications of write activity are quiescent. You can see good buffer pool cache hits, especially when InnoDB is performing large, sequential read operations (particularly prevalent on the left one third of the graphs). Although you can see a good hit rate, if this was the typical activity profile for your server, it might be worthwhile to boost the size of the buffer pool to allow even more pages to be cached. However, make sure to let your statistics accumulate over a meaningful period of time before finalizing this kind of change. To balance the load, you can introduce a collection of database processes that perform significant amounts of data alterations, as shown in Figure 12.8. Figure 12.8. Buffer pool activity from a more balanced server load. Things are still going well: The buffer pool cache hit rate remains very high, pages are being synchronized to disk regularly, and there have been no waits for the buffer pool to be flushed. With a consistent hit rate of 99%, in fact, you might even be able to reduce buffer pool memory if it didn't significantly lower the caching percentage. Again, however, it's important to let enough time pass before making such a change. Finally, you can completely flip the processing profile of your server by converting its primary workload into CREATE/UPDATE/DELETE operations, as shown in Figure 12.9. Figure 12.9. Buffer pool activity for a write-intensive server load. The buffer pool cache rate is high, but observe how there aren't many used pages in the cache. Assuming that this pattern holds up over time, this is a good indicator of a situation in which a relatively small amount of data is heavily accessed (and consequently placed into the buffer pool) to support other operations. A good example of this kind of scenario is a lookup table that drives data alterations in other tables. If this was the typical profile of your server, you could probably reduce the size of the buffer pool given its underutilization. Meanwhile, the write performance appears optimal: Page flushing is proceeding normally, and there have been no wait states on the buffer pool. The previous three examples all show a well-configured, smooth-running buffer pool. How can you tell if you should alter your buffer pool settings? There are several key symptoms that indicate a problem:
An Alternative to the Buffer PoolBefore leaving the subject of the InnoDB buffer pool, it's worth taking a moment to discuss one possible alternative to using InnoDB tables and their associated buffer pool: MEMORY tables. These types of tables (formerly known as HEAP) are discussed during Chapter 4, "Designing for Speed." Recall that they are extremely fast and based completely in memory. Although they have numerous restrictions and limitations that keep the number of potential replacement scenarios relatively low, one very useful situation in which you can substitute them for InnoDB tables is when you have large, static lookup tables that you want to be always present in memory. For example, suppose you are building an application that will rely on a very large, relatively unchanging table to provide lookup values. You are concerned that because of heavy system activity, it's likely that data from this table will frequently be pushed out of the buffer pool to make room for other information, thereby slowing the application. Under these circumstances, you could permanently store the underlying data in an InnoDB or MyISAM table, and then load a corresponding MEMORY table when your server boots, application starts, and so on. Your application clients would then look to this MEMORY table to find their lookup values. Assuming that there's sufficient memory to both store all data and index information in the MEMORY table and, thereby, avoid swapping or other resource contention, all necessary lookup data will be resident in memory. |
| < Day Day Up > |
EAN: 2147483647
Pages: 131