InnoDB Storage Architecture and IO
| < Day Day Up > |
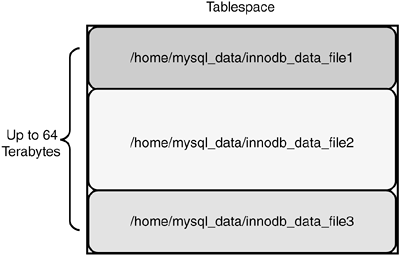
InnoDB Storage Architecture and I/OBefore you can improve InnoDB's I/O performance, it's worthwhile to spend a little time understanding the core data storage structures and some key data management technologies for this engine. Note that Chapter 13, "Improving Disk Speed," explores disk tuning for all MySQL storage engines in much more detail. To keep things as uncomplicated as possible, a number of internal InnoDB engine structures that are beyond the scope of this book are skipped here. In addition, for simplicity and clarity, we'll reprise our basic sample table from Chapter 7, "Indexing Strategies"; we periodically refer to this table as we explain how InnoDB stores information: CREATE TABLE sample_names ( id INT UNSIGNED PRIMARY KEY AUTO_INCREMENT, last_name CHAR(30) NOT NULL, age SMALLINT NOT NULL, INDEX (last_name) ) ENGINE = INNODB; IndexesIn addition to the general performance implications of your indexing strategy, InnoDB introduces an additional set of index capabilities. This section explores these InnoDB-specific features. Clustered IndexesTo begin, this section examines how rows from the preceding schema will be structured. As mentioned earlier in Chapter 7, InnoDB automatically creates at least one index per table: This index is known as the clustered index. InnoDB creates this index even if the database designer has not defined a primary key. In cases in which there is no primary key or other unique index, InnoDB automatically generates a unique, 6-byte value called the rowid. It's important to understand that the clustered index is the data; in a sense, the clustered index has double responsibility: first to store the data, and then to order it by the primary key, another unique value, or, as a last resort, the database-generated rowid. Secondary IndexesWhat about other indexes? How are they structured, and what is their relationship with the data found in the clustered index? These additional indexes are known as "secondary indexes," and you can create as many of them as you need for an InnoDB table. Because our sample table schema definition requests an index on the last_name column, InnoDB creates one secondary index on this value. Each entry in the secondary index contains the primary key value from the clustered index, thereby facilitating linkage back to the data. At this point, you've examined the lowest-level structures responsible for storing data and index information. The following section looks at the next-higher level of granularity: the page. PagesAll information (data, indexes, and internal structures) in InnoDB reside on pages, which are set to 16K by default. In MySQL version 5.0.3, rows are now stored in a more condensed format. Despite the 16K page size and more optimal row storage layout, this doesn't mean that InnoDB completely fills each page with information. Instead, depending on your data access patterns, InnoDB might try to fill a page to more than 90% of its capacity. However, some pages might end up only being 50% full. If the amount of information on the page drops below this threshold, InnoDB performs internal shuffling and rebalancing to consolidate pages. Note that all of this activity goes on unbeknownst to the administrator. Pages are then grouped into the next higher unit of organization: the extent. Extents and SegmentsAn extent is defined as a sequential grouping of 64 pages. Placing these pages in successive order generally helps performance. InnoDB then organizes extents into segments. TablespacesTablespaces are the biggest data storage structures managed by InnoDB. They contain one or more data files (which themselves are composed of segments). You can configure these data files to automatically expand (until you run out of disk space) as your database grows. InnoDB uses tablespaces to store both data and index information. One shared tablespace is created when InnoDB is enabled. You can also dedicate a tablespace to a single table. Transaction logs (which you explore a little later) reside in their own data files; they are not part of the tablespace. A tablespace consists of at least one to possibly many disk files, which can exist on different drives. As you can see from Figure 12.1, tablespaces can become enormous, and let you bypass the file size restrictions imposed by many operating systems. Figure 12.1 shows an example of a tablespace that is made up of three files. Figure 12.1. Tablespace comprised of three files.
Built-in Performance EnhancersBefore discussing how best to configure InnoDB, the following sections look at a few key performance-enhancing capabilities that require little or no intervention from administrators. Insert BufferInnoDB sets aside a small portion of its buffer pool to diminish the amount of costly disk operations for certain types of inserts. When you change information that affects a secondary index (provided that this index is permitted to have duplicate values), InnoDB first writes the alteration into this buffered memory. Afterward, these modifications are written en masse to disk, which is much more economical. Doublewrite BufferInnoDB employs the doublewrite buffer for two chief reasons. First, by initially writing data modifications into a special section of the tablespace, InnoDB reduces the risks of data loss should either the database or the server die unexpectedly. Paradoxically, these write delays can also minimize some expensive operating system disk costs by reducing the quantity of low-level I/O invocations. Read AheadAs your applications work with the database, InnoDB is continually monitoring utilization patterns. When it detects consistent sequential data read requests that are returning large blocks of information from a given table, InnoDB preemptively arranges to read additional information from this table into its buffer pool with the expectation that these rows will soon be needed. Although more randomized data access presents a challenge in determining where the next set of requests will occur, InnoDB still attempts to set up prestaged reads. VersioningRecall from both our earlier review of the InnoDB row structure and Chapter 7 that this storage engine maintains an internal field in each row (within the clustered index) to track those transactions in which the row is involved. Each row also holds a link (called the roll pointer) to a structure known as the rollback segment, which comes into play should you need to either abort the transaction or provide a point-in-time view of your data. InnoDB is responsible for maintaining the contents of the rollback segment, but administrators have a job to do as well. Without going into great detail, understand that an earlier view of data from a row might linger in the rollback segment's update undo log long after the underlying row has been changed or even deleted. How is this possible? Because InnoDB relies on the rollback segment's update undo log for consistency and recoverability, it is unwilling to discard this crucial information until the transaction is completed. After this event takes place, InnoDB is then free to permanently delete this safety mechanism from the undo log, via an activity known as purging. Here is yet another reason to keep your transactions as brief as possible; long-running transactions equal long-lived undo log contents. The danger here is that InnoDB will fall behind, leading to a bottleneck for database modification operations or excessive disk space consumption. Here's where administrators can help. The innodb_max_purge_lag setting lets you instruct InnoDB to employ an invisible (to users and their applications) yet very effective delaying tactic when processing new or existing rows when there is a backlog of purge chores to work through. Data StorageNow that you've examined these key InnoDB internal assemblies and algorithms, the following sections investigate how to configure, monitor, and tune data storage for the most advantageous performance. Configuring Data StorageIf you decide to use multiple tablespaces, InnoDB creates files with a suffix of '.ibd' to store their data, instead of using the shared tablespace. You can configure a ceiling for the number of open '.ibd' files by setting the innodb_open_files server variable, but the default value of 300 should suffice for most installations. In fact, you can even lower this parameter, with a minimum value of 10. Another server setting that can probably be left untouched at its default value of 4 is innodb_file_io_threads. This controls the number of threads spawned to support InnoDB's disk operations. The one exception to this rule is if you are running a Windows-based server. If so, you might try boosting its value to see if it improves disk performance. As always, remember to change your values in small increments, and test only one alteration at a time. As tables grow, it might become necessary for InnoDB to request additional space for the tablespace. If you have enabled and set values for the autoextend option in your configuration file, InnoDB attempts to increase the size of the last file in the tablespace. In Figure 12.1, this means that InnoDB tries to gain additional storage space in /home/mysql_data/innodb_data_file3. How much space does InnoDB request? This is determined by the innodb_autoextend_increment server setting, which defaults to 8MB. If you are running a very dynamic, rapidly growing MySQL instance, you might want to boost this value to reflect the lively character of your environment. Keep in mind, however, that reclaiming space from an expanded file can be done, but is neither easy nor automatic. Also, if you run out of room on your file system, you receive a message similar to the following: InnoDB: The database cannot continue operation because of lack of space. You must add a new data file to my.cnf and restart the database. After the extension, your tablespace now looks like Figure 12.2. Figure 12.2. Additional space added to the tablespace.
To get an idea of the internal file structure and status of your tablespaces, examine the output of the innodb_tablespace_monitor, which also tells you if there are any problems with the tablespace. You can configure this report to be regularly written to mysqld's standard output via the CREATE TABLE statement: CREATE TABLE innodb_tablespace_monitor (anyname INT) ENGINE = INNODB; Here is some sample output: ================================================ 060610 11:35:54 INNODB TABLESPACE MONITOR OUTPUT ================================================ FILE SPACE INFO: id 0 size 110720, free limit 109248, free extents 2 not full frag extents 2: used pages 49, full frag extents 15 first seg id not used 0 3051 SEGMENT id 0 1 space 0; page 2; res 1178 used 1030; full ext 15 fragm pages 26; free extents 0; not full extents 3: pages 44 SEGMENT id 0 2 space 0; page 2; res 1 used 1; full ext 0 fragm pages 1; free extents 0; not full extents 0: pages 0 SEGMENT id 0 3 space 0; page 2; res 1 used 1; full ext 0 fragm pages 1; free extents 0; not full extents 0: pages 0 . . . . . . SEGMENT id 0 15 space 0; page 2; res 160 used 160; full ext 2 fragm pages 32; free extents 0; not full extents 0: pages 0 SEGMENT id 0 3030 space 0; page 2; res 992 used 987; full ext 14 fragm pages 32; free extents 0; not full extents 1: pages 59 SEGMENT id 0 17 space 0; page 2; res 1 used 1; full ext 0 fragm pages 1; free extents 0; not full extents 0: pages 0 . . . . . . SEGMENT id 0 29 space 0; page 2; res 7264 used 7241; full ext 112 fragm pages 32; free extents 0; not full extents 1: pages 41 SEGMENT id 0 2902 space 0; page 2; res 1 used 1; full ext 0 fragm pages 1; free extents 0; not full extents 0: pages 0 . . . . . . NUMBER of file segments: 89 Validating tablespace Validation ok --------------------------------------- END OF INNODB TABLESPACE MONITOR OUTPUT Monitoring and Tuning Data StorageIn addition to the data file space management information listed previously, with version 5.0.2, MySQL AB now offers extensive, easily accessed status variables that give valuable insight into activity in our data files. To highlight these new diagnostics, you can create a custom MySQL Administrator page that logically presents this information, as shown in Figure 12.3. Figure 12.3. Custom MySQL Administrator graph highlighting new status variables.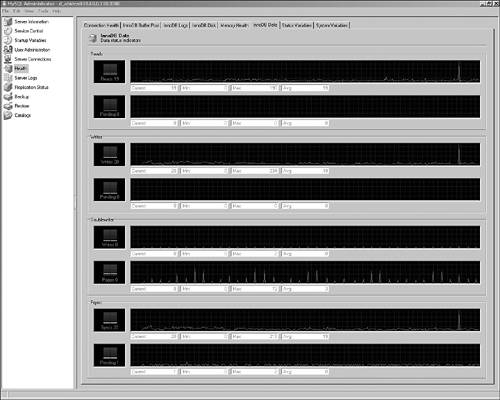 What do all of these graphs track? From top to bottom, they include the following:
An alternative to the MySQL Administrator is to run SHOW INNODB STATUS and locate the sections that describe disk activity: ---------- SEMAPHORES ---------- OS WAIT ARRAY INFO: reservation count 8568, signal count 5752 --Thread 2122673072 has waited at ../include/btr0btr.ic line 28 for 1.00 seconds the Chapter 13 considers numerous ways to improve overall disk performance. Log FilesLog files are an essential building block of InnoDB's transaction support. These components facilitate several vital capabilities, including the following:
Don't confuse these logs with the error, binary, or slow logs; instead, they are dedicated to helping the InnoDB storage engine provide a safe, consistent way to manage transactions. Log File ConfigurationAs an administrator, you have several decisions to make about your InnoDB log file configuration. First, you should decide how many log files you want to employ. The default and minimum is two. If you want to initiate more log files, alter the innodb_log_files_in_group server setting. After deciding how many log files you will create, the next step is to settle on how much space you want to allocate to each of your log files via the innodb_log_file_size setting. MySQL ships with this value set to 5MB, which is fine for relatively small databases. However, enterprise-class production databases require much bigger logs. With that said, how can you determine the correct value? Smaller log files mean that MySQL frequently runs out of log space and often needs to run expensive checkpoints between the memory-based buffer pool and the disk-based log files. On the other hand, these compact log files translate into faster recovery because there are simply fewer transactions in them to work through upon startup. However, given that crash recovery should be an infrequent event, it makes more sense from a performance viewpoint to make the log files large. In fact, you could set the aggregate group of log files equal to the size of the buffer pool. In this case, slow-running checkpoints are rare, but crash recovery takes a long time. For situations in which you have massive amounts of data to load and are very unconcerned about recovery, you might make these logs even larger. Now that you've decided how many logs you want, along with how much space you are willing to allocate for them, the next step is to determine the size of the memory-based log buffer, which is represented by the innodb_log_buffer_size parameter. Ranging between 1MB and 8MB, it caches transactional information prior to its inscription in the disk-based log. Making the value larger means that InnoDB needs to perform fewer costly writes to the log. However, imagine the impact of a sudden, unplanned system failure to any memory-based, unwritten information still in the buffer. With that said, if your environment features sufficient memory and is not particularly failure-prone, it's a good idea to make this value as large as you can. Finally, you have one more decision to make about your log buffer and files: What behavior should they follow when a COMMIT is issued? The innodb_flush_log_at_trx_commit setting offers the following alternatives:
Log File Monitoring and TuningAfter sizing and configuring your logs, how can you determine if they are working optimally? As you saw earlier, beginning with version 5.0.2, MySQL AB has introduced numerous server status variables that make it much easier for administrators to gather the necessary statistics to make informed decisions about all aspects of their InnoDB environment, including the status of their logs. Using the MySQL Administrator, you can create a graph that pays particular attention to log file activity, as shown in Figure 12.4. Figure 12.4. Monitoring InnoDB logs via the MySQL Administrator.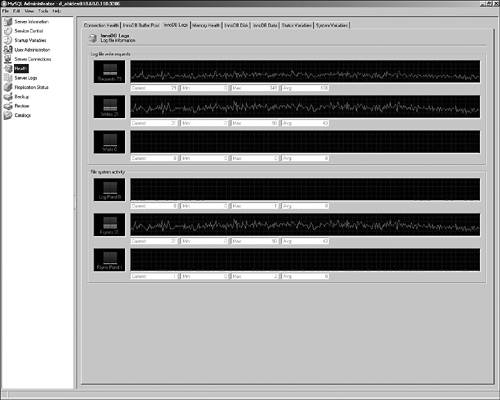 What can we learn from these graphs? From top to bottom, they include the following:
Based on these indicators, this appears to be a well-running InnoDB installation, at least from the perspective of logging. You can also use SHOW INNODB STATUS to get an idea of your log activity: --- LOG --- Log sequence number 3 3165436224 Log flushed up to 3 3165435546 Last checkpoint at 3 3163280023 1 pending log writes, 0 pending chkp writes 9917 log i/o's done, 5000.00 log i/o's/second ---------------------- |

| < Day Day Up > |
EAN: 2147483647
Pages: 131