Creating a Report Using the Report Wizard
| Whew! If you've built all of rptAdministration from scratch, you can see why even Access pros like to use the Report Wizard, at least to get a running headstart. The wizard can create the same report (or one very similar to it) that took much work by hand, with just a few clicks of the mouse. But because our purpose is pedagogical, we'll go slowly through it and take a few detours so you can understand how the wizard works and what it offers. Collecting DataBecause the Report Wizard works so seamlessly, it's difficult to see that you're accomplishing essentially two different tasks. First, you create a query; second, using the query as a record source, you build a report. So let's begin to unveil the wizard's workings by taking a look at the Simple Query Wizard. This tool can be used to create single-table or multitable queries. I haven't talked about it much because it's a training-wheels tool that doesn't train you, and it won't save you much time in query making. But it's useful for understanding what the Report Wizard is up to. In the Asia database, click the Queries button in the Database window. Double-click Create Query By Using Wizard. Open the Tables/Queries drop-down list. In this dialog box, you can choose fields from any tables or query to include in your query. Click Cancel. Click the Reports button in the Database window, and double-click Create Report By Using the Wizard. Hmm, look familiar? The point is that, however you create a report, you start by gathering data. Usually, that means creating a query. If you don't currently have a query for your report, you can use the wizard to assemble your data from different tables. Assemble Your DataYou want a report with the same information as the one you built from scratch, so you could just select the query you created earlier in the chapter. But let's start from scratch and get the data you need from the various tables.
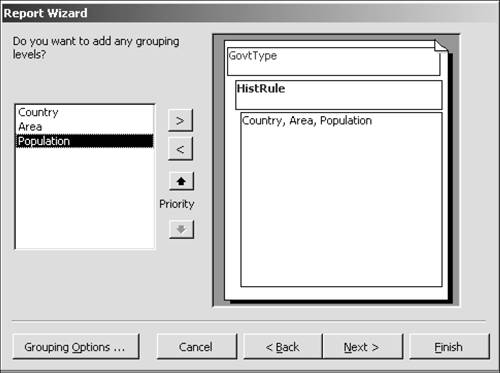
Create the GroupsIn this dialog box, Access selects a group for you, depending on the relationships in the underlying tables. Because you can customize groups the way you want them in the next dialog box, you can ignore this dialog box and click Next. The main group you want is government type. Select GovtType in the available fields and click >. A hierarchy is set up with GovtType at the top level and all other fields at a second level. Nesting GroupsIn the report you created in Design view, there was just one grouping level: government type. But you can also nest groupsyou can have groups within groups within groups. Why would you want to do that? Let's say you work for an international consumer company, and you're creating a sales report for the vice president of sales. He wants to see a breakdown of sales by country, and within each country by region, and within each region by sales rep. In this case, you would create three groups. The top level would be country data. Nested within the country group would be regional data. And nested within the region would be sales rep data. TIP You'll want to limit the number of groups in your report, especially for readers who are unfamiliar with the data. Reports that have groups within groups ad infinitum can be confusing and can leave readers baffled about the overall flow of the report. The vice president of sales, however, is not likely to have problems understanding a breakdown with three or even more groups. You can nest groups within the Asia database as well. Suppose that within each government group you want to add another level for the historical rule. In that case, you'd have the first groupsay, Communistand within the group, there would be additional groups for each historical rule (British, French, and so on). Then you'd have the second group, Constitutional Monarchy, and within this group, there would again be groups for each historical rule. (I included in your solution database AsiaChap10End.mdb an example of such a report. Its title is rptAdministrationTwoGroups, and you can view it at your leisure.)
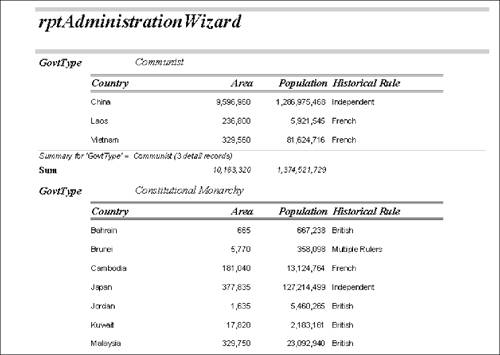
Sort the RecordsWithin each group, you can choose additional field sorts. Within each government type group, let's sort the records by country. Open the drop-down list and select Country. Use an ascending sort to keep them alphabetized. (You can change the sort to descending by merely clicking Ascending.)
Summary OptionsThe wizard can add aggregate totals for you, for both the group and the entire report.
LayoutThe dialog box for choosing a layout isn't terribly helpful, to say the least. Both the names and the graphical schemes are imprecise, and some are more confusing than anything else. If reports are central to your work, you'll want to try a few different layouts and see how they look. You might want to create a few reports using different schemes to see what they actually look like.
Style and TitleThe style choice is your own. Only Casual is unsuitable for business purposes (and even that's questionable).
|
EAN: 2147483647
Pages: 169