| In certain respects, the Report Header/Footer is similar to the Page Header/Footer. Most notably, a single commandReport Header/Footer on the View menutoggles between hiding and unhiding both header and footer. As with the Page Header/Footer, either section can easily be eliminated by adjusting its height to 0 inches. Unlike a page footer or header, however, a report header or footer appears only once: at the beginning and end of the report, respectively. The report header can be used for a title, the publishing entity, the date, and (perhaps) an introduction. The footer that closes the report is primarily used for summary information, such as the total of all values of particular fields. Adding a Title to the Report Header A Report Header often creates a cover pagethat is, a full, standalone page 1. The case example at the end of the chapter builds such a page. Right now, let's just create a short title at the top of page 1. 1. | In Design view of rptAdministration, choose View Report Header/Footer.
| 2. | In the toolbox, click the Label button (refer ahead to Figure 10.7 for its location; if your toolbox isn't visible, choose View, Toolbox). Drag the crosshairs pointer to the Report Header section and click anywhere inside it.
Figure 10.7. The report with a label control for the title. 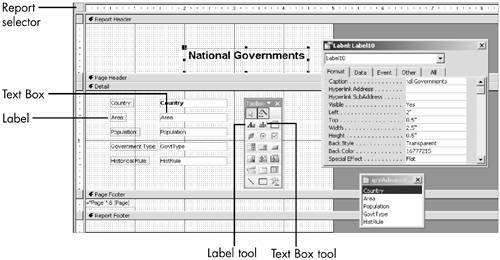
| 3. | Type National Governments and click outside the box.
| 4. | Click the label to select it and press F4 to open its property sheet.
| 5. | On the Format tab, scroll down to Font Size and edit the setting to 16. Edit the Font Weight to Bold and Text Align to Center.
| 6. | Move your mouse to the upper-right handle of the label and click when the pointer becomes a double-arrow (see Figure 10.6). The text of the label is in full view.
Figure 10.6. When you click the double arrow, the control resizes so the label is in full view. 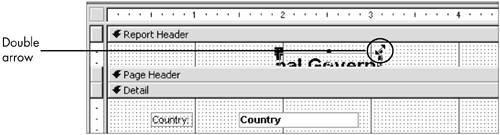
| 7. | On the Format tab, edit the Width slightly to 2.5". Edit Left to 2", Top to 0.5" and Height to 0.5" Your Report Header should look like Figure 10.7.
| 8. | Close the property sheet.
| 9. | Click View to see the report.
|
Printout Problems It's little use designing great-looking reports if they don't print on paper correctly. Let me deal with two common problems. HOW DO I CENTER A TITLE ON THE PAGE? Create the title and make font selections first so you know how wide the label will be. In the example, the label is 2.5 inches wide. (I had you edit the width slightly so it was a round number and, hence, easier to work with.) I'll assume you're working with letter-size paper and Portrait orientation, so the width is 8.5 inches. (Portrait versus Landscape orientation is discussed briefly in the "Layout" subsection of the section "Creating a Report Using the Report Wizard," near the end of the chapter.) The page is 8.5 inches wide and the label takes up 2.5 inches, so you have 6 inches (8.5 inches 2.5 inches) of empty space. You want half of 6 inches to be on both the left and right of the label, which is 3 inches on each side. Choose File, Page Setup. On the Margins tab, you can see that the default margins for Access are 1 inch on the left and 1 inch on the right. So the margin will take 1 inch of that 3 inches of empty space. Thus, the Left property for the label (where the label begins) should be 3 inches 1 inch, or 2 inches. EVERY SECOND PAGE OUT OF MY PRINTER IS BLANK! The problem here is that your report or margins are too wide. To print your report correctly, the following equation must be true: Report width + left margin + right margin <= paper size I've just covered margins and paper size. The report width is the actual width of the report, not the width of the printed text. For example, in Figure 10.7, look at the horizontal ruler and note that the report width is 5 inches, even though the right border of the rightmost control (the title) is at 4.5 inches. (The report width can also be found on its property sheet. Double-click the report selectorsee Figure 10.7 for its locationand click the Format tab to view the Width property.) Assume that the report width is 7 inches and margins are 1 inch on both sides. The equation becomes: 7 inches (report width) + 1 inch (left margin) + 1 inch (right margin) = 9 inches. That's greater than the paper size of 8.5 inches, so you have a problem. Often the best solution is to reduce the width of the report. If the right border of the rightmost control is at 4.5 inches, the report width need not be 7 inches. If you made the report width 5 inches, your equation becomes a satisfactory 5 inches + 1 inch +1 inch <= 8.5 inches. Similarly, you could make the margins slightly smaller. |
NOTE You've been using property sheets to edit the various parts of a report. It's often easier to use your mouse to move, resize, and format sections, controls, and other report elements. You'll get some practice doing that in the following section.
Adding Totals in the Report Footer Now let's use the Report Footer. Suppose you'd like a grand total for the area of all Asian countries. Here's how to create the control and calculated expression that will give you this number: 1. | Move your mouse to the bottom of the Report Footer section. When the pointer becomes a double arrow with a bar, drag it to the 1-inch mark on the vertical ruler.
You could have also right-clicked the Report Footer bar, chosen Properties, and set the Height property on the Format tab at 1".
| 2. | In the toolbox, click the Text Box tool (see Figure 10.7).
| 3. | Drag the pointer to the Report Footer section and position the crosshairs 1 inch from the left and 0.5 inch from the top. Click your mouse.
| 4. | Select the label, the box on the left. Move your pointer to the middle selector handle on the right border (see Figure 10.8). When the pointer becomes a double arrow, drag it to the .75-inch mark on the horizontal ruler.
Figure 10.8. The selected label, with sizing handle and double arrow. 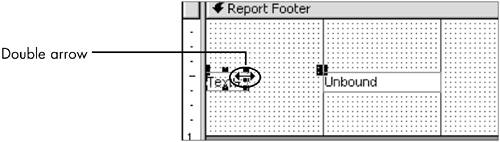
| 5. | Click inside the label. Delete the existing text. Type Total Area and press Enter. Click the Bold button on the Formatting toolbar.
| 6. | Select the text box and click inside it. Enter an expression as follows:
Type = to tell Access you want an expression. Type Sum, the function that calculates a total. Type ([Area]), the field enclosed in brackets and parentheses. The entire expression is =Sum([Area]). Press Enter.
| 7. | Press F4 to open the property sheet for the text box. On the Format tab, edit the Format property to Standard and Decimal Places to 0.
| 8. | Close the property sheet. Click View to switch to Print Preview, and click the Last Page button (refer to Figure 10.4 to refresh your memory of its location). The total area is displayed at the bottom of the page.
|
When you know how to create a control for the total area, it's simple to add one for the population: 1. | Click View to return to Design view. The total area control should still be selected.
| 2. | Choose Edit, Duplicate. A copy of the text box and label appears directly below the existing controls.
| 3. | Move your pointer toward the text box. When the pointer becomes an open hand, drag the duplicate text box 0.5 inch from the top and 4 inches from the left.
If you don't know how to move controls, the section "Manipulating Controls" in Chapter 12, "Forms/Report Design Elements," will help you.
| 4. | Select the label. Click inside it, highlight Area, and edit it to Population. Click outside the control.
| 5. | Select the text box. Within the expression, highlight Area and edit it to Population. Click outside the control. Your report footer should look like Figure 10.9.
Figure 10.9. Controls for summing population and area in the Design view of the report. 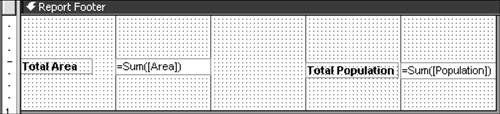
| 6. | Choose File, Save (or click the Save button).
It's a good idea to save your report periodically if you've done significant work on it.
| 7. | Click View, click the Last Page button, and scroll to the bottom of the page. The Total Population control has been added.
|
Sorting and Grouping Thus far, you might have found creating a report tedious, but you probably haven't found it difficult. To quickly review, you've used: The Detail section, the body of the report, to display your records. The Page Footer to print a page number. You could have as easily used the Page Header, which prints the page number at the top of each page. The Report Header, which prints once at the top of the report, for the title. The Report Footer, which prints once at the end of the report, for aggregate totals.
With the introduction of grouping, you might find that things become a little more difficult. The concept itself is not hard to get, but the nuts and bolts of making grouping work can be confusing. I first want to make sure you understand grouping; then I go step by step through the process of implementing it. Political Magazine Database Before adding grouping to the National Governments report, it will be easier to see how it works in a database with just a few records. I use the PoliticalMagazines.mdb database, which is available from the usual webpage. You do not need to open it to review this section, but it's there if you need it. The Political Magazines table (see Figure 10.10) has data about several small, imaginary journals of opinion. The Politics field shows its political slant: whether it is more likely to be read by wooly-headed internationalists (left) or warmongering unilateralists (right). The Location field shows where the editorial staff is headquartered; the estimated circulation is self-explanatory. Figure 10.10. Table of political magazine data. 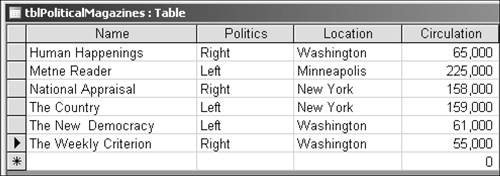
The records are currently sorted in the datasheet by name. In Figure 10.11, these same records are displayed in a report where they are grouped by their political bent and, within the group, sorted by name. Both the group and the sort are in ascending order (they're alphabetized): Left precedes right, and within the left group, Metne Reader precedes The Country. Figure 10.11. Magazine data grouped by political tendency. 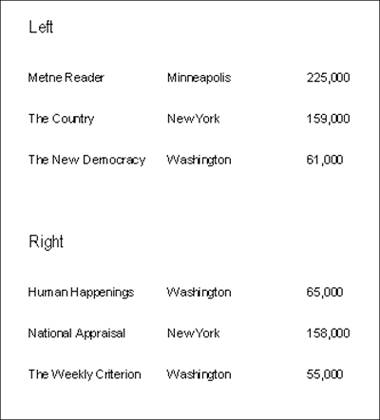
As you can see, grouping eliminates the need to repeat the values of Left and Right for each record. As readers, you can quickly organize and distinguish the magazines that are on the left from those on the right. Another powerful advantage of grouping is that, just as you created summary statistics for the entire report, you can add summary statistics for each group. Figure 10.12 shows the same report with the average circulation for each group. (I used the Report Wizard to make it look a bit more professional.) Figure 10.12. Grouped magazine data with aggregate totals. 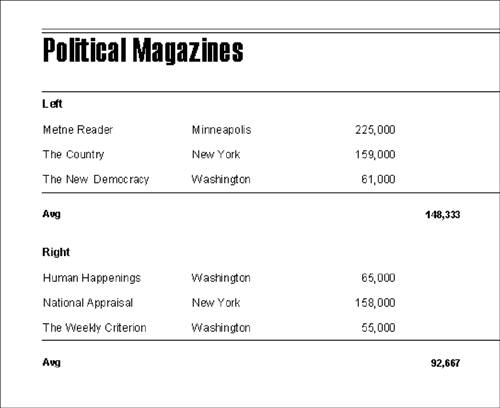
Sorting and Grouping Dialog Box Now let's create a group in the rptAdministration report. Despite its name, thus far the primacy of government-type data is not obvious in the report. Just as you grouped records by political tendency in the Political Magazines table, you can group records in the report to spotlight the country's form of government. You create groups in the report's Sorting and Grouping dialog box. First, let's change the current sort of CountryID (the sort in the original query) to government type: 1. | Choose View, Sorting and Grouping.
You can also click the Sorting and Grouping icon, which is shown in Figure 10.13.
Figure 10.13. The Administration report in Design view. The GovtType field has been edited in the Sorting and Grouping window so that there is now a GovtType header and GovtType footer. 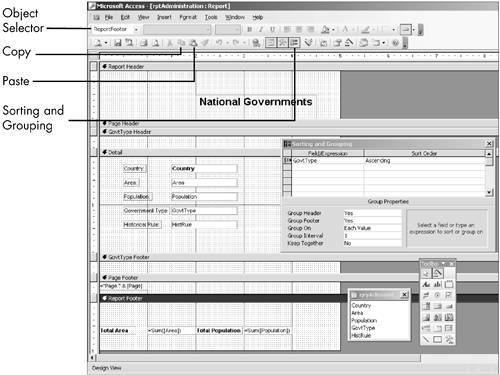
| 2. | In the Field/Expression column, open the drop-down list and choose GovtType.
| 3. | In the Sort Order column, keep Ascending to sort alphabetically.
| 4. | Close the dialog box. Click View and scroll through your records. The records are now sorted in ascending order (alphabetically) by government type: communist, constitutional monarchy, dictatorship, and so on.
Now you'll create the group:
| 5. | Click View to return to Design view. Click View, Sorting and Grouping. Click in the first row.
| 6. | In the Group Properties section, edit Group Header to Yes and press Enter.
The Sorting and Grouping Indicator now displays the grouping symbol in the first row, next to GovtType. You can see that a GovtType header has been created above the Detail section.
| 7. | Edit Group Footer to Yes and press Enter (see Figure 10.13).
The GovtType footer is now below the Detail section.
| 8. | Close the dialog box. Choose File, Save to save your changes.
|
Q&A | Q1: | Okay, I can see that I somehow created a group in the dialog box. But I still can't figure out exactly which step did that. How can changing a property of some Access element create the element itself? | | A1: | Your instincts are correct: You usually create, say, a field or control first and then assign properties to it. Grouping is different. When you select a field in the Field/Expression column, the mere act of editing either its Group Header or its Group Footer property to Yes changes the sort to a group and produces sections for that group in Design view of the report. |
|
Click View and scroll through the first few pages of the report. Hmm, what's going on? The grouped report seems to be the same as the report without grouping, except that there's a little more empty space in it. Where are the group titles for each government type, such as those you saw for the Left and Right groups in Figure 10.11? Where are the aggregate statistics, such as Sum, for each group, as you saw in Figure 10.12? Click View to return to Design view and scroll down the page. Take another look at the group sections. Yes, there is a GovtType header (a group header) above the Detail section, and, yes, there is a GovtType footer (a group footer) below it. But they're emptythere aren't any controls in them. Here's the nasty little secret about creating groups in the Sorting and Grouping dialog box. It's like building an aquarium. When you create the group in the Sorting and Grouping dialog box, all you've done is buy a tank. You have got to put water, fish, and a plastic gazebo or two into it to make it into an aquarium. Ignoring the fishy metaphors, you must create the controlslabels, text boxesto make the groups meaningful and informative. Group Header Fortunately, adding the controls is not hard. Because you now have a government type group, you don't need the GovtType field in the Detail section. You want to identify each group by government type, so you can use the same field in the group header section. Here are the steps: 1. | In the Detail section, select the Government Type label and delete it.
| 2. | Right-click the GovtType Header bar and select Properties. On the Format tab, edit the Height to 0.4".
| 3. | Select the GovtType text box. Drag it to the GovtType Header section and drop it 0.5 inch from the left and two rows of dots from the top.
|
Are you having trouble moving the text box into the Header section? When you move the pointer to the top of the text box, make sure it changes to an open hand, not the pointing finger. If you still have trouble, here's an alternative method: Cut the text box, select the group section header bar, paste it, and then position it within the section. 1. | On the Format tab of the Text Box: GovtType property sheet, edit the Width to 2", the Height to 0.2", and the Font Size to 12. Close the property sheet.
| 2. | In the Detail section, select all four text boxes. Choose Format, Vertical Spacing, Make Equal.
| 3. | Right-click the Detail section bar, select Properties, and edit the Height of the Detail section to 2" (see Figure 10.14). Close the property sheet.
Figure 10.14. The Group Header and Detail sections in Design view. 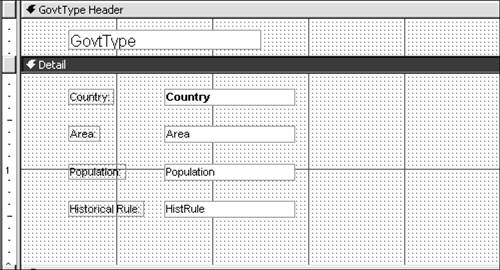
|
Q&A | Q1: | These exercises are tiresome and tedious. Do you really think it's worth my time to go through all these steps for a report I will never want to create? | | A1: | It's true that you're unlikely to have this exact set of controls and circumstances. But what you are doing herechanging fonts, resizing labels, moving text boxesinvolves typical tasks for editing reports. You'll be able to build on this knowledge base for the design challenges you face. |
|
Group Footer A great advantage of grouping is including summary statistics for each group. These are usually created in the Group Footer. You've already included summary statistics for the area and population fields in the Report Footer. A little cutting and pasting and some editing will give you the same aggregates for these fields by group: 1. | Move your pointer to the 0.5-inch mark of the vertical ruler in the Report Footer section. When the pointer becomes a right arrow, click to select all four controls (see Figure 10.15).
Figure 10.15. When the pointer is a right arrow, you can click to select all four controls. 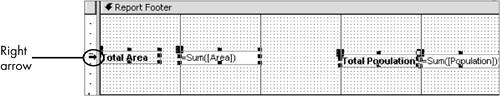
| 2. | Right-click any of the selected controls for a shortcut menu and choose Copy.
You can use any Copy methodchoose Edit, Copy; click the Copy button; or press Ctrl+C.
| 3. | Right-click the GovtType Footer and click Paste.
| 4. | Click anywhere outside any control so that no control or element is selected.
| 5. | Right-click the Total Area label and choose Properties. On the Format tab, edit the Caption to Group Area.
| 6. | Click the Total Population label to select it. On the Format tab of the property sheet, edit the Caption to Group Population. Close the property sheet.
| 7. | Choose File, Save to save your changes. Click View to see the report.
|
One thing immediately strikes the eye: Within each group (such as Communist), the country names are not alphabetized. Let's alphabetize them. 1. | Click View to return to Design view.
| 2. | Choose View, Sorting and Grouping.
| 3. | Click in the first empty row of the Field/Expression column. Open the drop-down list and choose Country. In the Sort Order column, leave Ascending as is. Close the dialog box.
| 4. | Click View to see the report (see Figure 10.16).
Figure 10.16. The report with a group header in Print Preview. 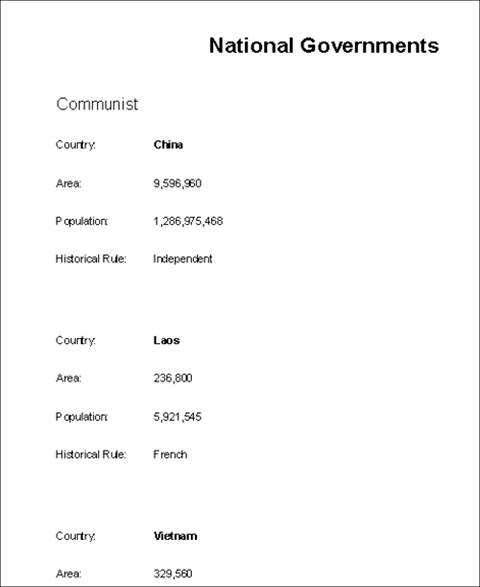
|
Now let's take a closer look at the report. At the end of the group, there are now group totals for area and population. The same expressions that calculated total area and population for all of Asia when they were used in the report footer section now calculate the group totals when used in the group footer section. As for the rest of report, it's adequate, but it could be better. Forcing new pages before each group would give you an improved layout. You can also have the group's name appear again at the top of the next page when the group's records span more than one page. You'll do those tasks in the case study at the end of the chapter. Close the report and save your changes. You can open the completed rptAdministration in AsiaChap10End.mdb and compare your own work with it. |