Monitoring, Managing, and Troubleshooting Server Health
| < Day Day Up > |
| The key to having a successful Exchange Server organization is to keep it running smoothly. To do that, you must learn to keep a watchful eye on your Exchange servers, ensuring that problems don't occur and if they should occur, ensuring that the required actions are carried out as quickly as possible. Several tools within Exchange Server 2003 and Windows Server 2003 are available and should be part of your monitoring tool bag. They include
We briefly examine each of these tools in the following sections. Using Event ViewerThe Event Viewer should always be your first stop for both routine and nonroutine checkups on your servers because it offers a concise and fairly easy-to-read historical view of what has occurred on a server. By default, three logs are provided in the Event Viewer on all servers:
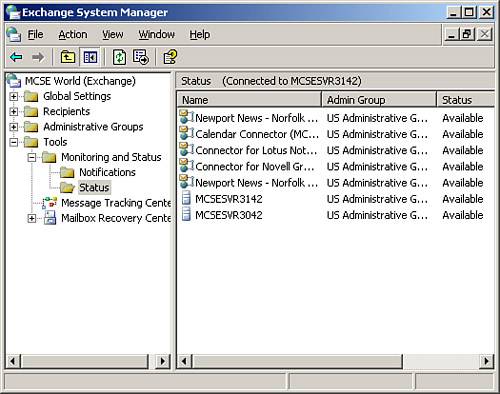
Your servers might have additional logs, such as the DNS log, depending on their role in the network. Within each log is recorded events of varying types, depending on the information being recorded. Information events are fairly routine and provide information about actions occurring successfully, such as the successful startup of a service. Warning events indicate future problems that require further investigation. Error events indicate that a significant problem has occurred on the system, such as the failure to start a required service. You need to investigate and correct Error events immediately upon their discovery. You can see all three event types in Figure 8.7. Note that the security log does not use these event types, but instead uses Success and Failure events. Figure 8.7. The Event Viewer should always be your first stop when performing monitoring on your servers.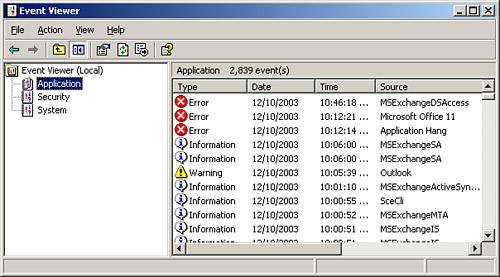 Using Exchange Server MonitorsExchange Server 2003 creates, by default during its installation, monitors that are used to monitor servers and connectors. As you might guess, server monitors are used to monitor the status of specified services and usage of resources on servers. Connection status monitors are used to monitor the status of a connector object between servers. The Exchange monitors are located in the Tools, Monitoring and Status, Status folder of the Exchange System Manager, as shown in Figure 8.8. Figure 8.8. The Exchange monitors can be used to get real-time information about the status of critical services and resources.
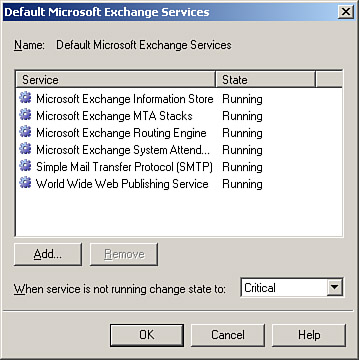
By default, several key services are monitored on each Exchange server, as shown in Figure 8.9. To access this dialog box, you simply double-click on the desired server, select the Default Microsoft Exchange Services item, and click the Details button. Figure 8.9. By default, key Exchange services are being monitored.
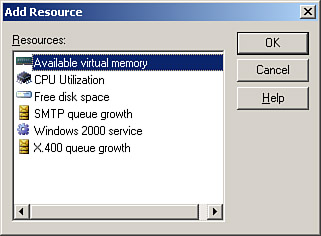
You can add additional items to be monitored by returning to the server monitoring Properties dialog box and clicking the Add button to open the Add Resource dialog box, as shown in Figure 8.10. Note the six different categories of resources that you can monitor we discuss each of them briefly in turn. Figure 8.10. You can create additional monitors if desired.
Available Virtual MemoryExchange is very memory intensive this should come as no surprise to any experienced Exchange administrator. Exchange Server 2003 requires a minimum of 256MB of RAM and has a recommended value of 512MB, although in larger organizations you might have 1GB of RAM or more installed in your servers. To keep an eye on how your servers are performing in regard to using memory effectively, you might want to consider monitoring the available virtual memory on the server. When it dips too low for an extended period of time, you have a situation that warrants further investigation. CPU UtilizationIn addition to RAM, Exchange needs a lot of CPU cycles to accomplish its assigned tasks. By monitoring the CPU utilization of your Exchange servers, you can help identify those servers that have too many services running or do not have enough processing power currently. This information can be used to justify the need for additional servers for off-loading of Exchange (or other) services or perhaps the addition of another or more powerful processor into the server. Free Disk SpaceOne thing that all databases have in common is that they require large amounts of disk space to be available for the database itself as well as the various logs that go along with the database. Exchange is no different in this regard adequate disk space is a must for both Exchange and Windows to operate smoothly. You can configure monitoring on a per volume basis to keep you informed of when one or more of your server's drives are becoming dangerously full.
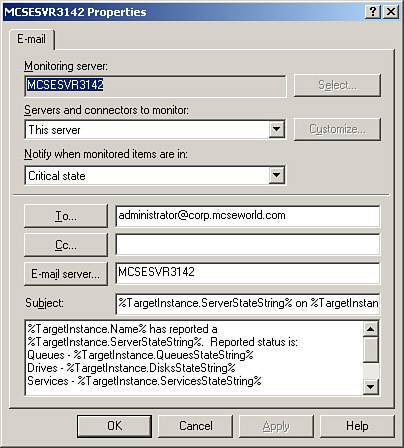
Windows 2000 ServiceDon't let the name mislead you; this category is used to monitor Windows services on Windows 2000 Server or Windows Server 2003 computers. Any service that is installed and operational on the server can be monitored here, such as a service for a third-party add-in to Exchange that is considered to be a part of your critical Exchange infrastructure. SMTP and X.400 Queue GrowthMonitoring of queue growth, particularly of SMTP queue growth, can be quite useful in keeping a watchful eye out for abnormal messaging situations. For example, suppose that you've somehow been exposed as an open SMTP relay. You might notice a large increase in your queue growth without a corresponding increase in the number of messages actually being delivered due to spam being delivered through your open relay. Another situation you might encounter is a script-based email worm that replicates itself through email messages; this might also create a large increase in your queue growth. Lastly, monitoring of the queue growth is helpful in situations in which outgoing messages cannot be transported out of the Exchange organization for one reason or another indicating a possible problem with your Internet connectivity. Creating NotificationsAs useful as server (and connection) monitoring is, it really doesn't do you any good unless you configure notifications to occur when the monitors reach a warning or critical state. You can create one of two types of notifications: those that send email messages or those that run a script. Email notifications are pretty straightforward and do just what you'd expect they would. Script notifications can get a bit more complex and are really only limited by your needs, your scripting capabilities, and your imagination. Notifications are located in the Notifications folder shown previously in Figure 8.8. To create a new notification, right-click on the folder and select New, E-mail Notification or New, Script Notification depending on your needs. The email notification configuration is shown in Figure 8.11. You need to select the server to perform the monitoring, the item(s) to be monitored, the state at which to send the email, the addresses to send the email to, and the server that is to be used to send the email. Figure 8.11. You should create email notifications for all of your servers as soon as possible after installation.
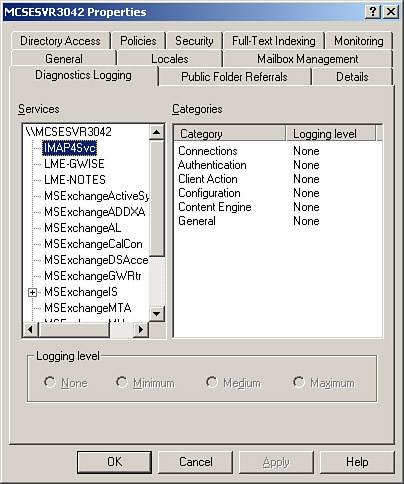
Using Exchange Diagnostics LoggingUsing the Exchange diagnostics logging allows you to perform very deep monitoring of all Exchange services, with the output being written to the application log of the Event Viewer. The diagnostics logging options can be configured on the Diagnostics Logging tab of the server Properties dialog box, as shown in Figure 8.12. Figure 8.12. You can configure diagnostics logging to gather extremely detailed information about your Exchange servers.
By default, all categories are configured for a logging level of None. To configure diagnostic logging, select the high level category you are interested in logging and then configure logging for the appropriate categories under that service. There are four levels of logging available:
The logging levels are configured by the developers of the application and cannot be modified after the fact. Be wary of using Medium and Maximum logging for a large number of categories or for a large period of time as they can quickly lead to the application log being flooded with event entries, masking otherwise important lower-level events that you might need to see to successfully troubleshoot a server problem.
Using System MonitorThe last of the four basic monitoring tools that you have is the Windows System Monitor, located in the Performance console of the Administrative Tools folder. When performing performance monitoring, we are usually interested in collecting information about four general items (or problem areas):
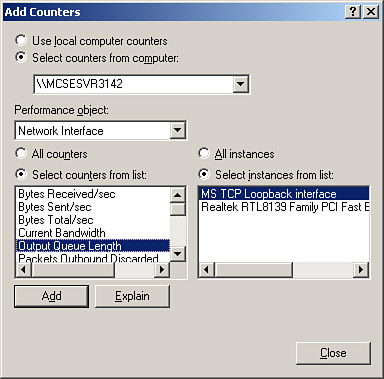
Monitoring performance begins with the collection of data. The System Monitor allows you various methods of working with data, although all methods use the same means of collecting data. Data collected by the System Monitor is broken down into objects, counters, and instances. An object is the software or device being monitored, such as memory or processor. A counter is a specific statistic for an object. Memory has a counter called Available Bytes, and a processor has a counter called % Processor Time. An instance is the specific occurrence of an object you are watching; in a multiprocessor server with two processors, you will have three instances: 0, 1, and _Total. The primary difference between using the System Monitor and counter logs/trace logs is that you typically watch performance in real time in System Monitor (or play back saved logs), whereas you use counter logs and trace logs to record data for later analysis. Alerts function in real time by providing you with (you guessed it) an alert when a user-defined threshold is exceeded, much the same as with the Exchange server monitors. The basic use of the System Monitor is straightforward. You decide which object/instance/counter combinations you want to display and then configure the monitor accordingly. At that point, information begins to appear. You can also change the properties of the monitor to display information in different ways. Figure 8.13 shows a typical Add Counters dialog box. At the top of the dialog box is a set of radio buttons with which you can obtain statistics from the local machine or a remote machine. This is useful when you want to monitor a computer in a location that is not within reasonable physical distance from you. Under the radio buttons is a pull-down menu naming the performance objects that can be monitored. Which performance objects are available depends on the features (and applications) you have installed on your server. Also, some counters come with specific applications. These performance counters enable you to monitor statistics relating to that application from the Performance Monitor. Figure 8.13. Adding a counter in the Add Counters dialog box.
When you first start the System Monitor, you might want to add the counters discussed later in this section from the memory, processor, hard disk, and network objects; however, you can add any combination of counters that you find helpful in tuning and monitoring your computers. Under the Performance object is a list of counters. When applied to a specific instance of an object, counters are what you are really after, and the object just narrows down your search. The counters are the actual statistical information you want to monitor. Each object has its own set of counters from which you can choose. Counters enable you to move from the abstract concept of an object to the concrete events that reflect that object's activity. For example, if you choose to monitor the processor, you can watch for the average processor time and how much time the processor spent doing nonidle activity. In addition, you can watch for %user time (time spent executing user application processes) versus %privileged time (time spent executing system processes). To the right of the counter list is the instances list. If applicable, instances enumerate the physical objects that fall under the specific object class you have chosen. In some cases, the instances list is not applicable. For example, there is no instances list with memory. In cases in which the instances list is applicable, you might see multiple instance variables. One variable represents the average of all the instances, and the rest of the variables represent the values for the first physical object (number 0, 1, and so on). For example, if you have two processors in your server, you will see (and be able to choose from) three instance variables: _Total, 0, and 1. This enables you to watch each processor individually and to watch them as a collective unit.
Using System Monitor to Discover BottlenecksEvery chain, regardless of its strength, has its weakest link. When pulled hard enough, some point will give before all the others. Your server is similar to a chain. When it's under stress, some component will not be able to keep up with the others. This results in a degradation of overall performance. The weak link in the server is referred to as a bottleneck because it's the component that slows everything else down. As an administrator responsible for ensuring efficient operation of your Windows 2000 server, you need to determine the following two things:
As mentioned previously, under normal operation, only four system components greatly affect system performance: memory, processor, disk, and network. Therefore, you should monitor the counters that will tell you the most about how those four components affect system performance so you can determine the answer to the two diagnostic questions. The biggest monitoring problem is not collecting the data, but interpreting it. Not only is it difficult to determine what a specific value for a particular counter means, it is also difficult to determine what it means in the context of other counters. The biggest difficulty is that no subsystem (disk, network, processor, or memory) exists in isolation. As a result, weaknesses in one might show up as weaknesses in another. Unless you take them all into consideration, you might end up adding another processor when all you need is more RAM. Understanding how the subsystems interact is important to understanding the significance of the counter values that are recorded. For example, if you detect that your processor is constantly running at 90%, you might be tempted to purchase a faster processor (or another processor if you have a system board that accommodates more than one). However, it is important to look at memory utilization and disk utilization as well because the problem could be originating there instead. If you do not have enough memory, the processor must swap pages to the disk frequently. This results in high memory utilization, high disk utilization, and higher processor utilization. By purchasing more RAM, you could alleviate all those problems. That one example illustrates how no one piece of information is enough to analyze your performance problems or your solution. You must monitor the server as a whole unit by putting together the counters from a variety of objects. Only then will you be able to see the big picture and solve problems that might arise. The recommended method of monitoring is to use a counter log, which captures data over a period of time. This helps you eliminate questions of whether the current stress on the server is typical. If you log over a period of a week or a month and consistently see a certain component under excessive load, you can be sure the stress is typical. Counters to Monitor for the Exchange OrganizationTo keep a watchful eye on your Exchange servers, you need to monitor several key counters from each of the four areas previously discussed. Table 8.2 presents the counters that you should monitor for memory use.
Table 8.3 presents the counters that you should monitor for processor use.
Table 8.4 presents the counters that you should monitor for disk usage.
Table 8.5 presents the counters that you should monitor for network usage.
|
| < Day Day Up > |
EAN: 2147483647
Pages: 171
- Chapter I e-Search: A Conceptual Framework of Online Consumer Behavior
- Chapter II Information Search on the Internet: A Causal Model
- Chapter IV How Consumers Think About Interactive Aspects of Web Advertising
- Chapter X Converting Browsers to Buyers: Key Considerations in Designing Business-to-Consumer Web Sites
- Chapter XI User Satisfaction with Web Portals: An Empirical Study