Monitoring Performance with Task Manager
Task Manager provides an easy way to monitor a few key indicators of your system's performance. In particular, Task Manager focuses on these three indicators:
- CPU (processor) usage
- Virtual memory usage
- Processes (roughly equivalent to programs)
Although it can be a useful tool, Task Manager provides information about only a handful of indicators. And, except for a graph that shows the last few minutes' activity, Task Manager doesn't track these indicators over time, so you can't use it for identifying chronic or sporadic conditions; it only shows what is happening here and now. When Task Manager doesn't provide the information you need, however, you can turn to a more sophisticated tool for monitoring and tracking performance: System Monitor.
Starting Task Manager
Unlike most applications included with Windows 2000, Task Manager doesn't have a shortcut on the Start menu. To start Task Manager, do any of the following:
- Right-click an unoccupied area of the taskbar and choose Task Manager from the shortcut menu.
- Press Ctrl+Left Shift+Esc.
- Press Ctrl+Alt+Delete and then click the Task Manager button. (When you press Ctrl+Alt+Delete, all your windows disappear, and only the Windows 2000 Security dialog box is visible. Don't worry. As soon as you click Task Manager, your windows reappear along with the newly opened Task Manager window.)
The first time you start Task Manager, the Applications tab is displayed, as shown in Figure 32-7.
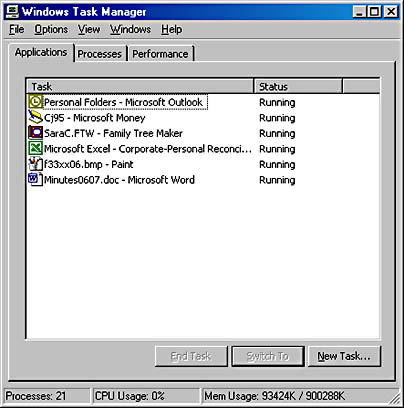
The main part of the window displays the names of all applications you've started, along with their status. You can use Task Manager as a task switcher, by selecting a program name and clicking Switch To. Or you can use it as a terminator, by selecting an application and clicking End Task. You can even use it as a launcher. If you click New Task, a dialog box functionally equivalent to the Start menu's Run dialog box appears.
Understanding the Processes Tab
The Processes tab, shown in Figure 32-8, lists all the currently running processes. Click the Processes tab to display it.
A process is an executable program (such as Windows 2000 Explorer or Microsoft Word), a service (a function controlled by Services in Control Panel, such as Event Log or Messenger), or a subsystem (such as the one for Windows 3.x applications). You can use the Processes tab to see which processes are running, and which ones are dominating processor and virtual memory usage.
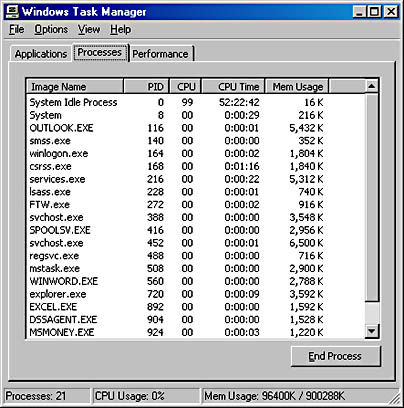
Figure 32-8. The Processes tab provides a complete list of everything running on your system.
By default, the Processes tab displays for each process:
- Image Name. The process name
- PID. The process ID, a number that uniquely identifies a process while it runs
- CPU. The percentage of elapsed time that the process used the processor (CPU) to execute instructions
- CPU Time. The elapsed time (in hours, minutes, and seconds) that the process has been running
- Mem Usage. The number of kilobytes of virtual memory used by the process
Other process-related columns are also available for display. To make your selections, choose Select Columns from the View menu while the Processes tab is displayed.
Understanding the Performance Tab
Click the Performance tab and you'll find lots of charts and numbers that tell you how your system is doing, as the example in Figure 32-9 shows.
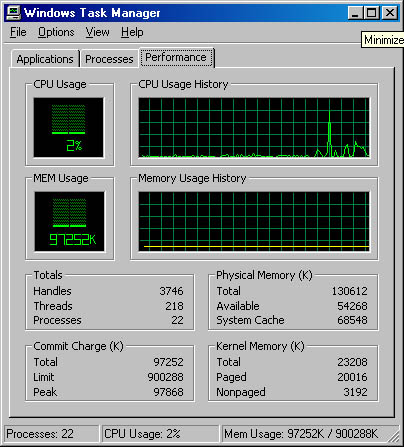
Figure 32-9. The Performance tab provides a picture of your system's activity.
The Performance tab depicts the state of your system with four graphical images, as well as providing a great deal of textual information. The CPU Usage image shows the amount of current processor usage, expressed as a percentage of its total capacity. The CPU Usage History image charts CPU usage over time. The MEM Usage image shows the amount of virtual memory that has been "committed," or used, and the Memory Usage History image charts virtual memory usage over time.
In the textual area of the dialog box, perhaps the most important section is Commit Charge (K), which tells you the current, maximum allowable, and maximum committed virtual memory.
Task Manager displays an icon in the taskbar's status area. This icon is a miniature representation of the CPU Usage box, so you can monitor processor usage at a glance—even when Task Manager is minimized. Hover the mouse over the icon and a ScreenTip will tell you the percent of total CPU usage at the moment.
TIP
Avoiding Taskbar ClutterChoose Hide When Minimized from Task Manager's Options menu. Then when you minimize Task Manager, it doesn't display a button on the taskbar. You can restore Task Manager by double-clicking its icon in the status area.
EAN: 2147483647
Pages: 317
- Integration Strategies and Tactics for Information Technology Governance
- Linking the IT Balanced Scorecard to the Business Objectives at a Major Canadian Financial Group
- Measuring and Managing E-Business Initiatives Through the Balanced Scorecard
- Governance in IT Outsourcing Partnerships
- The Evolution of IT Governance at NB Power