25.5 Introduction to the Management Information Base
25.5 Introduction to the Management Information Base
The Management Information Base, or MIB, is the database of information maintained by the agent that the manager can query or set. We describe what's called MIB-II, specified in RFC 1213 [McCloghrie and Rose 1991].
As shown in Figure 25.6, the MIB is divided into groups named system, interfaces, at (address translation), ip, and so on.
In this section we describe only the variables in the UDP group. This is a simple group with only a few variables and a single table. In the next sections we use this group to show the details of instance identification, lexicographic ordering, and some simple examples of these features. After these examples we return to the MIB in Section 25.8 and describe some of the other groups in the MIB.
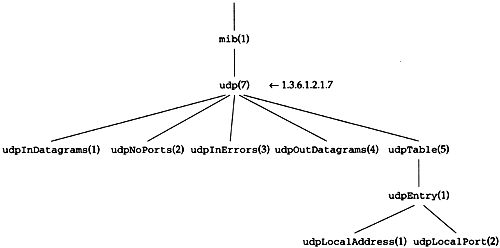
In Figure 25.6 we showed the group named udp beneath mib. Figure 25.7 shows the structure of the UDP group.
Figure 25.7. Tree structure of UDP group.

There are four simple variables and a table containing two simple variables. Figure 25.8 describes the four simple variables.
Figure 25.8. Simple variables in udp group.

We'll use this format to describe all the MIB variables in this chapter. The column labeled "R/W" is empty if the variable is read-only, or contains a bullet ( ) if the variable is read “write. We always include this column, even if all the variables in a group are read-only (as they are in the udp group) to reiterate that none of the variables can be set by the manager. Also, when the data type is an INTEGER with bounds, we specify the lower limit and upper limit, as we do for the UDP port number in the next figure.
Figure 25.9 describes the two simple variables in the udpTable.
Figure 25.9. Variables in udpTable.

Each time we describe the variables in an SNMP table, the first row of the figure indicates the value of the "index" used to reference each row of the table. We show some examples of this in the next section.
Case Diagrams
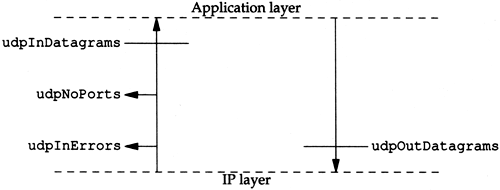
There is a relationship between the first three counters in Figure 25.8. Case Diagrams [Case and Partridge 1989] visually illustrate the relationships between the various MIB variables in a given group. Figure 25.10 is a Case Diagram for the UDP group.
Figure 25.10. Case Diagram for UDP group.

What this diagram shows is that the number of UDP datagrams delivered to applications ( udpInDatagrams ) is the number of UDP datagrams delivered from IP to UDP, minus udpInErrors, minus udpNoPorts. Also, the number of UDP datagrams delivered to IP ( udpOutDatagrams ) is the number passed to UDP from the applications. This illustrates that udpInDatagrams does not include udpInErrors or udpNoPorts.
These diagrams were used during the development of the MIB to verify that all data paths for a packet were accounted for. [Rose 1994] shows Case Diagrams for all the groups in the MIB.
EAN: 2147483647
Pages: 378