MEASURES OF CENTRAL TENDENCY
Numerical measures that locate the center of a distribution of measurements are called measures of central tendency. The most common of these are the mean, median, and mode.
THE MEAN (AVERAGE)
The most commonly used measure of central tendency is the mean. The mean of a set of values is the average, or "balance point," of those values. Xbar, or sometimes an X with a horizontal line just above it ( ![]() ), is a symbol that indicates true sample mean. This statistic is familiar, easy to calculate, and useful for symmetric distributions. However, if there is an extremely high or low value in the sample, the mean can be misleading.
), is a symbol that indicates true sample mean. This statistic is familiar, easy to calculate, and useful for symmetric distributions. However, if there is an extremely high or low value in the sample, the mean can be misleading.
Steps for Calculating the Mean for a Set of Values
The formula used to calculate the mean is ![]() = & pound ; x / n ,
= & pound ; x / n ,
where
| | = | calculated sample average; |
|
| = | sum of all sample observations; and |
| n | = | sample size . |
Identify and collect the sample of data. Below is a sample of five measurements ( n = 5):
| 5 | 6 | 8 | 5 | 30 |
-
Add all of the values (5 + 6 + 8 + 5 + 30 = 54).
-
Divide the sum (54) by the sample size ( n = 5). (54 · 5 = 10.8)
The mean is 10.8, yet four of the five values are less than 10.8. Because 30 is unusually high, the mean value of 10.8 is a distorted view of the central tendency (see Figure 4.1).
Figure 4.1: Distribution of the five samples.
In this situation, the median proves a better description of the distribution.
THE MEDIAN (MIDDLE)
The median is the second most commonly used measure of central tendency. The median is the middle value in a data set. An X with a tilde above it ( ![]() ) is the symbol used to indicate the median. Half of the measurements in a data set lie below the median, and half of them lie above the median. The median is not affected by extremely large or small measurements and is useful for describing nonsymmetric distributions.
) is the symbol used to indicate the median. Half of the measurements in a data set lie below the median, and half of them lie above the median. The median is not affected by extremely large or small measurements and is useful for describing nonsymmetric distributions.
Steps for Calculating the Median for an Odd Number of Values
To determine the median for the measurements listed below:
| 5 | 6 | 8 | 5 | 30 |
-
Develop a rank order (arrange the values from the smallest to the largest; 5, 5, 6, 8, 30).
-
Find the middle value of these (6; see Figure 4.2).
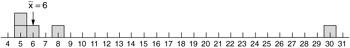
Figure 4.2: The median of odd numbers .
For an even number of values, the median is the mean (average) of the two middle values.
Steps for Calculating the Median for an Even Number of Values
To determine the median for the following measurements:
| 22 | 11 | 16 | 18 | 32 | 29 |
-
Develop a rank order (11, 16, 18, 22, 29, 32).
-
Find the middle two values (18 and 22).
-
Calculate the mean of these two values (18 + 22 = 40; 40/2 = 20; see Figure 4.3).
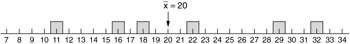
Figure 4.3: The median of even numbers.
THE MODE (MOST)
Another common measure of central tendency is the mode. The mode is the measurement that occurs most often in a sample. The mode is the highest point on a histogram or a frequency polygon.
Steps for Calculating the Mode for a Set of Values
Calculate the mode for the 14 shaft lengths (in feet) listed below:
| 6.5 | 8 | 7 | 8 | 7 | 8 | 9 |
| 8 | 8 | 8 | 8 | 10 | 7 | 8 |
-
Develop a rank order (6.5, 7, 7, 7, 8, 8, 8, 8, 8, 8, 8, 8, 9, 10).
-
Count the number of times that each value occurs. The most frequently occurring value (8 feet) is the mode shaft length (see Figure 4.4).
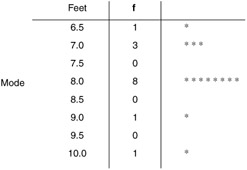
Figure 4.4: The mode of the shaft length.
EAN: 2147483647
Pages: 181
- Step 1.1 Install OpenSSH to Replace the Remote Access Protocols with Encrypted Versions
- Step 2.1 Use the OpenSSH Tool Suite to Replace Clear-Text Programs
- Step 3.1 Use PuTTY as a Graphical Replacement for telnet and rlogin
- Step 4.2 Passphrase Considerations
- Step 4.3 How to Generate a Key Pair Using OpenSSH