QUALITY FUNCTION DEPLOYMENT (QFD)
Now that we have finished the Kano analysis, and we know pretty much what the customer sees as functional and value added items, we are ready to organize all these attributes and then prioritize them. The methodology used is that of QFD. QFD is a planning tool that incorporates the voice of the customer into features that satisfy the customer. It does this by portraying the relationships between product or process whats and hows in a matrix form. The matrix form in its entirety is called the House of Quality ” see Figure 2.10.
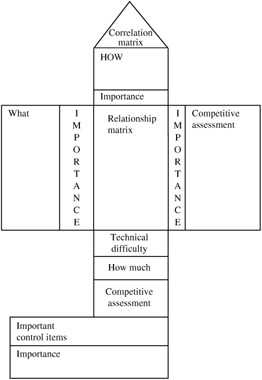
Figure 2.10: A typical House of Quality matrix.
One of the reasons why QFD is used is because it allows us to organize the Y s and ys and x s into a workable framework of understanding. QFD does not generate the Y s, ys, or x s. Ultimately, however, QFD will help in identifying the transfer function in the form Y = f(x, n)
QFD was developed in Japan, with the intent to achieve competitive advantage in quality, cost, and timing. To understand this need, one must comprehend what quality control is all about from Japan's point of view. Japan's industrial standards define Quality Control (QC) as a system of means to economically produce goods and/or services that satisfy customer requirements. It is this definition of QC that propelled the Japanese to find not only a tool but a planning tool that implements the business objectives, of which the right application is product development. The definition of QFD is a systematic approach for translating customer wants/requirements into company-wide requirements. This translation takes place at each stage from research and development to engineering and manufacturing to marketing and sales and distribution. The QFD system concept is based on four key documents:
-
Overall customer requirement planning matrix. This document provides a way of turning general customer requirements into specified final product control characteristics.
-
Final product characteristic deployment matrix. This document translates the output of the planning matrix into critical component characteristics.
-
Process plan and quality control charts . These documents identify critical product and process parameters as well as benchmarks for each of those parameters.
-
Operating instructions. These documents identify operations to be performed by plant personnel to assure that the important parameters are achieved.
TERMS ASSOCIATED WITH QFD
There are six key terms associated with QFD:
- Quality function deployment
- An overall concept that provides a means of translating customer requirements into the appropriate technical requirements for each stage of product development and production (i.e., marketing strategies, planning, product design and engineering, prototype evaluation, production process development, production, sales). This concept is further broken down into "product quality deployment" and "deployment of the quality function" (described below).
- Voice of the customer
- The customers' requirements expressed in their own terms.
- Counterpart characteristics
- An expression of the voice of the customer in technical language that specifies customer-required quality; counterpart characteristics are critical final product control characteristics.
- Product quality deployment
- Activities needed to translate the voice of the customer into counterpart characteristics.
- Deployment of the quality function
- Activities needed to ensure that customer-required quality is achieved; the assignment of specific quality responsibilities to specific departments. (The phrase "quality function" does not refer to the quality department, but rather to any activity needed to ensure that quality is achieved, no matter which department performs the activity.)
- Quality tables
- A series of matrices used to translate the voice of the customer into final product control characteristics.
BENEFITS OF QFD
QFD certainly appears to be a sensible approach to defining and executing the myriad of details embodied in the product development process, but it also appears to be a great deal of extra work. What is it really worth? Setting the logical arguments aside, there are a number of demonstrated benefits resulting from the use of QFD:
-
Demonstrated results
-
Preservation of knowledge
-
Fewer startup problems
-
Lower startup cost
-
Shorter lead time
-
Warranty reduction
-
Customer satisfaction
-
Marketing advantage
Preservation of knowledge ” The QFD charts form a repository of knowledge, which may (and should) be used in future design efforts. For example: Toyota is convinced that the QFD process will make good engineers into excellent engineers. An American engineering expert once commented, "There isn't anything in the QFD chart I don't already know." Upon reflection, he realized that few other engineers knew everything on that chart. The QFD charts can be a knowledge base from which to train engineers.
Fewer startup problems/lower startup cost ” Toyota and other Japanese automobile manufacturers have found that the use of QFD more effectively "front loads" the engineering effort. This has substantially reduced the number of costly engineering changes at startup through a marked reduction of problems at startup. QFD has helped to identify potential problems early in design or avoid oversights through its disciplined approach.
Shorter lead time ” Toyota has reduced its product development cycle to less than 24 months.
Warranty reduction ” The corrosion problems with Japanese cars of the 1960s and 1970s led to enormous warranty expenses, significantly impacting profitability. The Toyota rust QFD study resulted in virtually eliminating corrosion and the resulting warranty expense.
Customer satisfaction ” The Japanese automobile manufacturers tend to focus on products that satisfy customers (as opposed to eliminating problems). The QFD approach has greatly facilitated the satisfying of customer wants. Domestic customer satisfaction surveys show that Japanese products have consistently scored higher than many American products.
Marketing advantage ” A Japanese manufacturer of earth moving equipment introduced a series of five new models that offered substantial advantages over their Caterpillar corporation counterparts, resulting in redistribution of market share.
QFD brings several benefits to companies willing to undertake the study and training required to put the system in place. Some of these benefits as they relate to marketing advantage are:
-
Product objectives based on customers' requirements are not misinterpreted at subsequent stops.
-
Particular marketing strategies' "sales points" do not become lost or blurred during the translation process from marketing through planning and on to execution.
-
Important production control points are not overlooked. Everything necessary to achieve the desired outcome is understood and in place.
-
Tremendous efficiency is achieved because misinterpretation of program objectives, marketing strategy, and critical control points is minimized. See Figure 2.2.
All of the above translate into significant marketing advantages, that is, speedy introduction of products that satisfy customers without problems.
In addition to all the benefits already mentioned, Table 2.2 shows some of the benefits from the total development process perspective, which is a synergistic result starting with QFD.
| Cash Drain | Old Process | Improved Process |
|---|---|---|
| Technology push, but where's the pull? | Concepts with no needs, needs with no concept | Technology strategy and technology transfer bring right technology to the product |
| Disregard for voice of the customer | The voice of the engineer and other corporate specialists is emphasized | House of Quality and all steps of QFD deploy the voice of the customer throughout the process |
| Eureka concept | Mad dash with singular concept, usually vulnerable | Pugh process converges on consensus and commitment to invulnerable concept |
| Pretend designs | Initial design is not production intent and emphasizes newness rather than superior design | Two step design and design competitive benchmarking lead to superior design |
| Pampered product | Make it look good for demonstration | Taguchi optimization positions product as far as possible away from potential problems |
| Hardware swamps | Large number of highly overlapped prototype iterations leaves little time for improvement | Only four iterations, each planned to make maximum contribution to optimization |
| Here is the product; where is the factory? | Product is developed, then factory reacts to it | One total development process, product, and production capability |
| We have always made it this way | Old process parameters used repetitiously without design improvement | Taguchi process parameter improves quality, reduces cycle times |
| Inspection | Inspection creates scrap, rework , adjustments, and field quality loss | Taguchi's optimal checking and adjusting minimizes costs of inspection |
| Give me my targets, let me do my thing | Lack of teamwork | Teamwork and competitive benchmarking beat contracts, and targets lead the process, do not manage problems |
ISSUES WITH TRADITIONAL QFD
The use of traditional QFD raises several issues for business people, including the following:
-
Change is uncomfortable.
Counterpoint: There is an old saying, "If we do what we have done, we will get what we have." To truly improve, we must explore new patterns of logical thinking and let go of outdated ways. We must be willing to change.
-
Success is not realized until the product is released.
Counterpoint: The truest measure of customer satisfaction comes after the product or service is introduced. It is easy to lose sight of improvements that do not materialize until years after the improvement effort. We would be remiss not to seek ways to achieve the end goal of customer satisfaction in our design and development process.
-
QFD is a long process.
Counterpoint: QFD saves the team's time and resources with new approaches and tools. Avoiding multiple redesigns and multiple prototype levels in response to customer input recovers the time spent on QFD. The upstream time saves multiples of downstream time.
-
It is not as much fun as "fire fighting."
Counterpoint. Finding and fixing problems may be personally gratifying. It is the stuff from which heroes/heroines are made. But emergencies are not in the company's best interest and certainly not in the customer's interest. Management must provide a system that rewards problem prevention as well as problem solving.
-
The relation to the traditional product development process is not understood.
Counterpoint: QFD replaces some traditional product design and development events, i.e., target setting and functional assumptions, and thereby does not add time.
-
It is difficult to accept customer input when the "voice of the engineer" contradicts.
Counterpoint: Engineering has delivered about 80% customer satisfaction; getting to 90 “95% is a tough challenge requiring enhancements to current methods for achieving quality.
PROCESS OVERVIEW
The easiest way to think of QFD is to think of it as a process consisting of linked spreadsheets arranged along a horizontal (Customer) axis and intersecting vertical (Technical) axis. Important details include the following:
-
From a macro perspective, the horizontal arrangement is referred to as the Customer Axis because it organizes the Customer Wants.
-
Customers are the people external to the organization who purchase, operate , and service your products. Customers can also be internal, i.e., the end users of your work within the organization.
-
The vertical arrangement is referred to as the Technical Axis Customer Wants into technical metrics.
-
The intersection of the axes (referred to as the Relationship Matrix) identifies how well engineering metrics correlate to customer satisfaction.
-
A closer look reveals that the interrelated matrices build upon one another beginning with a validated list of Customer Wants.
DEVELOPING A "QFD" PROJECT PLAN
Perhaps one of the most important issues in QFD is the selection of appropriate teams. Teams must share a common vision and mission to accomplish their objectives. Some of the reasons are:
-
Building a project plan is the first critical team-building exercise
-
The project plan has been standardized in QFD, so all teams follow a basic strategy that includes the following steps:
-
Develop Project Plan to include safety standards and any governmental regulations, as well as timing.
-
Review Project Plan with program management for buy-in.
-
Complete the Customer Axis.
-
Review Customer Axis interim report with program management.
-
Complete Technical Axis.
-
Develop corporate strategy.
-
Develop final report.
-
Develop Deployment Plan for integrating into business cycle.
-
Communicate results to all programs and affected activities.
-
The Customer Axis
The steps necessary for completion of the customer axis include the following:
Determining Customer Wants
-
Obtain Customer Wants.
-
Select relevant Customer Wants ” about 30% of total Wants.
-
Add applicable Wants.
-
Set up focus groups, interviews, surveys, etc.
-
Refine Customer Wants list.
-
Enter Customer Wants into QFD net.
-
Give Customer Wants to strategic standardization organization (SSO).
Obtaining customer competitive evaluations
-
Submit Customer Wants to market research (team).
-
Develop mail-out questionnaire and/or clinic (market research).
-
Send mail-out questionnaire and/or conduct clinic (market research).
-
Report results to project team (market research).
-
Enter customer competitive evaluation data into the internal team base.
Setting customer targets
-
Identify Customer Want (team).
-
Review its Customer Desirability Index (CDI) rating and rank (team).
-
Identify baseline product (team).
-
Review customer competitive evaluations (team).
-
Identify corporate strategy (team).
Calculate image ratio for each Customer Want: customer target/baseline product.
Calculate strategic CDI for each Customer Want: CDI — image ratio — sales point.
-
Enter corporate strategy into customer targets matrix (team).
-
Set customer targets ” either opportunity to copy or sales point.
-
If opportunity to copy, enter symbol into customer targets matrix.
-
If sales point, enter values into customer targets matrix (team).
-
End.
Determining Technical System Expectations (TSE)
-
Review and adapt TSE template (team).
-
Review past and current projects for additional TSEs (team).
-
Identify and define new TSEs (team).
-
Organize adapted list of TSEs (team).
-
Enter TSEs into internal base (team).
Determining relationships
-
Review the relationship (team).
-
Confirm/establish relationships (team and subject matter experts [SMEs]).
-
Seek team consensus (team).
-
Collect data and/or conduct experiments (team and SMEs) to find out whether disagreements exist.
-
Check that each Want is satisfied by at least one TSE (team and SMEs).
-
Enter into internal base.
Technical competitive benchmarking
-
Buy, rent, lease or borrow competitive products (team).
-
Select TSEs to be benchmarked (team).
-
Establish inventory of benchmarking tests and data (team and SMEs).
-
Identify additional benchmarking tests required (team and SMEs).
-
Develop new tests (team and SMEs).
-
Conduct benchmark tests (team and SMEs).
-
Enter data into QFDNET (team).
-
Establish customer/engineer correlations (team and SMEs).
Setting technical targets
-
Develop technical targets (team and SMEs).
-
Review existing program targets for existing TSEs (team).
-
Recommend technical targets to program office (team and SMEs).
-
Reconcile program targets and technical targets for existing TSEs (program office).
-
Enter technical targets into QFDNET (team).
The steps listed above will result in the following QFD deliverables for the Customer Axis:
-
Validated list of Customer Wants for the product, system, subsystem, or component
-
Customer Wants prioritized to focus engineering attention
-
Customer Desirability Index of the most to least desirable Customer Wants
-
Customer satisfaction targets for all Customer Wants, expressed as a percent over/under satisfaction of base product, system, subsystem, or component
-
A final rank ordered strategic index of Customer Wants based on corporate strategies and competitive opportunities
-
Technical Axis
On the Technical Axis, the following items will need to be produced:
-
Rank ordered list of key Technical System Expectations that when correctly targeted will satisfy Customer Wants at a strategically competitive level
-
Target values for key TSEs derived from technical competitive benchmarking that correlate with customer's competitive evaluations. These target values aid program management two ways:
-
By driving the product and engineering program toward integrated business and technical propositions that program management can prove
-
With managing the program team's performance at program completion
-
Internal Standards and Tests
-
New or modified tests or other verification methods that make certain basic and product performance wants achieved
Institutionalizing revised tests and standards into real world usage ” customer dependent, of course ” customer requirements, corporate engineering test procedures, and other documents both generic and program specific that support the organization's design verification system.
THE QFD APPROACH
The first concern of QFD is the customer. Therefore, in planning a new product we start with customer requirements, defined through market research. Generally , we call this the product development process, and it includes the program planning, conceptualization, optimization, development, prototyping, testing, and manufacturing functions.
One can see that this development process is indeed very complex. Quite often, it cannot be performed by one individual. This is because it consists of several tradeoffs, such as:
-
Shared responsibilities
-
Interpretations
-
Priorities
-
Technical knowledge
-
Long time experience
-
Resource changes
-
Communication
-
Lots of work
It is precisely this complexity that all too often causes the product development process to create a product that fails to meet the customer requirements. For example:
-
Customer requirement ’
-
Design requirements ’
-
Part characteristics ’
-
Manufacturing operations ’
-
Production requirements
-
-
-
-
| Note | It is of paramount importance that the communication process within an organization does not fall victim to the use of jargon. |
QFD METHODOLOGY
QFD is accomplished through a series of charts that appear to be very complex. They do contain a great deal of information, however. That information is both an asset and a liability.
All the charts are interconnected to what is called the House of Quality because of the roof-like structure at its top. Since this house is made up of distinct parts or "rooms," let us find the function of each part, so that we can comprehend what QFD is all about ” see Figure 2.10.
QFD begins with a list of objectives or the "what" that we want to accomplish ” see Figure 2.11. This is usually the voice of the customer and as such is very general, vague, and difficult to implement directly. It is given to us in raw form, that is, in the everyday language of the customer. (Example: "I don't want a leaky window when it rains.")

Figure 2.11: The initial "what" of the customer.
For each what, we refine the list into the next level of detail by listing one or more "hows" for each what. The hows are an engineering task. Figure 2.11 shows the relationship between the what and the how. Figure 2.12 shows that it is possible to have an iterative process between the what and the how, with a possible refinement of the "old how" into the "new what" and ultimately to generate a very good "new how."
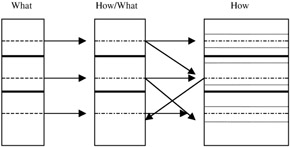
Figure 2.12: The iterative process of "what" to "how."
Even though this step shows greater detail than the original what list, it is by itself often not directly actionable and requires further definition. This is accomplished by further refinement until every item on the list is actionable . This level is important because there is no way of ensuring successful realization of a requirement that no one knows how to accomplish. (Note: Remember that our level of refinement within the how list may affect more than one how or what and can in fact adversely affect one another. That is why the arrows in Figure 2.11 are going in multiple directions.)
To reduce possible confusion we represent the what and how in the following manner. The enclosed matrix becomes the relationships. The relationships are shown at the intersections of the what and how. Some common symbols are:
| q | Medium relationship |
| — | Weak relationship |
| — | Very strong relationship |
The method of using symbols allows very complex relationships to be shown, and the interpretation is easy and is not dependent on experience. There are many variations of this, and readers are encouraged to use what is comfortable for them. Figure 2.13 presents a typical matrix.
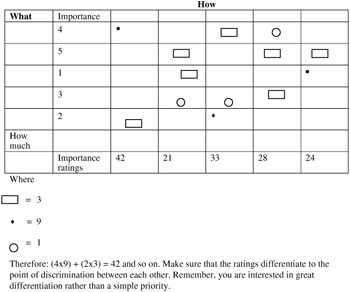
Figure 2.13: The relationship matrix.
Once the what, how, and relationships have been identified, the next step is to establish a "how much" for each how ” see Figure 2.14. The intent here is to provide specific objectives that guide the subsequent design and provide a means of objectivity to the process. The result is minimum interference from opinion. (Note: This how much is another cross check on our thinking process. It forces us to think in a very detailed, measurable fashion.)
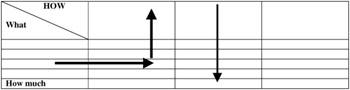
Figure 2.14: The conversion of "how" to "how much."
To summarize:
-
The what identifies the customer's requirements in everyday language.
-
The how refines the customer's requirements (from an engineering perspective).
-
The relationship defines the relationship between what and how via a symbolic language.
-
The how much provides an objective means of assessing that requirements have been met and provides targets for further detail development. Pictorially, the flow is shown in Figure 2.14.
At this point, even though a lot of information is at hand, it is not unusual to refine the hows even further until an actionable level of detail is achieved. This is done by creating a new chart in which the hows of the previous chart become the whats of the new chart. The "how much" information as a general rule is carried along to the next chart to facilitate communication. This is done to ensure that the objectives are not lost.
The process is repeated as necessary. In the product development process, this means taking the customer requirements and defining design requirements that are carried on to the next chart to establish the basis for the part characteristic. This is continued to define the manufacturing operations and the production requirements ” see Figure 2.15. (Note: The greatest gains using QFD can be realized only when taken down to the work detail level of production requirements. The QFD process is well suited to simultaneous engineering in which product and process engineers participate in a team effort.) For more information on the cascading process of the QFD methodology, see the Appendix.
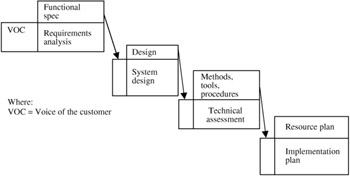
Figure 2.15: The flow of information in the process of developing the final "House of Quality."
So far, we have talked about the basic charts in the House of Quality, and as a result we have gained much information about the problem at hand. However, there are several useful extensions to the basic QFD charts that enhance their usefulness . These are used as required based on the content and purpose of each particular chart. One such extension is the correlation matrix.
The correlation matrix ” see Figure 2.10 ” is a triangular table often attached to the "hows." The purpose of such placement is to establish the correlation between each "how" item, i.e., to indicate the strength of the relationship and to describe the direction of the relationship. To do that, symbols are used, most commonly:
| O Positive | X Negative |
| — Strong positive | # Strong negative |
A second extension is the competitive assessment ” see Figure 2.10. This is a pair of graphs that shows item for item how competitive products compare with current company products. Its strength is the fact that it can be done for the whats, hows, and how muchs.
The competitive assessment may also be used to uncover gaps in engineering judgment. What and how items that are strongly related should also exhibit a relationship in the competitive assessment. For example, if we believe superior dampening will result in an improved ride, the competitive assessment would be expected to show that products with superior dampening also have a superior ride. If this does not occur, it calls attention to the possibility that something significant may have been overlooked. If not acted upon, we may achieve superior performance to our "in house" tests and standards but fail to achieve expected results in the hands of our customers.
Why are we doing this? Basically, for two reasons:
-
To establish the values of the objectives to be achieved
-
To uncover engineering judgment errors
Remember that the correlation must be related to real world usage from the customer's perspective. What and how items that are strongly related should also be shown to relate to one another in the competitive assessment. If the correlation does not agree, it may mean that we overlooked something very significant.
A third extension is the importance rating ” see Figure 2.10. This is a mechanism for prioritizing efforts and making trade-off decisions for each of the whats and hows. It is important to keep in mind that the values by themselves have no direct meaning; rather, their meaning surfaces only when they are interpreted by comparing their magnitudes . The importance rating is useful for prioritizing efforts and making trade-off decisions. (Some of the trade-offs may require high level decisions because they cross engineering group , department, divisional , or company lines. Early resolution of trade-offs is essential to shorten program timing and avoid non-productive internal iterations while seeking a nonexistent solution.) The rating itself may take the form of numerical tables or graphs that depict the relative importance of each what or how to the desired end result. Any rating scale will work, provided that the scale is a weighted one. A common method is to assign weights to each relationship matrix symbol and sum the weights, just as we did in Figure 2.13. Another more technical way is the following:


where w' functioni = unnormalized function importance; w yj = importance rating; r ij = individual rating of functions; and w function i = weighted function importance.
Applying this methodology to Figure 2.13 yields Figure 2.16.
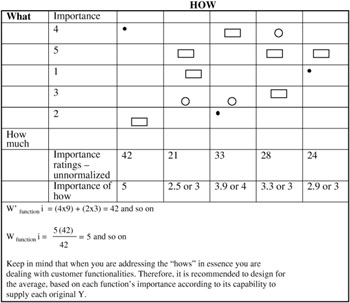
Figure 2.16: Alternative method of calculating importance.
QFD AND PLANNING
Contrary to what the name implies, quality function deployment (QFD) is not just a quality tool. QFD was developed in Japan, growing out of the need to simultaneously achieve a competitive advantage in quality, cost, and timing. To better comprehend QFD, it is important to understand what the Japanese mean by the word "quality."
The word "quality," which we generally define as conformance to requirements, fitness for use, or some other measure of goodness, takes on a much broader meaning in Japan (there is probably no exact English translation of the Japanese version). However, according to Japanese industrial standard Z8101-1981, "quality control" is "a system of means to economically produce goods or services which satisfy customer requirements." (Italics added.)
Thus to the Japanese, "quality" means conducting the business effectively, not just producing a good product. In this context, QFD really becomes a planning tool for implementing business objectives, of which the most widely known application is to product development.
In planning a new product, we start with customer needs, wants, and expectations, often defined through market research. We wish to design and manufacture a product that satisfies the customer's perception of intended function, as well as or better than our competitors (subject to certain internal company constraints). In other words:

Let us call the process of translating these requirements into a viable product the "product development process." This process includes program planning, concepting, optimization, development, prototyping, and testing, as well as the corresponding manufacturing functions. Thus:

In a large organization, the product development process is so detailed that often no one individual can comprehend it all. For some, the process looks like a maze or a mysterious "black box." For others the process is an intricate network of activities. Regardless of how it is represented, the product development process is exceedingly complex, consisting of numerous trade-offs.
Shared responsibilities and interpretation differences often result in conflicting priorities. That is the reason the team must have ownership of the projects and must have a substantial body of technical knowledge over a relatively long time frame while enduring resource changes. This, of course, requires a great deal of communication and a substantial work effort.
PRODUCT DEVELOPMENT PROCESS
The complexity of the product development process makes it a natural haven for Murphy's law, with nearly an infinite number of opportunities for problems to occur. Despite the best of intentions and efforts, all too often the product development process creates a product that fails to meet the customer requirements. Such failures may occur due to:
-
Trade-offs
-
Shared responsibilities
-
Interpretations
-
Priorities
-
Technical knowledge
-
Long time frame
-
Resource changes
-
Communication ” lots of work
The QFD approach focuses on customer requirements in a manner that directs efforts toward achieving those requirements ” see Figure 2.17. In Figure 2.17, for each of the customer requirements, a set of design requirements is determined, which if satisfied will result in achieving the customer requirements. In like manner, each design requirement is evolved into part characteristics, which in turn are used to determine manufacturing operations and specific production requirements. The flow is as follows :
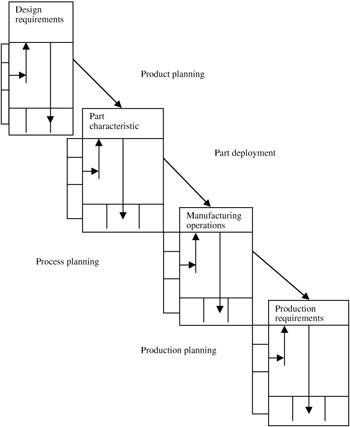
Figure 2.17: The development of QFD.


So, for example: The customer requirement of "years of durability" may be achieved in part by the design requirement of no visible rust in three years. This in turn may be achieved in part by ensuring part characteristics that include a minimum paint film build and maximum surface treatment crystal size . The manufacturing process that provides these part characteristics consists of a three-coat process that includes a dip tank. The production requirements are the process parameters within the manufacturing process that must be controlled in order to achieve the required part characteristics (and ultimately the customer requirements). Therefore, we can present this in a summary form as:
-
CUSTOMER REQUIREMENT: Years of durability
-
DESIGN REQUIREMENT: No visible exterior rust in 3 years
-
PART CHARACTERISTICS: Paint weight ” 2 “2.5 gm/m 2 ; Crystal size ” 3 max
-
MANUFACTURING OPERATIONS: Dip tank; 3 coats
-
PRODUCTION REQUIREMENTS: Time = 2.0 minutes; Acidity = 1.5 to 2.0; Temperature = 45 “55 °C
EAN: 2147483647
Pages: 235