THE CONCEPT OF FUNCTION
In any business environment, there may be no more powerful concept than that of function. To understand why this is a potent notion, we need to consider what we mean by "function."
What is "function?" Let us start with a common definition: "The natural, proper, or characteristic action of any thing..." This is the Webster's New Collegiate Dictionary definition, and it is quite representative of what you will find in most dictionaries. This is actually a powerful and insightful definition.
Think about any product or service that you purchase. What is it about the product or service (I will use the term "product" from here on, although every issue that will be discussed will be equally valid for services) that causes you to exchange money, goods, or some other scarce resource for it? Ultimately, it is because you want the "characteristic actions" that the product provides. These "actions" may be simple or complex, utilitarian or capricious, Spartan or gilded ” but in each transaction, you enter with a set of unfulfilled wants and needs that you attempt to satisfy .
Moreover, if the product you purchase actually manages to fulfill the wants and needs that you perceive, you are more likely to be satisfied with your purchase than when the product fails to satisfy your desires. Within these few short sentences, we have the fundamental principles that underpin three of the most powerful tools in the modern pantheon of quality, productivity, and profitability: Quality Function Deployment, Value Analysis, and Failure Modes & Effects Analysis.
To put the concept of function into action, we need to refine our definition. The expanded definition we would like you to consider is "The characteristic actions that a system, part, service, or manufacturing process generates to satisfy customers. " In this expanded definition, you cannot only see the concept of function at work, but you may be able to recognize the essential abstraction of a process.
In a process, some type of input is transformed into an output. As a simple equation, we might say that
Input(s) + Transformation = Output(s)
In the case of function, the inputs are the unfulfilled wants and needs that a customer or a prospective customer has. These can be and often are intricate ; this is why the discipline of marketing is still more art than science. (We will have more to say about this issue in just a moment.) Nevertheless, there exist multiple sets of unfulfilled wants and needs that are open to the lures and attractions provided by the marketplace .
In this very broad model, the transformation is provided by the producer. With one, ten, or hundreds of internal processes (within any discussion of process, there is always the "Russian doll" image: processes within processes within processes), business organizations attempt to determine the unmet wants and needs that customers have. The producer then must design and develop products and delivery processes that will provide tangible and/or intangible media of exchange that will assuage the unmet needs or need sets.
Finally, the external processes that involve exchange of the producer's goods for money or other barter provide the customer with varying degrees of satisfaction. The gratification (or lack of satisfaction) that results can then be viewed as the output of the general process.
In business, the inputs are not within the control of producers . As a result, producers need powerful tools to understand, delineate, and plan for ways to meet these needs. This can be thought of as the domain of the Kano model or Quality Function Deployment.
The transformational activities, however, are within the control of the producer. These "controlled" activities include planning efforts to deliver "function" at a satisfactory price; the nuances and subtleties of this activity can be strongly influenced or even controlled by the discipline of Value Analysis.
In addition, fulfillment of marketplace "need sets" also implies that this fulfillment will occur without unpleasant surprises . Unwanted, incomplete, or otherwise unacceptable attempts to produce "function" often result in failure. This implies that producers have a need to systematically analyze and plan for a reduction in the propensity to deliver unpleasant surprises. This planning activity can be greatly aided by the application of Failure Modes and Effects Analysis techniques.
To see how these ideas mesh, we need to consider how "function" can be comprehensively mapped. This will require several steps. To apply what will be discussed in the rest of this section, we need to emphasize the importance of choosing the proper scale for any analysis. The probability is that you will choose too broad a view or too much detail; we will try to provide guidance on this issue during our discussion of methods .
UNDERSTANDING CUSTOMER WANTS AND NEEDS
The nature of customer wants and needs is complex, deceptive, and difficult to discern. Nevertheless, the prediction of future wants and needs in the marketplace is perhaps the most important precursor to financial success that exists. Knowing and doing something that is profitable are two very separate (but not completely independent) aspects of this challenge.
The first task that must be undertaken is to list the customers that we are interested in. Virtually no business is universal in terms of target market. Moreover, in today's highly differentiated world, it is likely an act of folly to suggest that any product would have universal appeal . (Even an idealized product such as a capsule that, when ingested, yields immortality would have its detractors and would be rejected by some elements of humanity.) So, we need to start by cataloging the customers that we might wish to serve.
In this effort, however, we need to recognize that there is a chain of customers. This is often seen in discussions of the "value chain," a concept explored in detail by Porter (1985). For example, Porter discusses the concept of "channel value," wherein channels of distribution "perform additional activities that affect the buyer, as well as influence the firm's own activities."
This means that there are several dimensions on which we will discover important customers. First, there are market segments and niches . These can be geographic, demographic, or even psychographic in nature. Second, there are many intermediary customers, who have an important influence on ultimate purchases in the marketplace. Finally, there are what might be called "overarching" customers ” persons or entities that must be satisfied even in the absence of any purchasing power ” to enable or permit the sale of goods and services.
This is readily visible in the auto industry. From the standpoint of a major parts manufacturer, say United Technologies, Johnson Controls, Dana Corporation, or Federal-Mogul, there are legions of important customers. In the market segment category, there are the vehicle manufacturers, including GM, Ford, Toyota, and all of the others. Contained within this category of customers are many sub-customers, including purchasing agents , engineers , and quality system specialists.
As far as intermediary customers are concerned , we can consider perhaps a dozen or more important players. We need to consider the transportation firms that carry the parts from the parts plant to the assembly plant. We also need to think about the people and the equipment within the assembly plant that facilitate the assembly of the part into a vehicle. (If anyone doubts this is important, they have never tried to sell a part to an assembly plant where the assembly workers truly dislike some aspect of the part.) The auto dealer is yet another step in this array of hurdles, and mechanics and service technicians constitute still one more customer who must, in some way, be reasonably satisfied if commercial success is to spring forth.
In addition, the auto industry has a web of regulatory and statutory requirements that govern its operation. These include safety regulations, emission standards, fleet mileage laws, and the general requirements of contract law. Behind these government requirements are still more governmental prerequisites, including occupational safety law, environmental law as applied to manufacturing, and labor law. This means that the governmental agencies and political constituencies that administer these laws can be seen as the "overarching" customers described previously.
Ultimately, vehicle purchasers themselves are the critical endpoint in this chain of evaluation. And within this category of customers are the many segments and niches that car makers discuss, such as entry level, luxury, sport utility, and the many other differentiation patterns that auto marketers employ . Only when a product passes through the entire sequence will it have a reasonable chance of successfully and repeatedly generating revenue for the producer. This provides a critical insight about function.
Function is only meaningful through some transactional event involving one or more customers. Only customers can judge whether a product delivers desired or unanticipated -yet-delightful function.
In many cases (in fact, most), firms simply do not consider all of these customers. As a result, they are often surprised when problems arise. Moreover, they suffer financial impediments as a result ” even though they may simply budget some degree of failure expectation into overhead calculations.
A rational assessment of this situation means that the first requirement for understanding function is a comprehensive listing of customers. Frankly, this is very hard work, and it requires time, dedication, and effort. Regardless, understanding the customers that you wish to serve is an essential prerequisite to comprehension of function.
CREATING A FUNCTION DIAGRAM
If you want to understand function, the first requirement is the use of a special language.
Function must be described using an active verb and a measurable noun. Fowler (1990) calls this linguistic construction a "functive" ” a function described in direct terms that are, to the greatest degree possible, unambiguous.
In a functive, the verb should be active and direct. How can you tell if the verb meets this test? Can you subject the action described by the verb to reasonable verification? One of the difficulties with this approach is the widespread affinity for ambiguity, the evil spawn of corporate life. To reduce ambiguity, you must avoid "nerd" verbs such as provide, be, supply, facilitate, and allow.
Since most people pepper their business speech with these verbs, how can you avoid using them? If you cannot avoid "nerd verbs," then you might try to convert the noun to a verb. Instead of "allow adjustment" think about what it is that you are adjusting. For example, you could easily restate this "nerd verb" functive with "adjust clearance." Whenever a "nerd verb" comes up, try converting the noun that goes with the nerd verb to a verb, and then select the appropriate measurable noun. Most of the time, this will reduce the ambiguity.
The measurable noun also must be reasonably precise. In particular, it should be relatively unchanging in usage and should rarely be the name of a part, operation, or activity used to generate the product or service under consideration. The test for a measurable noun is very simple: can you measure the noun? Bear in mind, however, that the measurement may be as simple as counting ” or it can be a detailed statement of a technical or engineering expectation of the degree to which a function can be fulfilled. Ultimately, the combination of an active verb and measurable noun will give rise to an extent ” the degree to which the functive is executed.
For example, let us consider a simple mechanical pencil. The mechanism of the pencil must feed lead at a controlled rate. This also means that there must be a specific position for the lead. If the lead is fed too far, the lead will break. If the feed is not far enough, the pencil may not be able to make marks. As a result, one function that we can consider is "position lead." The measurement is the length of exposed lead, and the desired extent of the positioning function may be 5 mm from the barrel end of the pencil. If there are limits on the extent in the form of tolerance, this is a good time to think about these limits as well. [1]
While you are describing function in terms of an active verb and measurable noun, it is very important to maintain a customer frame of reference. Do not forget that function is only meaningful in terms of customer perception. No matter how much you may be enamored of a product feature or service issue, you must decide if the target customer will perceive your product in the same way. [2]
THE PRODUCT FLOW DIAGRAM AND THE CONCEPT OF FUNCTIVES
Now that we understand the essential issues involved in describing function, we can learn more about techniques for understanding the many complex functions that exist in a product. If products had just one or two functions, it would be easy to understand the issues that motivate purchase behavior. In today's complex world, though, products seem to have more features (and hence more functions) nearly every day. How can we understand this complexity? Fortunately, there are common patterns that exist in the functionality of any product. We can see this through the creation of a product flow diagram.
A product flow diagram uses simple, direct language to delineate function. This is a valuable aid to help you understand what your product provides to customers. We can start our efforts to develop this diagram by identifying functions.
In practice, this is best done by a group or team, and it should be done after all participants have become familiar with the list of customers at whom the product is aimed. A general list of functions can then be developed using brainstorming techniques or other group-based creativity tools.
There are a few issues that you should keep in mind while simply listing functions. Functions must describe customer wants and needs from the viewpoint of the customer. A common problem is to confuse product functions with functions being performed by the customer, the designer, the engineer who created the product, or the manufacturer who produces the product. Again, think about a mechanical pencil. Many people will start by describing the function of the pencil as "write notes." However, the pencil, by itself, cannott write anything. (If you can invent a pencil that will write notes without a writer attached you will probably become rich.) The function that is more appropriate for the pencil is "make marks."
The best way to start is to simply brainstorm as many functions as you can using active verbs and measurable nouns. There are many ways to brainstorm; in this case, it is usually easiest to have everyone involved use index cards or sticky notes to record their ideas. Remember that brainstorming should not be interrupted by criticism; just let the ideas flow. You will get things that do not apply, and, until you gain experience, you will not always use the "functive" structure that is ultimately important. Do not worry about these issues during the idea-generation phase of this process.
Once you have a nice pile of cards or notes, start by sifting and sorting the ideas into categories. In any pile of ideas, there will be natural "groupings" of the cards. Determine these categories and then sort the cards. This can be thought of as "affinity diagramming" of the ideas. You will find some duplicates and some weird things that probably do not belong in the pile. [3] Discard the excess baggage and look at the categories. Are there any important functions you have missed? Do not hesitate to add new ideas to the categories, either.
Finally, you are ready to bear down on the linguistic issues. Make sure that all of the ideas are expressed in terms of active verbs and measurable nouns. Change the idea to a "functive" construction, and then look for the "nerd" verb cards. Convert all of the "nerd verb" functions into true functives, with fully active verbs and measurable nouns. When you are done, you will have an interesting and important preliminary output.
Now, count the cards again. If you have more than 20 to 30 cards, you have probably tackled too complex a subject or viewpoint. For example, a commercial airline has thousands ” even hundreds of thousands ” of functions. If you wanted to analyze function on the widest scale, you would probably be guilty of too much detail if you listed more than 30 functives. On the broadest scales of view, you may only list a handful of functions. Nothing is wrong with a short list, especially for the broadest view.
If you have trouble, we can suggest some "function questions" that can assist you in your brainstorming. Try these questions:
-
What does it do?
-
If a product feature is deleted, what functions disappear?
-
If you were this element, what are you supposed to accomplish? Why do you exist?
Ask the function questions in this order:
-
The entire scope of the project
-
A "system" view
-
Each element of the project
-
A "part" view
-
Each sub-element of the project
-
A "component" view
Finally, we can start our next task, which consists of arranging functions into logical groups that show interrelationships. In addition, this next "arranging" step will allow us to test for completeness of function identification and improve team communication.
We start by asking "What is the reason for the existence of the product or service?" This function represents the fundamental need of the customer. Example: a vacuum cleaner "sucks air" but the customer really needs "remove debris." Whatever this reason for being is, we need to identify this particular function, which we call the task function. You must identify the task function from all of the functions you have listed.
If you happen to find more than one task function, it is quite likely that you have actually taken on two products. For example, a clock-radio has two task functions: tell time and play music. However, you would be far better served by breaking your analysis into two components ” one for telling time, the other for playing music. Alternatively, this product could be considered on a broader basis, as a system ” in which case the task function might be " inform user ," with subordinate functions of "tell time" and "play music."
In any event, once you have identified the task function, you will realize that there are many functions other than the task function. Divide the remaining functions by asking:
"Is the function required for the performance of the task function?"
If the answer to this question is yes, then the function can be termed essential. If the answer is no, then the function can be considered enhancing. All functions other than the task function must be either essential (necessary to the task function) or enhancing. So, your next task is to divide all of the remaining functions into these two general categories.
You can further divide the enhancing functions ” the functions that are not essential to the task function. Enhancing functions influence customer satisfaction and purchase decisions. Enhancing functions always divide into four categories:
-
Ensure dependability
-
Ensure convenience
-
Please senses
-
Delight the customer [4]
None of these categories is needed to accomplish the task function. In fact, if you do not have a task function (and the associated essential functions), you probably do not have a product. The enhancing functions are those issues that purchasers weigh once they have determined that the task function will likely be fulfilled by your product. So, divide all of the enhancing functions into these four categories.
Your next challenge is to create a function hierarchy that will, in finished form, be a function diagram. Start by asking this question: how does the product perform the task function? Primary essential functions provide a direct answer to this question without conditions or ambiguity. Secondary functions explain how primary functions are performed. Continue until the answer to "how" requires using a part name, labor operation, or activity, or you deplete your reserve of essential function cards.
Now, you must reverse this process. Ask "why" in the reverse direction. For example, for a mechanical pencil, the task function is "make marks." One of the functions you must perform to make marks is "support lead." How do you support the lead? You do it by supporting the internal barrel tube (support tube) that carries the lead and by positioning this tube (position tube). Why do you support the tube and position the tube? You do this to support the lead. Why do you support the lead? You support the lead in order to make marks. The "chain" of function is driven by the how questions from the task function to primary then secondary functions ” while this same chain is driven in reverse by why questions from secondary to primary to task function.
As you progress, you will notice that you may be missing functions. If you find that you are, add additional functions as needed. After you have completed building "trees" of functions with the essential functions, repeat this process with the enhancing functions. The only difference is that the primary enhancing functions ” ensure convenience, ensure dependability, please the senses, and delight the customer ” have already been chosen .
When you have finished, you will have a completed product flow diagram. At this point, try to delineate the extent of each function (range, target, specification, etc.) for each of the functions. Do not forget: Extent also tests "measurability" of each active verb-measurable noun combination.
For example, for the mechanical pencil, the assembly may look like Figure 2.1.
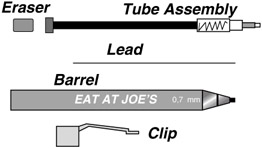
Figure 2.1: Paper pencil assembly.
The sorted brainstorm list of functives may look like this:
Entire project scope:
-
Make marks
-
Erase marks
-
Fit hand
-
Fit pocket
-
Show name
-
Display advertising
-
Convey message
-
Maintain point
Tube assembly:
-
Store lead
-
Position lead
-
Feed lead
-
Reposition lead
-
Support lead
-
Locate eraser
-
Position tube
-
Generate force
-
Hold eraser
Lead:
-
Make marks
-
Maintain point
Eraser:
-
Erase marks
-
Locate eraser
Barrel:
-
Support tube
-
Support lead
-
Position lead
-
Protect lead
-
Position tube
-
Position eraser
-
Show name
-
Display advertising
-
Convey message
-
Fit hand
-
Enhance feel
-
Provide instructions
Clip:
-
Generate force
-
Position clip
-
Retain clip
And, finally, the function diagram (only one possibility among many, many different results) may look like Figure 2.2.
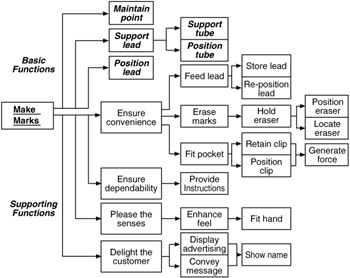
Figure 2.2: Function diagram for a mechanical pencil.
THE PROCESS FLOW DIAGRAM
If you are working with a process rather than a product, you need to create a broad viewpoint "map" that shows how the activities in the process are accomplished. This can be done quickly and easily with a process flow diagram. The difficulty with most process flow diagrams is that they quickly bog down in too much detail. Whenever the detail gets too extensive , people lose interest (except for those who created the chart, but they are only part of the audience). Even though we need detail, we must avoid placing all of the details into one flow chart ” at least if we want people to use the resulting charts . So, we will employ a "10 — 10" method that will aid in both communicating and managing the level of detail in a flow chart.
If you keep the number of boxes in a flow chart to ten or fewer, most people will find your chart easy to read and understand. You can also use a "standard" symbol set for flow charting. After a great deal of trial and error from our experience, we have found that a simple set of ten symbols will explain almost any business process and provide enough options so that any team can easily illustrate what is going on ” see Figure 2.3. By using some of the American National Standards Institute (ANSI) symbols and judiciously mixing in some easy-to-remember shapes , anyone can learn to flow chart a process in just a few minutes. The first step is to select a simple basis or point of view for your flow charts. This could be the view of the process operator, the work piece, or the process owner. (Be careful ” if you confuse your viewpoint while developing a flow chart, you will quickly become confused about the process functions.)
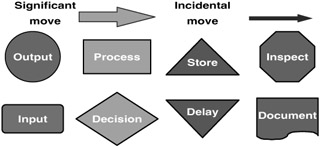
Figure 2.3: Ten symbols for process flow charting.
Inputs and outputs are the easiest steps to understand. You start with an input and you end with an output. A document may be a special kind of input or output ” it can appear at the beginning, at the end, or during the overall process. The process box is the most common box; it describes transformations that occur within the process. Decisions are represented by a diamond shape, and an inspection step (in the shape of a stop sign) is just a special kind of decision. If you delay a process, you use a yield sign. If you store information, you use an inverted yield sign ” a pile.
Movement is also important. If a move is incidental, you tie the associated boxes together with a simple arrow. However, if a movement is complex (say, sending a courier package to Hong Kong as opposed to handing it to your next- cubicle neighbor), then you may have a special transformation or process step that we call a "significant" move, i.e., a large horizontal arrow.
Let us look at a simple process for handling complaints. Your office deals with customer complaints, but you have a local factory (where your office is) and a factory in Japan. How you handle a complaint might look like Figure 2.4.
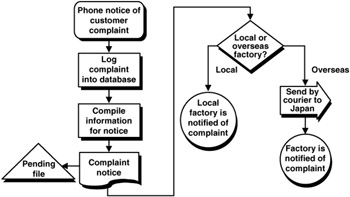
Figure 2.4: Process flow for complaint handling.
This flow chart shows many of the symbols noted above, but it is not the only way that the process could be flow charted. However, if the team that developed the chart (once again, a team approach is likely to be the most effective technique) can reach a high level of consensus, then the communication of these ideas to others will be powerful and comprehensive.
Now that the basics of 10 x 10 (ten steps or fewer using ten or fewer symbols) are apparent, it becomes possible to construct a "hierarchy" of flow charts that will fill in missing details that may have been skirted with the "10 step limit."
The next step is to create a new 10 x 10 flow chart for each box in the top level flow chart that requires additional explanation to reach the desired level of detail. These next flow charts (typically three to five of the boxes require additional detail) make up the second level flow charts. Wherever necessary, go to another level of flow charts; continue creating 10 x 10 flow charts until you have a hierarchy of flow charts that directly addresses all of the details that you feel are important.
Finally, for each process box on each flow chart, you will have a process purpose. Why did you do this step? Simple ” you had one (or possibly two) purposes in mind when you designed this step into your process. Process purpose can be easily described using the language of function. Once again, you must use an active verb and a measurable noun.
Often, a team can move directly to listing process functions from the flow charts. However, especially in manufacturing, it is common for the level of detail hidden in flow charts to be large, especially with intricate or subtle fabrication procedures. You may need to use an additional tool for teasing the "function" information from a flow chart called a "characteristic matrix."
A characteristic matrix is a reasonably simple analysis tool. The purpose of the matrix is to show the relationships between product characteristics and manufacturing steps. The importance of product characteristics in this matrix is significant; by considering the impact of a manufacturing step on product characteristics, we again focus our attention on customer requirements. Too often, manufacturing emphasis turns inward; it is critical that the focus be constantly directed at customers. Of course, there are "internal" customers as well. It is certainly important that intermediate characteristics, necessary for facilitating additional fabrication or assembly activities, be included in the analysis of function.
For example, a simple machining process could have the characteristic matrix shown in Table 2.1.
| Product Characteristic | Target Value | Tolerance | Process Operations | ||||
| Lathe | Lathe | Face | Deburr | Cut | |||
| Turn | Turn | Cut | 40 | Radius | |||
| 10 | 20 | 30 | 50 | ||||
| Diameter "A" | 6.22 mm | ±0.25 mm | X | C | L | ||
| Diameter "B" | 3.25 mm | ±0.1 mm | X | C | L | ||
| Shoulder "C" | 12.2 mm | ±0.5 mm | X | C | L | ||
| Radius "D" | 0.5 mm | ±0.05 mm | X | ||||
| X = Characteristic Created By This Operation | |||||||
| C = Characteristic Used For Clamp Down In This Operation | |||||||
| L = Characteristics Used As Locating Datum In This Operation | |||||||
In this example, a simple machining step could be shown on a process flow chart with a process box that describes the machining operation as "CNC Lathe" or something similar. However, the lathe operation creates several important dimensions, or product characteristics, that are needed to meet customer expectations. These characteristics are sufficiently varied and complex that an additional level of detail is necessary. Some of these characteristics are important to the end customer; some are important to internal or "next step" process stations .
For this example, the three left hand columns establish important functional information. The product characteristic is essentially the "measurable noun" (an occasional adjective is acceptable in a functive if there are several identical nouns, such as diameter in this case). The extent is shown in the target dimension and tolerance columns, and the "active verbs" can be constructed or deduced from the "code letters " inserted in the matrix cells in the "Process Operation" columns.
In any event, whether you are able to determine functions directly from a process flow chart or whether you find the use of characteristic matrices important, you need to end with a comprehensive listing of function. The important aspect of process function is to use a flow charting technique of some type to assist in reaching the comprehensive assessment of function that is similar to the point-by-point listing that can be achieved by the product flow diagram technique.
USING FUNCTION CONCEPTS WITH PRODUCTIVITY AND QUALITY METHODOLOGIES
Earlier, we suggested that function concepts form a powerful fundamental basis for three major productivity and quality methodologies:
-
Quality Function Deployment (QFD)
-
Failure Modes and Effects Analysis (FMEA)
-
Value Analysis (VA)
While we do not intend to explain these techniques fully in this context (however, they will be explained later), we would like to address the usefulness of function concepts in these methodologies. In these discussions, we are assuming that you have a passing or even detailed familiarity with these tools. If not, you may wish to pass over to the discussion of QFD later in this chapter or to Chapters 6 and 12 for lengthy discussions of FMEA and VA.
For Quality Function Deployment, the most challenging issue is the one that we have just explored: how can one determine the functions that must be analyzed for deployment? In other forms, this is the same question facing practitioners in FMEA and VA. Clearly, the product flow diagram provides several instrumental techniques for improving these activities.
A major difficulty in QFD is the often overwhelming complexity of the "House of Quality" approach. Constructing the first house, using conventional QFD techniques, is often the start of the complexity. Many different customer "wants" are listed. This is occasionally done as a "pre-planning" matrix. Moreover, the linguistic construction for these "wants" is undisciplined and subjective .
Similarly, in FMEA, the initial list of failure modes is difficult to obtain. In VA, determining the "baseline" value assessment can also be difficult. [5]
The techniques for developing a function diagram, especially the informal suggestions about "sizing" a project, can be very helpful in this regard. QFD, like FMEA and VA, typically fails to deliver the results expected because the project selected is too complex. A QFD study on a car or truck, for example, could easily contain hundreds of thousands of pages of information. That is not to say that the information in this study would not be valuable or that it should not be done; the issue is how complexity of this type should be dealt with.
If you start with a systemwide view and construct a function diagram of the limited size previously discussed (20-30 functions maximum, even fewer are better), then this will provide a first level in a "hierarchy" of function diagrams. Subsequent analysis of various subsystems, then components and parts, and finally processes will complete the analysis. While the end result (for a car) would conceivably be of the same magnitude, the belief that all of the work must be done within the same team or by the same organization would be quickly abandoned . Moreover, the knowledge and understanding that is developed is generated at the hierarchical level (in the supply chain) of greatest importance, utility, and impact.
Moreover, using the "functive" combination of active verbs and measurable nouns will assist in making QFD a useful tool. The vague, imprecise, or even confusing descriptions of function that are often used in QFD contribute to the difficulty in usage.
A vehicle planning team may carry out a QFD study on the overall vehicle, assessing the major issues regarding the vehicle; these could include size, styling motifs, performance themes, and target markets. Subsequently, a study of the powertrain (engine, transmission, and axles) could be completed by another team. The engine itself could then be divided into major components: block, pistons, electronic controls, and so forth. Ultimately, suppliers of major and minor components alike would be asked to carry out QFD studies on each element. The multiplicity of information is still present, but it is no longer generated in some centralized form. This means that accessibility, usefulness, and the likelihood of beneficial deployment of the findings are much greater. [6]
As an added benefit, starting QFD using this approach provides benefits in the completion of FMEA and VA studies, since a consistent set of functions will be used as a basis for each technique. We will next consider each of these in turn. We will start with FMEA, because the importance of function in this methodology is not widely understood or appreciated.
In FMEA, determining all of the appropriate failure modes is usually a great challenge. This obstacle is reflected in the widespread difficulty in understanding what is a failure mode and what is an effect. For example, the effect "customer is dissatisfied" is often found in FMEA studies. While this is likely to be true, it is an effect of little or no worth in developing and improving products and processes.
Similarly, failure modes are often confused with effect. This can be illustrated with another common product, a disposable razor . How can we determine a comprehensive list of failure modes? Simply start with an appropriate function diagram. For each function, we need to consider how these functions can go astray. There are a limited number of ways that this can occur, all related to function. If you consider the completion of a function (at the desired extent) to be the absence of failure, then pose these questions about each function in the function diagram:
-
What would constitute an absence of function?
-
What would occur if the function were incomplete?
-
What would demonstrate a partial function?
-
What would be observed if there was excess function?
-
What would a decayed function consist of?
-
What would happen if a function occurs too soon or too late (out of desired sequence)?
-
Could there be an additional unwanted function?
Each of these conditions establishes a possible failure mode. For the disposable razor, the task function is generally understood to be "cut hair" (not, of course, to shave). The failure mode that is most obvious is an additional unwanted function, namely "cut skin." Notice that the mode of failure is not "feel pain" or " bleed ;" these are failure effects.
To make use of these ideas in the context of the function diagram, we must next define "terminus" functions. Terminus functions are simply those functions at the right hand (or "how") end of any function chain in the function diagram. In the mechanical pencil example, two terminus functions would be "position eraser" and "locate eraser." Why do you position and locate the eraser? To hold the eraser. Why do you hold the eraser? To erase marks. Why do you erase marks? To ensure correctness. Since this chain is one of enhancing functions, we do not directly modify the task function.
Start your analysis of failure modes by testing each of the possible conditions listed above against the terminus functions. After you have completed the terminus functions, move one step in the "why" direction. However, as you move to the left, you will find that you frequently discover the same modes for the other functions. Since the function chain shows the interrelated nature of the functions, this should not be surprising. As a rule, you will get most (if not all) of the relevant failure modes from the terminus functions. [7] So, starting with the terminus functions will speed your work and reduce redundancy.
By working through each function chain in the function diagram, a comprehensive list of failure modes can be developed. This listing of failure modes then alters the approach to FMEA substantially; modes are clear, and cause-effect relationships are easier to understand. Moreover, developing FMEA studies using function diagrams that were originally constructed as part of the QFD discipline assures that product development activities continue to reflect the initial assumptions incorporated in the conceptual planning phase of the development process. [8]
Once you have identified failure modes in association with functions, the remainder of the FMEA study ” though still involved ” is rather mechanical. For each failure mode, you must examine the likely effects that will result from this mode. With a clear mode statement, this is much simpler, and you are much less likely to confuse mode and effect issues. The effects can then be rated for severity using an appropriate table. With the effects in hand, causes can next be established and the occurrence rating estimated. Notice that this sequence of events makes the confusion of cause and effect much more difficult; in many cases, the logical improbability of reversal of cause and effect statements is so obvious that you simply cannot reverse these two issues.
Finally, you can conclude the fundamental analysis with an evaluation of controls and detection. Once again, starting with a statement of function makes this clearer and less subject to ambiguity. Understanding the progression from function to mode to cause to effect sets the stage. What is it that you expect to detect? Is it a mode? In practice, detecting modes is extremely unlikely . You are more likely to detect effects. However, are effects what you want to detect? Once an effect is seen the failure has already occurred, and costs associated with the failure must already be absorbed.
Let us return to the disposable razor to understand this. If the failure mode is "cut skin," we must recognize that detecting "cut skin" is extremely difficult. You are much more likely to detect an effect ” namely, pain or bleeding. Now, we recognize that we really do not want to detect failures at this point. Instead, we need to ask what are the possible causes of this failure mode. In this simple example, two different causes are readily apparent. From a design standpoint, the blades of the razor could be designed at the wrong angle to the shaver head. Even if the manufacturing were 100% accurate, a design that sets the blade angle incorrectly would have terrible consequences. On the other hand, the design could be correct; the blade angle could be specified at the optimum angle, but it could be assembled at an incorrect angle. Detection would best be aimed at testing the design angle [9] and at controlling the manufacturing process so that the optimum design angle would be repeatable (within limits) in production. [10]
Finally, the Value Analysis process can also make use of the function diagrams that serve in the QFD and FMEA processes. In VA, the essence of the technique is the association of cost with function. Once this is accomplished, the method of functional realization can be considered in a variety of "what if" conditions. If there is a comprehensive statement of function, VA teams can be reasonably sure that ongoing value assessments, based on the ratio of function to cost, have a consistent and rational foundation. Moreover, the teams have a much higher confidence that these "what if" questions take customer issues into proper account.
Too often, VA activities are carried out as if function is well understood and only cost matters. In too many cases, no function analysis is even performed. Despite the long-standing cautions against this, this alluring shortcut is often taken to save time, money, or both. The shortcomings of skipping function analysis in VA are not trivial. More disappointing results in usage of the VA methodology have probably been obtained because function was not fully and comprehensively understood.
At a very fundamental level, how can a value ratio analysis be performed without a full statement of function? This is like calculating a return on investment without knowing the investment. Moreover, the analysis of value ratio can be misleading if the function issue is not well defined. It is easy to reduce cost. You simply eliminate features and functions from a product. Soon, you will not even be able to accomplish the task function. (In practice, "functionless" VA studies typically eliminate important enhancing functions that make a critical difference in the marketplace, and customers consequently pronounce unfavorable judgments on "decontented" products. VA then gets the blame.)
Since value studies typically occur subsequent to QFD and FMEA in product development activities, the difficulty of understanding function is eliminated if function is fully defined and even specified during these earlier activities. By using function as the basis for product and manufacturing activities, a degree of focus and understanding of customer wants and needs is preserved not only during VA activities but throughout the product life cycle.
[1] When you do this, you have created a "specification" for this function.
[2] One of the most common and debilitating errors in market analysis is to assume that others will respond the same way that you do. This is a simple but profound delusion. Most of us think that we are normal, typical people. When we awaken in the morning, we look in the mirror and see a normal (although perhaps disheveled if we look before the second cup of coffee) person. Thus, we think, "I like this widget. Since I am normal, most other people will like this widget, too. Therefore, my tastes are likely to be a good guideline to what my customers will want." In most cases, even if you really are "normal" and even "typical," this easy generalization is dangerously false.
[3] Do not automatically toss out strange ideas ” see if the team can reword or express more clearly the idea that underlies the oddball cards or notes. Some percentage of these cards will have important information. Many will be eventual discards, but do not jump to conclusions.
[4] "Delight the customer" is actually quite rare ” most enhancing functions fit one of the other three categories. If you do find a "delight the customer" function, try comparing this with an "excitement" feature in a Kano analysis; you should find that the function fits both descriptions.
[5] In Value Analysis, the Function Analysis System Technique or "FAST," a close cousin of the function diagram, is typically used to establish the initial functional baseline for value calculations.
[6] If the reader sees an "echo" of the hierarchy of flow charts, this is not coincidental.
[7] This is even more true for a system FMEA than for a design FMEA study.
[8] Of course, any change that is made in concept during development activities requires a continuous updating of the function diagrams under consideration.
[9] In the ISO and QS-9000 systems, we can think of this in terms of design verification.
[10] This is the issue of "process control" in the ISO and QS-9000 systems ” in QS-9000, it goes to the heart of the control plan itself. Also, this is a simplified example. In more detail, the failure mode of "cut skin" can even occur when the blade angle is correct both in design and execution. A deeper examination of these issues quickly leads to the consideration of "robustness" in the design itself.
EAN: 2147483647
Pages: 235