Resolving Deadlock Problems
Deadlocks befuddle many programmers and are the bane of many applications. A deadlock occurs when, without some intervening action, processes cannot get the locks they need no matter how long they wait. Simply waiting for locks is not a deadlock condition. SQL Server automatically detects the deadlock condition and terminates one of the processes to resolve the situation. The process gets the infamous error message 1205 indicating that it was selected as the "victim" and that its batch and the current transaction have been canceled . The other process can then get the locks it needs and proceed. The two general forms of deadlocks are cycle deadlocks and conversion deadlocks . (See Chapter 13 for more information about these two kinds of deadlocks.)
Cycle Deadlock Example
If you repeatedly run the following two transactions simultaneously from different Osql.EXE sessions, you are nearly assured of encountering a " deadly embrace" (cycle deadlock) almost immediately from one of the two processes. It should be clear why: one of the processes gets an exclusive lock on a row in the authors table and needs an exclusive lock on a row in the employee table. The other process gets an exclusive lock on the row in employee , but it needs an exclusive lock for the same row in authors that the first process has locked.
-- Connection 1 USE pubs WHILE (1=1) BEGIN BEGIN TRAN UPDATE employee SET lname='Smith' WHERE emp_id='PMA42628M' UPDATE authors SET au_lname='Jones' WHERE au_id='172-32-1176' COMMIT TRAN END -- Connection 2 USE pubs WHILE (1=1) BEGIN BEGIN TRAN UPDATE authors SET au_lname='Jones' WHERE au_id='172-32-1176' UPDATE employee SET lname='Smith' WHERE emp_id='PMA42628M' COMMIT TRAN END |
The result is the dreaded error 1205 (shown below) from one of the connections. The other connection continues along as if no problem occurred.
Msg 1205, Level 13, State 2 Your server command (process id 12) was deadlocked with another process and has been chosen as deadlock victim. Re-run your command |
If you simply rewrite one of the batches so that both batches first update authors and then update employee , the two connections will run forever without falling into a cycle deadlock. Or you can first update employee and then update authors from both connections. Which table you update first doesn't matter, but the updates must be consistent and you must follow a known protocol. If your application design specifies a standard protocol for accessing the tables consistently, one of the connections gets the exclusive page lock on the first table and the other process must wait for the lock to be released. Simply waiting momentarily for a lock is normal and usually fast, and it happens frequently without your realizing it. It is not a deadlock.
Conversion Deadlock Example
Now run the following transaction simultaneously from two different OSQL.EXE sessions. You're running the same script, so it's obvious that the two processes follow a consistent order for accessing tables. But this example quickly produces a deadlock. A delay has been added so that you encounter the race condition more quickly, but the condition is lurking there even without the WAITFOR DELAY ”the delay just widens the window.
USE pubs SET TRANSACTION ISOLATION LEVEL REPEATABLE READ BEGIN TRAN SELECT * FROM authors WHERE au_id='172-32-1176' -- Add 5 sec sleep to widen the window for the deadlock WAITFOR DELAY "00:00:05" UPDATE authors SET au_lname='Updated by ' + CONVERT(varchar, @@spid) WHERE au_id='172-32-1176' COMMIT TRAN |
You can correct this example in a couple of ways. Does the isolation level need to be Repeatable Read? If Read Committed is sufficient, simply change the isolation level to get rid of the deadlock and to provide better concurrency. If you use Read Committed isolation, the shared locks can be released after the SELECT, and then one of the two processes can acquire the exclusive lock it needs. The other process waits for the exclusive lock and acquires it as soon as the first process finishes its update. All operations progress smoothly, and the queuing and waiting happen invisibly and so quickly that it is not noticeable to the processes.
But suppose that you need Repeatable Read (or Serializable) isolation. In this case, you should serialize access by using an update lock, which you request using the UPDLOCK hint. Recall from Chapter 13 that an update lock is compatible with a shared lock for the same resource. But two update locks for the same resource are not compatible, and update and exclusive locks are also not compatible. Acquiring an update lock does not prevent others from reading the same data, but it does ensure that you are first in line to upgrade your lock to an exclusive lock if you subsequently decide to modify the locked data. (The important issue here is that the exclusive lock can be acquired , so this technique works equally well even if that second statement is a DELETE and not an UPDATE, as in this example.)
By serializing access to the exclusive lock, you prevent the deadlock situation. The serialization also reduces concurrency, but that's the price you must pay to achieve the high level of transaction isolation. A modified example follows ; multiple simultaneous instances of this example will not deadlock. Try running about 20 simultaneous instances and see for yourself. None of the instances deadlock and all complete, but they run serially . With the built-in 5-second sleep, it takes about 100 seconds for all 20 connections to complete because one connection completes about every 5 seconds. This illustrates the lower concurrency that results from the need for higher levels of consistency (in this case, Repeatable Read).
USE pubs SET TRANSACTION ISOLATION LEVEL REPEATABLE READ BEGIN TRAN SELECT * FROM authors (UPDLOCK) WHERE au_id='172-32-1176' -- Add 5 sec sleep to widen the window for the deadlock WAITFOR DELAY "00:00:05" UPDATE authors SET au_lname='Updated by ' + CONVERT(varchar, @@spid) WHERE au_id='172-32-1176' COMMIT TRAN |
As a general strategy, add the UPDLOCK hint (or some other serialization) if you discover during testing that conversion deadlocks are occurring. Or add UPDLOCK from the outset because you detect from your CRUD analysis that deadlocks are likely, and then try backing it off during multiple- user testing to see if it is absolutely necessary. Either approach is viable . If you know that in most cases the read-for-update (discussed later) will follow with an actual update, you might opt for the UPDLOCK hint from the outset and see if you can back it off later. But if the transaction is short and you will later update the data in most cases, there isn't much point in backing off the update lock. The shared lock will need to upgrade to an exclusive lock, so getting the update lock in the first place makes good sense.
Preventing Deadlocks
Deadlocks can usually be avoided, although you might have to do some detailed analysis to solve the problems that cause them. Sometimes the cure is worse than the ailment, and you're better off handling deadlocks rather than totally prevent- ing them, as we'll discuss in the next section. Preventing deadlocks ( especially conversion deadlocks) requires a thorough understanding of lock compatibility. These are the main techniques you can use to prevent deadlocks:
- To prevent cycle deadlocks, make all processes access resources in a consistent order.
- Reduce the transaction isolation level if it's suitable for the application.
- To prevent conversion deadlocks, explicitly serialize access to a resource.
Deadlock prevention is a good reason to use stored procedures. By encapsulating the data access logic in stored procedures, it's easier to impose consistent protocols for the order in which resources (for example, tables) are accessed, which can help you avoid cycle deadlocks. But in so doing, you do not reduce the likelihood of conversion deadlocks. As noted above, conversion deadlocks are best dealt with by serializing access to a resource or by lowering the transaction isolation level if appropriate. The most common scenario for conversion deadlocks is the read-for-update situation. If a resource will be read within a transaction requiring Repeatable Read or Serializable isolation and will be updated later, you should request an update lock on the read using the UPDLOCK hint. The update lock will let other users read the data but will prevent them from updating the data or doing a read-for-update. The net effect is that once the update lock is acquired, the process will be next in line for the exclusive lock needed to actually modify it.
Handling Deadlocks
The cost of serializing access is that other users wanting to read-for-update (or actually update or delete) must wait. If you are not experiencing deadlocks, serializing access might needlessly reduce concurrency. You might have a case in which a transaction often does a read-for-update but only infrequently does the update. In this case, deadlocks might be infrequent. The best course of action might be to not prevent deadlocks and simply deal with them when they occur.
Preventing deadlocks can significantly reduce concurrency because the read-for-update would be blocked. Instead, you can simply write your applications to handle deadlocking. Check for deadlock message 1205, and retry the transaction. With retry logic, you can live with moderate deadlock activity without adding a lot of serialization to the application. It's still a good idea to keep count of how often you experience deadlocks; if the incidence is high, the wasted effort and constant retrying are likely to be worse than the cost of preventing the deadlock in the first place. How you write the deadlock handler will depend on the language or tool you use to build your application. But an application that is prone to deadlocks should have a deadlock handler that retries. Such a handler must be written in the host language. There is no way to do a retry directly within a stored procedure or a batch, since deadlock error 1205 terminates the batch.
Volunteering to Be the Deadlock Victim
Recall from Chapter 13 that the LOCK_MONITOR process in SQL Server typically chooses as the deadlock victim the process that made the final lock request that closed the loop and created a circular chain. But a process can also offer to "sacrifice itself" as the victim for deadlock resolution. You can make this happen by using the SET DEADLOCK_PRIORITY LOW NORMAL statement. If a process has a deadlock priority of LOW and the other participating process is NORMAL (the default), the LOW process is chosen as the victim even if it was not the process that closed the loop.
In the deadlock examples shown earlier, you saw that the default victim is the process that you started second, since it closes the loop. However, adding SET DEADLOCK_PRIORITY LOW to one of the connections (and not the other) indicates that it will be selected as the victim, even if it was started first. You might find this useful if, for example, you are doing reporting and OLTP on the same database and you occasionally have deadlocks, and you know that one process is more important than the other. You set the less important process to LOW. It might also be useful if one application was written with a good deadlock handler and the other was not. Until the application without the handler can be fixed, the "good" application can make the simple change of volunteering itself and then handle a deadlock with retry logic when the deadlock occurs later.
Watching Locking Activity
Locking problems often result from locks that you don't even realize are being taken. You might be updating only table A, but blocking issues arise on table B because of relationships that you don't realize exist. If, for example, a foreign key relationship exists between table A and table B and the update on A is causing some query activity to B, some shared locks must exist. Or a trigger or a nested call to another procedure might cause some locking that isn't obvious to you.
In cases like these, you must be able to watch locks to look for locking operations that you weren't aware of. The graphical lock display of SQL Server Enterprise Manager is the most convenient way to watch locking in many cases. However, SQL Server Enterprise Manager provides only a snapshot of the current state of locking; you can miss a lot of locking activity that occurs in the time it takes you to refresh the display.
Identifying the Culprit
As with most debugging situations, the hardest part of solving a problem with locking is understanding the problem. If you get complaints that "the system is hung," it's a good bet that you have a blocking problem. Most blocking problems happen because a single process holds locks for an extended period of time. A classic case (as we discussed earlier) is an interactive application that holds locks until the user at the other end takes an action, such as clicking a button to commit the transaction or scrolling to the end of the output, which causes all the results to be processed . If the user goes to lunch and doesn't take that action, everyone else might as well grab lunch too, because they're not going to get much work done. Locks pile up, and the system seems to hang. The locks in the system are reported in the pseudo_system table, syslockinfo in the master database. (We'll discuss a related pseudo_system table, sysprocesses , later in the chapter.)
NOTE
The pseudo_system tables are not maintained as on-disk structures. Locking and process data are by definition relevant only at runtime. So syslockinfo and sysprocesses are presented as system tables, and although they can be queried just like other system tables, they do not have on-disk storage as normal tables do.
A big challenge in trying to identify the cause of blocking is that when you experience such problems, you probably have hundreds or thousands of locks piled up. At these times, it's hard to see the trees through the forest. Usually, you just want to see which process is holding up everyone else. Once you identify it, of course, you need to immediately get it out of the way, either by forcing it to complete or, if necessary, by issuing the KILL command on the connection. The longer- term solution is to rework the application so that it will not hold locks indefinitely.
SQL Server Enterprise Manager, shown in Figure 14-3, provides a graphical way to watch locking activity; this is the best method most of the time. From the Management folder, choose Current Activity. You can look at locks either by process or by object. If you select the Locks / Process ID option, the graphic shows which processes are blocked and which processes are blocking. When you double-click on the process in the right pane, you see the last command the process issued. This is what Figure 14-3 shows. You can then send a message to the offending user to complete the transaction (although this is a short-term solution at best). Or you can kill the process from SQL Server Enterprise Manager ”which isn't ideal, but sometimes it's the best short-term course of action. You can select a particular process from the left pane, under the Locks / Process ID option, and the right pane will show all the locks held by that process.
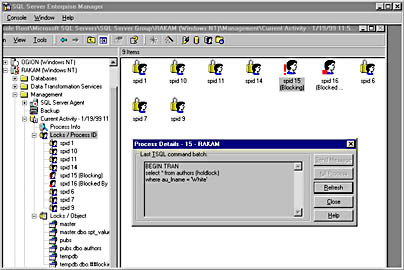
Figure 14-3. Viewing the last batch issued by a blocking process in SQL Server Enterprise Manager.
Alternatively, you can select the Locks/Objects option under Current Activity. The left pane displays a graphic of each locked object. If you then select one of these objects, the right pane shows which processes have that object locked. Again, when you double-click on the process in the right pane, you see the last command the process issued.
But sometimes even SQL Server Enterprise Manager can get blocked by locking activity in tempdb , so it's useful to know how to monitor-lock the old-fashioned way, by using system stored procedures or querying directly from the syslockinfo table. You start by running sp_who2 and sp_lock . Most people are familiar with sp_who but not sp_who2 , which works in almost the same way but formats the output in a more readable way and contains more of the columns from the sysprocesses table. However, sysprocesses contains additional information that neither sp_who nor sp_who2 reports , so you might even want to write your own sp_who3 ! We'll look at the sysprocesses table in more detail later in this chapter.
The BlkBy column of the sp_who2 output shows the ID ( spid ) of a blocking process. The procedure sp_lock provides a formatted and sorted listing of syslockinfo that decodes the lock types into mnemonic forms (such as update_page instead of type 7 ). In Chapter 13, we looked at output from sp_lock to watch the various types and modes of locking. If your users say that the system is hung, try to log on and execute sp_who2 and sp_lock . If you can log on and execute these procedures, you immediately know that the system is not hung. If you see a nonzero spid in the BlkBy column of the sp_who2 output or if the Status value is WAIT in the sp_lock output, blocking is occurring. It's normal for some blocking to occur ”it simply indicates that one process is waiting for a resource held by another. If such contention didn't exist, you wouldn't even need to lock. But if you reissue the query for lock activity a moment later, you expect to find that same blockage cleared up. In a smoothly running system, the duration that locks are held is short, so long pileups of locks don't occur.
When a major lock pileup occurs, you can get a lengthy chain of processes blocking other processes. It can get pretty cumbersome to try to track this manually. You can create a procedure like the following to look for the process at the head of a blocking chain:
CREATE PROCEDURE sp_leadblocker AS IF EXISTS (SELECT * FROM master.dbo.sysprocesses WHERE spid IN (SELECT blocked FROM master.dbo.sysprocesses)) SELECT spid, status, loginame=SUBSTRING(SUSER_NAME(suid), 1, 12), hostname=substring(hostname, 1, 12), blk=CONVERT(char(3), blocked), dbname=substring(db_name(dbid), 1, 10), cmd, waittype FROM master.dbo.sysprocesses WHERE spid IN (SELECT blocked FROM master.dbo.sysprocesses) AND blocked=0 ELSE SELECT "No blocking processes found!" |
Once you identify the connection ( spid ) causing the problem, check to see the specific locks that it is holding. You can query from syslockinfo for this, but simply running sp_lock spid will probably give you exactly what you need. There might be multiple separate lock chains, in which case the batch will return more than one spid . You can follow the same procedure for each one.
The syslockinfo Table
If a lot of blocking is going on, you might want to take a look at all locks held that are blocking other users. You can use the procedure sp_blockinglocks (which is not a part of the installed SQL Server product but is included on the companion CD) to print out a list of all locks held that are blocking other processes. The procedure examines the syslockinfo table for resources that have more than one lock listed and are held by different processes with different status values. For example, if process 12 has an X lock on the sales table with a status of GRANT and process 13 is trying to read from that table, the output of sp_blockinglocks looks like this:
spid dbid ObjId IndId Type Resource Mode Status ------ ------ ----------- ------ ---- ---------------- -------- ------ 12 5 437576597 0 TAB X GRANT 13 5 437576597 0 TAB IS WAIT |
It can also be useful to see the last command issued by a blocking process; you can do this by double-clicking on a process ID in the Current Activity panes of SQL Server Enterprise Manager. Use DBCC INPUTBUFFER (spid) for this ”which is the same thing SQL Server Enterprise Manager does when you double-click on a process. DBCC INPUTBUFFER reads the memory from within the server that was used for the last command. So DBCC INPUTBUFFER can access whatever command is still in the buffer for a given connection, even if it has already been executed.
Usually, by this point you have enough of a handle on the problem to turn your attention to the application, which is where the resolution will ultimately lie. But if you need or want to go a bit further, you can find out the depth at which the connection is nested within a transaction. Blocking problems often happen because the connection doesn't realize the nested depth and hasn't applied the correct pairing of COMMIT commands. (Chapter 10 discusses the scoping and nesting levels of transactions.) A connection can determine its own nesting depth by querying @@TRANCOUNT. Starting with SQL Server 7, you can also determine the nesting level of any current connection, not just your own. This involves inspecting the sysprocesses table directly because the information is not included in either sp_who or sp_who2 .
The sysprocesses Table
As we mentioned, some columns in the sysprocesses table don't show up in the output of either sp_who or sp_who2 . Table 14-1 depicts these columns.
Table 14-1. Columns in the sysprocesses table that aren't available via sp_who or sp_who2 .
| Column Name | Data Type | Description |
|---|---|---|
| waittype | binary(2) | The waittypes of 1 through 15 correspond to the mode of lock being waited on. (See list on the following page.) Hex values 0x40 through 0x4f correspond to miscellaneous waits. 0x81 is a wait to write to the log. 0x400 through 0x40f are latch waits. 0x800 is a wait on a network write. |
| waittime | int | Indicates current wait time in milliseconds . Value is 0 when the process is not waiting. |
| lastwaittype | nchar(32) | A string indicating the name of the last or current wait type. |
| waitresource | nchar(32) | A textual representation of a lock resource. |
| memusage | int | Indicates number of pages in the memory cache that are currently allocated to this process. A negative number means that the process is freeing memory allocated by another process. |
| login_time | datetime | Indicates time when a client process logged on to the server. For system processes, indicates time when SQL Server startup occurred. |
| ecid | smallint | An execution context ID that uniquely identifies the subthreads operating on behalf of a single process. |
| open_tran | smallint | Indicates current transaction nesting depth for the process. |
| sid | binary(85) | A globally unique identifier (GUID) for the user. |
| hostprocess | nchar(8) | The workstation process ID number. |
| nt_domain | nchar(128) | The Windows NT domain for the client. |
| nt_username | nchar(128) | The Windows NT username for the process. |
| net_address | nchar(12) | An assigned unique identifier for the network interface card on each user's workstation. |
| net_library | nchar(12) | The name of the client's network library DLL. |
The procedure sp_who2 translates the dbid into a database name and translates the numeric value for its status into a string. The most common status values you'll see are BACKGROUND, ROLLBACK, DORMANT (used when a connection is being retained while waiting for Remote Procedure Call [RPC] processing), SLEEPING, and RUNNABLE.
The values that the sysprocesses table holds in the waittype column are the same ones you'll see in the req_mode column of syslockinfo . They can be translated as follows:
Lock Mode value --------- ----------- Sch-S 1 Sch-M 2 IS 3 SIU 4 IS-S 5 IX 6 SIX 7 S 8 U 9 IIn-Nul 10 IS-X 11 IU 12 IS-U 13 X 14 BU 15 |
The Trace Flag for Analyzing Deadlock Activity
Trace flags are useful for analyzing deadlock situations. When a process is part of a deadlock, the victim process realizes that the deadlock occurred when it gets error message 1205. Any other process participating in the deadlock is unaware of the situation. To resolve the deadlock, you probably want to see both processes; trace flag 1204 provides this information.
The following is a fragment of the output from sqlservr .exe, which was started from the command line using _T1204. This example uses the conversion deadlock script that we used previously ”issuing the same batch from two connections ”to illustrate the output of trace flag 1204. To capture deadlock information, SQL Server must be started from a command prompt. You can specify a special location for the error log, which will contain all the same information that is displayed on the command screen while SQL Server is running.
sqlservr _c _T1204 _eDEADLOCKTRACE.out 1999-01-19 15:20:11.70 spid2 *** Deadlock Detected *** 1999-01-19 15:20:11.70 spid2 ==> Process 8 chosen as deadlock victim 1999-01-19 15:20:11.70 spid2 == Deadlock Detected at: 1999-01-19 15:20:11.70 1999-01-19 15:20:11.70 spid2 == Session participant information: 19990119 15:20:11.70 spid2 SPID: 7 ECID: 0 Statement Type: UPDATE Line #: 7 1999-01-19 15:20:11.70 spid2 Input Buf: S E T T R A N S A C T I O N I S O L A T I O N L E V E L R E P E A T A B L E R E A D B E G I N T R A N S E L E C T * F R O M a u t h o r s W H E R E a u _ i d = ' 1 7 2 3 2 1 1 7 6 ' - - A d d s l e e p t o w i d e n t h e w i n d o w f o r t h e d e a d l o c k W A I T F O R D E L A Y " 0 0 : 0 0 : 0 5 " U P D A T E 1999 0119 15:20:11.70 spid2 SPID: 8 ECID: 0 Statement Type: UPDATE Line #: 7 19990119 15:20:11.70 spid2 Input Buf: S E T T R A N S A C T I O N I S O L A T I O N L E V E L R E P E A T A B L E R E A D B E G I N T R A N S E L E C T * F R O M a u t h o r s W H E R E a u _ i d = ' 1 7 2 3 2 1 1 7 6 ' - - A d d s l e e p t o w i d e n t h e w i n d o w f o r t h e d e a d l o c k W A I T F O R D E L A Y " 0 0 : 0 0 : 0 5 " U P D A T E 1999-01-19 15:20:11.71 spid2 1999-01-19 15:20:11.71 spid2 == Deadlock Lock participant information: 1999-01-19 15:20:11.71 spid2 == Lock: KEY: 5:117575457:1 (0afe9ce59186) 1999-01-19 15:20:11.71 spid2 Database: pubs 1999-01-19 15:20:11.71 spid2 Table: authors 1999-01-19 15:20:11.71 spid2 Index: UPKCL_auidind 1999-01-19 15:20:11.71 spid2 - Held by: SPID 7 ECID 0 Mode "U" 1999-01-19 15:20:11.71 spid2 - Requested by: SPID 8 ECID 0 Mode "U" 1999-01-19 15:20:11.71 spid2 == Lock: KEY: 5:117575457:1 (0afe9ce59186) 1999-01-19 15:20:11.71 spid2 Database: pubs 1999-01-19 15:20:11.71 spid2 Table: authors 1999-01-19 15:20:11.71 spid2 Index: UPKCL_auidind 1999-01-19 15:20:11.71 spid2 - Held by: SPID 8 ECID 0 Mode "S" 1999-01-19 15:20:11.71 spid2 - Requested by: SPID 7 ECID 0 Mode "X" |
This output shows the spid for both processes affected, shows a fragment of their input buffer (but not the entire command), and notes that neither process can upgrade its locks because of the circular relationship. Process 8 requests an update lock on a key that process 7 already has an update lock on. At the same time, process 7 requests an exclusive lock on a key that process 8 already has a shared lock on. Thus the two processes are in a circular relationship. The output can help you solve the problem ”you know the processes involved and the locks that could not be acquired, and you have an idea of the commands being executed.
You might also notice, if you scrutinize the trace flag output in the error log carefully , that trace flag 1206 is turned on. Used in conjunction with trace flag 1204, this flag produces some of the actual object name information that you see in the output above. SQL Server automatically enables this flag when 1204 is turned on.
NOTE
The number assigned to trace flag 1204 is intended to be easy to remember. Recall that error 1205 is the well-known error message an application receives when it is chosen as the deadlock victim.
EAN: 2147483647
Pages: 144
- Key #3: Work Together for Maximum Gain
- Key #4: Base Decisions on Data and Facts
- Beyond the Basics: The Five Laws of Lean Six Sigma
- Making Improvements That Last: An Illustrated Guide to DMAIC and the Lean Six Sigma Toolkit
- The Experience of Making Improvements: What Its Like to Work on Lean Six Sigma Projects