6.4. Graphing Variables in a Model
| < Day Day Up > |
| The next method is very useful if you build a model and want to see the results against various criteria. Let's assume you have multiple values in a table, and you want to input them into a model and store the result. This would normally be a very time-consuming process. However, by leveraging VBA, you can do it rather easily. For this example, we use a table with three fields: sales, full-time equivalent (FTE), and contribution. The table uses an Excel workbook that uses the sales and FTE inputs to return a contribution profit number. This method is obviously more useful in a more complex model, but this simple example will demonstrate how it works. Note that in this example, the code opens a workbook that already exists; your path and filename will be different. Example 6-7 also uses a worksheet called "Model" in the workbook. Example 6-7. Profit Model example Public Sub ProfitModel( ) Dim xlapp As Excel.Application Dim xlwb As Excel.Workbook Dim xlws As Excel.Worksheet Dim adors As ADODB.Recordset Set xlapp = New Excel.Application xlapp.Visible = True Set xlwb = xlapp.Workbooks.Open("C:\BookInformation\Chapter6\ProfitModel.xls") Set xlws = xlwb.Sheets("Model") Set adors = New ADODB.Recordset adors.Open "tbl_ProfitModel", CurrentProject.Connection, _ adOpenDynamic, adLockOptimistic adors.MoveFirst While Not adors.EOF xlws.Range("B10").Value = adors.Fields("Sales").Value xlws.Range("B6").Value = adors.Fields("FTE").Value adors.Fields("Contribution").Value = xlws.Range("B18").Value adors.MoveNext Wend adors.Close xlwb.Close False Set xlws = Nothing Set xlwb = Nothing xlapp.Quit Set xlapp = Nothing Set adors = Nothing End SubThis opens the Excel workbook shown in Figure 6-8. Figure 6-8. A very simplistic contribution profit model that takes various assumptions to come up with a result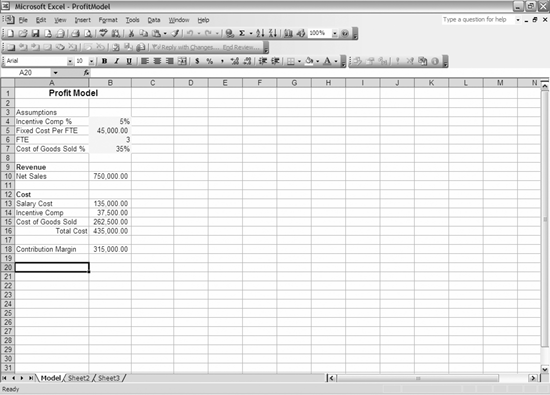 For every record in the table, the code takes the sales and FTE assumption and places the values in the model. Then it takes the resulting contribution and stores the result in the table. You can use the data from this table with one of the graphing procedures we made earlier to graph the results. You can certainly store all of the variables in the table, or just change one variable at a time and hold all of the other variables constant. Your choice is driven by the reason for the modeling. However, you could use this code after changing only the Ranges and field names. |
| < Day Day Up > |
EAN: 2147483647
Pages: 132