Section 6.8. Kernel Support for Debugging, Diagnostics, and Tracing
6.8. Kernel Support for Debugging, Diagnostics, and TracingIn this section, we will look at various facilities in the Mac OS X kernel for both kernel-level and application-level debugging, diagnostics, and tracing. Note that we will not discuss how to actually use the kernel debuggers herewe visit that topic in Chapter 10, in the context of creating kernel extensions. 6.8.1. GDB (Network-Based or FireWire-Based Debugging)The most convenient way to perform kernel-level debugging on Mac OS X is through the GNU debugger, GDB, which supports either a network-based or FireWire-based kernel debugging configuration, both of which require two machines.
The standard Mac OS X kernel includes support for two-machine network-based debugging using GDB. In the network-based configuration, GDB running on the debugging machine communicates over Ethernet with a stub in the target machine's kernel. This remote debugger protocol is called the Kernel Debugging Protocol (KDP). It uses a variant of TFTP over UDP as the core transfer protocol. The default debugger-side UDP port number is 41139. The following are examples of requests in the KDP protocol:
Each KDP requestand the corresponding replyhas its own packet format. Note that the target-side in-kernel KDP implementation does not use the kernel's networking stack but has its own minimal UDP/IP implementation. Two fundamental functions used by the KDP implementation are for sending and receiving protocol packets. A network driver that supports kernel debugging must provide polled-mode implementations of these two functions: sendPacket(), the transmit handler, and receivePacket(), the receive handler. These functions are used only when the kernel debugger is active.
Since a network driver must explicitly support KDP, remote debugging is possible only when using network interfaces driven by such drivers. In particular, the AirPort driver does not support KDP. Hence, remote debugging cannot be done over a wireless network. In the FireWire debugging configuration, KDP is used over a FireWire cable courtesy of a kernel extension (AppleFireWireKDP.kext) on the target machine and a translator program (FireWireKDPProxy) on the debugger machine. The translator routes data between the FireWire connection and UDP port 41139 on the debugger systemthat is, it acts as a local proxy for the target machine. GDB still performs network-based debugging, except that it communicates with localhost instead of directly communicating with the shim on the target machine. 6.8.2. KDB (Serial-Line-Based Debugging)Although GDB is typically sufficient as a kernel debugger, the Mac OS X kernel also supports a built-in kernel debugger called KDB, which is more suitableand in some cases may be the only optionfor debugging low-level kernel components. Since remote debugging with GDB uses network or FireWire hardware, it cannot be used for kernel debugging before the required hardware is operational. For example, debugging the built-in Ethernet hardware used by GDB or low-level hardware interrupt handlers requires the use of the built-in debugger.
KDB's nature and functionality are roughly similar to that of the kdb debugger in BSD variants. KDB also requires two machines for debugging, although the entire debugger is built into the kernel. You interact with KDB over a serial line, which means that both the target machine and the debugging machine must have serial ports. Whereas the debugging machine can have any type of serial port, including those provided by USB-based or PCI-based serial port adapters, the target machine must have a built-in hardware serial porttypically on the main logic board. Xserve is an example of a system model that has such a real serial port. Recall the discussion of kprintf() initialization from Chapter 5. Serial output from kprintf() is disabled unless DB_KPRT is set in the debug boot argument. When debug output to a serial port is enabled, kprintf() requires a serial device that can be directly addressed, since scc_putc() performs polled I/Oit directly reads and writes serial chip registers. This allows debugging to work even with interrupts disabled. Figure 629 shows an excerpt from the initialization of the kprintf() function. Figure 629. Initialization of the kprintf() function
Moreover, unlike GDB-based remote debugging, which works with the default Mac OS X kernel, using KDB requires building a custom kernel with the DEBUG configuration (see Section 6.10 for a discussion of kernel compilation). 6.8.3. CHUD SupportThe Computer Hardware Understanding Development (CHUD) Tools software is a suite of graphical and command-line programs for measuring and optimizing software performance on Mac OS X.[13] It is also used for benchmarking and analyzing various aspects of system hardware. Besides user-space programs, the CHUD Tools suite employs kernel extensions (CHUDProf.kext and CHUDUtils.kext), which export a variety of functions to the user space through I/O Kit user clients.[14] Finally, the kernel implements several functions and callback hooks for use by CHUD software. The bsd/dev/ppc/chud/ and osfmk/ppc/chud/ directories contain the implementations of these functions and hooks. Many of the functions are analogous to functions in the Mach API. The CHUD-related functions and hooks in the kernel can be categorized as described in the following subsections.
6.8.3.1. Task-Related FunctionsExamples include chudxnu_current_task(), chudxnu_task_read(), chudxnu_task_write(), chudxnu_pid_for_task(), chudxnu_task_for_pid(), chudxnu_current_pid(), and chudxnu_is_64bit_task(). 6.8.3.2. Thread-Related FunctionsExamples include chudxnu_bind_thread(), chudxnu_unbind_thread(), chudxnu_thread_get_state(), chudxnu_thread_set_state(), chudxnu_thread_user_state_available(), chudxnu_thread_get_callstack(), chudxnu_thread_get_callstack64(), chudxnu_current_thread(), chudxnu_task_for_thread(), chudxnu_all_threads(), chudxnu_thread_info(), and chudxnu_thread_last_context_switch(). 6.8.3.3. Memory-Related FunctionsExamples include chudxnu_avail_memory_size(), chudxnu_phys_memory_size(), chudxnu_io_map(), and chudxnu_phys_addr_wimg(). 6.8.3.4. CPU-Related FunctionsThese include functions for the following operations:
6.8.3.5. Callback-Related FunctionsThe kernel supports registration of CHUD callbacks in several kernel subsystems, such as those listed here.
Figure 630 shows how the kernel invokes CHUD system-wide hooks for traps and ASTs. Figure 630. Invocation of CHUD system-wide hooks for traps and ASTs
Let us look at the operation of the CHUD system call hook. We noted in Table 612 that the PowerPC-only system call 0x6009 (CHUDCall) is disabled by default. Figure 631 shows that invoking a disabled PowerPC-only system call results in an erroneous (nonzero) return. Figure 631. Invoking a disabled PowerPC-only system call
Let us now see what is involved in registering a CHUD system call callback with the kernel. If successfully registered, the callback will be invoked in the kernel when the 0x6009 system call is executed. We can carry out such an experiment by using the following steps.
Figure 632 shows most of the code for implementing these steps. Note that the code, including the portion that is not shown, is largely identical to the code in osfmk/ppc/chud/chud_osfmk_callback.c. To create a working kernel extension for this experiment, you need to provide the missing code. Figure 632. Implementing a kernel extension to register a PowerPC-only system call
If you run the program from Figure 631 after the kernel extension shown in Figure 632 is loaded, you should get a zero return from the system call, and the "Hello, CHUD!" message should appear in the system log. 6.8.4. Kernel Profiling (kgmon and gprof)The Mac OS X kernel can be compiled with support for profiling its own code. Such a compilation is achieved by selecting the PROFILE configuration before initiating a kernel build. Doing so enables several aspects of the kernel profiling mechanism, such as the following.
The kgmon command-line program is used to enable or disable profiling, reset in-kernel profile buffers, and dump the contents of the profile buffers to a gmon.out file. kgmon communicates with the kernel primarily using management information base (MIB) names of the format CTL_KERN
Once profiling data is dumped to the gmon.out file, the standard gprof command-line program can be used to display the execution profile. Figure 633 shows an example of using kgmon and gprof. Figure 633. Using kgmon and gprof for kernel profiling
6.8.4.1. Per-Process Profiling (profil(2))The xnu kernel implements the profil() system call that allows a user process to gather its own CPU-usage statistics by profiling the program counter. int profil(char *samples, size_t size, u_long offset, u_int scale)samples is a buffer whose length is size bytes. It is divided into sequential bins of 16 bits each. offset specifies the lowest program counter (PC) value at which the kernel will sample the PC upon every clock tickit is the starting address of the program region to be sampled. For each sampled PC, the kernel increments the value in the bin whose number is computed based on the scale argument. To compute the bin number, that is, the index in the samples array, the kernel subtracts offset from the sampled PC and multiplies the result by scale. If the resultant index is within the bounds of the samples array, the corresponding bin's value is incremented; otherwise, profiling is turned off. scale is passed as an unsigned integer but represents 16 bits' worth of fraction, with the value 1 being in the middle. Therefore, a scale value of 0x10000 results in a one-to-one mapping from PC value to bins, whereas a higher value results in a many-to-one mapping. A scale value of 0 or 1 turns off profiling. // bsd/kern/subr_prof.c #define PC_TO_INDEX(pc, prof) \ ((int)(((u_quad_t)((pc) - (prof)->pr_off) * \ (u_quad_t)((prof)->pr_scale)) >> 16) & ~1)Enabling profiling sets the P_PROF bit in the p_flag field of the BSD process structure. Moreover, the pr_scale field of the profiling substructure within the process structure is set to the scale value. Thereafter, as shown in Figure 634, every time there is a BSD-level clock tick (100 times a second), bsd_hardclock() checks whether the process is running in user mode and has a nonzero scale value. If so, it sets a flag (P_OWEUPC) in the process, indicating that a call to addupc_task() [bsd/kern/subr_prof.c] is owed to the task the next time there is an AST. It then calls astbsd_on() to generate an AST_BSD, which is serviced by bsd_ast(), which in turn calls addupc_task(). The latter updates the profiling buffer, turning off profiling in the case of an error. Figure 634. Implementation of the profil() system call
Another system calladd_profil()can be used to profile multiple, noncontiguous areas of program memory. Multiple calls to add_profil() can follow a single call to profil(). Note that calling profil() removes any buffers that were allocated by one or more previous calls to add_profil(). 6.8.4.2. Mach Task and Thread SamplingMach 3 provides calls for sampling tasks and threads. The mach_sample_thread() call periodically samples the program counter of the specified thread, saves the sampled values in buffers, and sends the buffers to the specified reply port when the buffers become full. The mach_sample_task() call performs a similar function, but for all threads of a given task. The sampled values are not tagged by thread, which means that samples for various threads will typically be intermingled. The Mac OS X kernel includes code for Mach-based task and thread sampling. The code is conditionally compiledif MACH_PROF is defined during kernel compilation. However, note that the code is not functional. kern_return_t task_sample(task_t sample_task, mach_port_make_send_t reply_port); kern_return_t thread_sample(thread_act_t sample_thread, mach_port_make_send_t reply_port); kern_return_t receive_samples(mach_port_t sample_port, sample_array_t samples, mach_msg_type_number_t sample_count); The receive_samples() call is used to receive a message containing sampled values. It is invoked by prof_server()a MIG-generated library function that simplifies the work involved in processing the incoming IPC message.[15] We will discuss this style of IPC in Chapter 9 when we look at Mach exception handling.
The osfmk/mach/prof.defs file contains the MIG definitions for this profiling interface. 6.8.5. Per-Process Kernel Tracing (kTRace(2) and kdump)The ktrace() system call can be used on Mac OS X to enable or disable tracing of selected operations in one or more processes. int ktrace(const char *tracefile, // pathname of file in which to save trace records int ops, // ktrace operation int trpoints, // trace points of interest (what to trace) int pid); // primary process of interest // a negative pid specifies a process group The ops argument to ktrace() can be one of the following:
The ktrace command uses the ktrace() system call, allowing trace data to be logged to a specified file (ktrace.out by default). The kdump command displays the data in human-readable format. Only the superuser may trace setuid and setgid processes, or another user's processes. Categories of operations to tracetrace pointsare specified by logically OR'ing respective bits and passing the resultant value as the TRpoints argument. Each selection causes the corresponding types of events to be generated at one or more locations in the kernel. The following bit values can be used to specify operation types when calling ktrace().
All ktrace event-logging functions are implemented in bsd/kern/kern_ktrace.c. The p_traceflag field of the process structure holds the operation-related bits. This field also contains other relevant flags, such as the following.
Note that a record resulting from some type of tracing event consists of a generic header (struct ktr_header) followed by an event-specific structure. // bsd/sys/ktrace.h struct ktr_header { int ktr_len; // length of buffer that follows this header short ktr_type; // trace record type pid_t ktr_pid; // process ID generating the record char ktr_comm[MAXCOMLEN+1]; // command name generating the record struct timeval ktr_time; // record generation timestamp (microsecond) caddr_t ktr_buf; // buffer } Event-specific structures can vary in length even for a given event type. For example, the ktr_syscall structure contains a system call number, the number of arguments passed to that system call, and an array of 64-bit unsigned integers containing the arguments. struct ktr_syscall { short ktr_code; // system call number short ktr_narg; // number of arguments u_int64_t ktr_args[1]; // a 64-bit "GPR" for each argument };6.8.6. Auditing SupportWe briefly looked at the user-space aspects of the auditing system in Chapter 2. The Mac OS X kernel supports auditing of system events using the Basic Security Module (BSM) format for audit records. Figure 635 shows the key interactions between the user and kernel components of the auditing system. Figure 635. The Mac OS X auditing system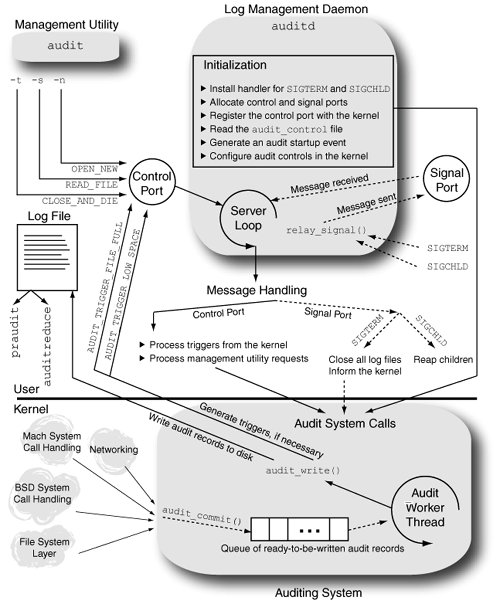 During the initialization of the kernel's BSD portion, audit_init() [bsd/kern/kern_audit.c] is called to initialize the auditing system. Besides allocating the relevant data structures and initializing various parameters, audit_init() also calls kau_init() [bsd/kern/kern_bsm_audit.c] to initialize the BSM audit subsystem. In particular, kau_init() sets up the initial event-to-class mappings for BSD system calls, Mach system calls, and several types of open events. Initially, BSD and Mach system call events map to the null audit class (AU_NULL). Note that at this point, auditing is initialized but not started in the kernel. When the user-space audit daemon (auditd) starts up, it establishes a log file to which the kernel will write audit recordsauditing in the kernel begins as a side effect of this operation. Let us first look at auditd's operation while referring to Figure 635. auditd is a simple daemon whose responsibilities are limited to managing audit log files and enabling or disabling auditing. It is not involved in the actual writing of the audit records to disk.[16] The following are auditd's primary initialization steps.
The in-kernel audit record structure (struct kaudit_record) for a thread resides in the thread's corresponding utHRead structure (struct uthread). // bsd/sys/user.h struct uthread { ... struct kaudit_record *uu_ar; ... }; // bsd/bsm/audit_kernel.h struct kaudit_record { struct audit_record k_ar; // standard audit record u_int32_t k_ar_commit; // AR_COMMIT_KERNEL, AR_COMMIT_USER void *k_udata; // opaque user data, if any u_int k_ulen; // user data length struct uthread *k_uthread; // thread that we are auditing TAILQ_ENTRY(kaudit_record) k_q; // queue metadata }; The kernel allocates and initializes a new audit record for a thread by calling audit_new() [bsd/kern/kern_audit.c] when the first auditable event occurs. This is typically when either a BSD or Mach system call is invoked. However, this can also occur during the audit() system call, which, as we saw earlier, is used by a user program to submit an audit record. Since the audit() system call itself is not audited, it is possible for a uthread structure's uu_ar field to be NULL if no auditable event has occurred so far for that thread. Various portions of the kernel code use audit macros to add information to a thread's existing audit record. These macros resolve to conditional code that operates only if auditing is currently enabled. Figure 636 shows an example of audit macros. Figure 636. Audit macros in the kernel and how they are used
When audit_syscall_enter() [bsd/kern/kern_audit.c] is called, the current uthread structure's uu_ar field will be NULL. If the event corresponding to the current system call and its arguments is auditable, audit_syscall_enter() allocates an audit record and sets uu_ar to point to it. As long as the system call remains in the kernel, any audit_arg_xxx() functions that may be called by kernel code will append information to the thread's audit record. When the system call finishes, audit_syscall_exit() [bsd/kern/kern_audit.c] commits the record by calling audit_commit() [bsd/kern/kern_audit.c] and sets the uu_ar field to NULL. audit_commit() inserts the record in a queue of audit records that are ready to be written to disk. The queue is serviced by the audit worker thread, which, as we saw earlier, is created when auditd first specifies a log file pathname to the kernel. The audit worker thread writes audit records to the log file by calling audit_write() [bsd/kern/kern_audit.c], which directly writes to the log file's vnode (the audit_vp variable) through the vn_rdwr() kernel function. Auditing is disabled by passing a NULL log file pathname, which results in the audit_vp variable being set to NULL. The worker thread checks for a valid audit_vp in each iteration of its loopif audit_vp is NULL, it sets audit_enabled to 0, causing the various audit logger functions to be ineffective. Other responsibilities of the worker thread include sending trigger messages to auditd if the log file becomes full or if the amount of free disk space on the volume containing the log file falls below a configured threshold. 6.8.7. Fine-Grained Kernel Event Tracing (kdebug)The Mac OS X kernel provides a fine-grained kernel-tracing facility called kdebug, which can be enabled or disabled on a per-process basis. The sc_usage, fs_usage, and latency command-line tools use the kdebug facility. sc_usage displays ongoing system calls and various types of page faults. The output of fs_usage is restricted to system calls and page faults related to file system activity. latency monitors and displays scheduling and interrupt latency statistics. The kdebug facility also allows the CHUD toolkit to register a callback functionkdebug_chudhook()that will be invoked each time kdebug logging is attempted, regardless of whether kdebug tracing is enabled or not. Finally, the kdebug facility can be enabled to collect entropy and therefore can be used as a source of entropy for random number generation. The Mac OS X Security Server uses the kdebug facility to sample entropy. Specifically, the kdebug facility can be enabled to operate in modes corresponding to one or more of the following mode bits at any given time: KDEBUG_ENABLE_TRACE, KDEBUG_ENABLE_ENTROPY, and KDEBUG_ENABLE_CHUD. The kdebug_enable global variable in the kernel holds these bits. 6.8.7.1. kdebug TracingThe kdebug facility categorizes traced operations into classes, subclasses within classes, and codes within subclasses. Moreover, if a traced operation marks the beginning or end of a kernel function, its trace is tagged with DBG_FUNC_START and DBG_FUNC_END function qualifiers, respectively. Nonfunction traces are tagged with DBG_FUNC_NONE. Figure 637 shows an excerpt from kdebug's hierarchy of traced operation classification. Each trace record has a 32-bit debug code whose bits represent the operation's class, subclass, code, and function qualifier. The entire hierarchy is defined in bsd/sys/kdebug.h. Figure 637. The composition of a debug code in the kdebug facility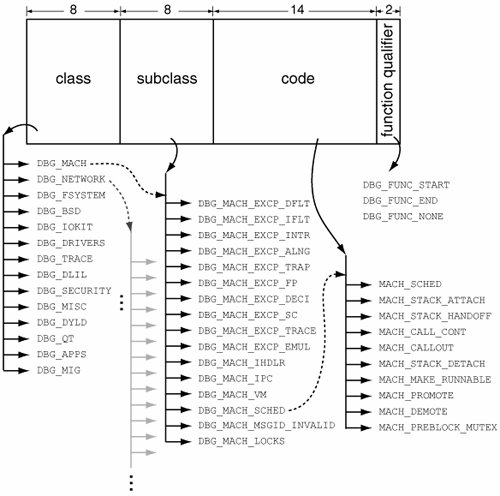 Code throughout the kernel submits operations for kdebug tracing using macros that resolve to either kernel_debug() or kernel_debug1(), both of which are implemented in bsd/kern/kdebug.c. // bsd/sys/kdebug.h #define KERNEL_DEBUG_CONSTANT(x,a,b,c,d,e) \ do { \ if (kdebug_enable) \ kernel_debug(x,a,b,c,d,e); \ } while(0) #define KERNEL_DEBUG_CONSTANT1(x,a,b,c,d,e) \ do { \ if (kdebug_enable) \ kernel_debug1(x,a,b,c,d,e); \ } while(0) ...
kernel_debug1() is used during an execve() operation that follows a vfork() operationkernel_debug1() is a special version of kernel_debug() that receives the thread's identity as an argument instead of calling current_thread(), which kernel_debug() uses. current_thread() cannot be used in this particular case since it will return the parent thread. Let us see how the BSD system call handler uses these macros. As shown in Figure 638, the handler submits trace records soon after starting and just before finishing. Note that it skips record generation if the system call number is 180 (SYS_kdebug_trace), which corresponds to the kdebug_trace() system call. Similar conceptually to the audit() system call, this call can be used by user programs to explicitly submit a trace record to the kdebug facility. As we will shortly see, the BSDDBG_CODE() macro computes a debug code given a subclass and a code within that subclass. Figure 638. kdebug tracing in the BSD system call handler
The kdebug facility is accessed from user space through KERN_KDEBUG sysctl operations with CTL_KERN as the top-level sysctl identifier. Examples of supported operations include the following:
Note that process IDs can be either selected for or excluded from tracing. In the former case, the KDBG_PIDCHECK bit is set in the global kdebug-flags kernel variable (kdebug_flags), and the P_KDEBUG bit is set in the p_flag process structure field of each selected process. Thereafter, any process for which P_KDEBUG is not set is not traced. In the case of process ID exclusion, the KDBG_PIDEXCLUDE bit is set instead in kdebug_flags, and the P_KDEBUG bit is set for each excluded process. As seen in the examples of supported kdebug operations, trace points of interest can be specified to the kernel in several ways: through a kdebug class (such as DBG_BSD), a subclass (such as DBG_BSD_EXCP_SC, which represents BSD system calls), up to four specific debug code values, or a range of such values. Figure 637 shows the structure of a debug code. The bsd/sys/kdebug.h header provides macros for constructing a debug code from its constituents. Let us consider a specific example. Suppose we wish to use the kdebug facility to trace the use of the chdir() system call. The debug code for chdir() will have DBG_BSD as its class, DBG_BSD_EXP_SC as its subclass, and the system call's number (SYS_chdir) as its code. We can use the BSDDBG_CODE() macro to compute the code. // bsd/sys/kdebug.h #define KDBG_CODE(Class, SubClass, code) (((Class & 0xff) << 24) | \ ((SubClass & 0xff << 16) | ((code & 0x3fff) << 2)) ... #define MACHDBG_CODE(SubClass, code) KDBG_CODE(DBG_MACH, SubClass, code) #define NETDBG_CODE(SubClass, code) KDBG_CODE(DBG_NETWORK, SubClass, code) #define FSDBG_CODE(SubClass, code) KDBG_CODE(DBG_FSYSTEM, SubClass, code) #define BSDDBG_CODE(SubClass, code) KDBG_CODE(DBG_BSD, SubClass, code) ... Before we look at a programming example, let us briefly discuss the operation of kernel_debug(), which is the center of kdebug activity in the kernel. It performs the following primary operations.
Let us now look at an example of using the kdebug facility in a user program. We will use kdebug to trace the chdir() system call. If a process ID is passed as an argument to the program, we will configure kdebug to trace only that process; otherwise, kdebug will trace on a system-wide basis. We will use kdebug's value-checking feature to configure it to trace only one specific debug codethat corresponding to the chdir() system call. Figure 639 shows the program and a sample of its usage. Note that only one program can use the kdebug tracing facility at a time. Figure 639. Using the kdebug facility in a program
The file /usr/share/misc/trace.codes maps kdebug codes to operation names. It is used by programs such as sc_usage and latency to display debug codes in human-readable forms. 6.8.7.2. kdebug Entropy CollectionAs we noted earlier, the kdebug facility can be enabled to sample system entropy. The samples are collected in a kernel buffer, which is then copied to user space. These steps occur within a single sysctl call. Input to this call includes a user buffer for receiving entropy entries, the buffer's size, and a timeout value. The Mac OS X Security Server (/usr/sbin/securityd) contains a system entropy management module that uses kdebug entropy collection. It performs the following operations.
// <darwin>/<securityd>/src/entropy.cpp void EntropyManager::collectEntropy() { int mib[4]; mib[0] = CTL_KERN; mib[1] = KERN_KDEBUG; mib[2] = KERN_KDGETENTROPY; mib[3] = 1; // milliseconds of maximum delay mach_timespec_t timings[timingsToCollect]; size_t size = sizeof(timings); int ret = sysctl(mib, 4, timings, &size, NULL, 0); ... } The in-kernel handler for the KERN_KDGETENTROPY sysctl calls kdbg_getentropy() [bsd/kern/kdebug.c], which performs the following operations.
Enabling entropy collection causes kernel_debug() to collect timestamp entries in the entropy buffer. Note that this is independent of whether kdebug tracing is enabled or the CHUD hook is installed. // bsd/kern/kdebug.c void kernel_debug(debugid, arg1, arg2, arg3, arg4, arg5) { ... if (kdebug_enable & KDEBUG_ENABLE_ENTROPY) { // collect some more entropy if (kd_entropy_index < kd_entropy_count) { kd_entropy_buffer[kd_entropy_index] = mach_absolute_time(); kd_entropy_index++; } // do we have enough timestamp entries to fill the entropy buffer? if (kd_entropy_index == kd_entropy_count) { // disable entropy collection kdebug_enable &= ~KDEBUG_ENABLE_ENTROPY; kdebug_slowcheck &= ~SLOW_ENTROPY; } } ... } 6.8.8. Low-Level Diagnostics and Debugging InterfacesThe Mac OS X kernel provides a low-level diagnostics and debugging interface that can be enabled at boot time by passing the diag argument to the kernel. Depending on the specific flags passed through this argument, the kernel enables specific features and behavior. The various flag bits that can be set in the diag value[19] are defined in osfmk/ppc/Diagnostics.h. Table 617 lists these flags and their purpose.
The flags listed in Table 617 are likely to be useful only to Mac OS X core kernel developers. Enabling any of the diagnostics or low-level debugging features on production systems is not recommended. 6.8.8.1. Firmware Call InterfaceThe firmware call interface is so called because it provides functionality that is considered an extension of the hardwareit is not an interface to Open Firmware. Its functionality includes the following:
Note that the kernel uses certain firmware calls during its regular operation. For example, _ml_set_interrupts_enabled() [osfmk/ppc/machine_routines_asm.s] can conditionally invoke the DoPreemptCall() system call from within the kernel. Similarly, context-switching assembly code in osfmk/ppc/cswtch.s uses the SwitchContextCall() firmware call. Let us look at an example of using the firmware call interface from user space. A system call is treated as a firmware call if its number has its high-order bit set to 1. As we saw in Figure 612, the xcpSyscall() handler tests for firmware calls early. Whereas firmware calls are always allowed from supervisor state, they must be explicitly enabled for user space, as noted in Table 617. If xcpSyscall() finds the high-order bit set in the system call number, and the call is allowed, it forwards the call to FirmwareCall() [xnu/osfmk/ppc/Firmware.s]. The low-order bits in the system call number represent the index of the desired call in the firmware call table (FWtable), which is declared in osfmk/ppc/Firmware.s and populated in osfmk/ppc/FirmwareCalls.h. The lowest numbered firmware callCutTraceCall()has the number 0x80000000. Looking at osfmk/ppc/FirmwareCalls.h, we find that the Choke() call is at index 0xa, whereas the CreateShutdownCTXCall() call is at index 0xd.
Firmware call indices may not be the same across all kernel versions. For example, if we make a system call with the value 0x8000000a in GPR0, the system will crash. Similarly, a call with the value 0x8000000d in GPR0 will cause the system to shut down instantly, as if all power to the system has been cut. 6.8.8.2. Diagnostics System Call InterfaceThe diagnostics system call interface is somewhat more generally interesting for experimentation than the firmware call interface. Its functionality includes routines for the following operations:
A complete list of implemented diagnostics system calls can be seen in osfmk/ppc/Diagnostics.c. As shown in Table 612, the PowerPC-specific diagCall() system call has the number 0x6000. This system call invokes diagCall() [osfmk/ppc/Diagnostics.c]the dispatcher for these system calls. diagCall() uses the value in GPR3 to determine the specific diagnostics operation to perform. The available operations are defined in osfmk/ppc/Diagnostics.h. // osfmk/ppc/Diagnostics.h #define diagSCnum 0x00006000 #define dgAdjTB 0 #define dgLRA 1 #define dgpcpy 2 #define dgreset 3 #define dgtest 4 #define dgBMphys 5 #define dgUnMap 6 #define dgBootScreen 7 ... #define dgKfree 22 #define dgWar 23 ...Let us look at examples of using the diagnostics system calls. First, we create a common header filediagCommon.hcontaining code we will use in all examples in this section. Figure 640 shows diagCommon.h. Figure 640. Common header file for using the diagnostics system call interface
Before the diagnostics system call interface can be used, it must be enabled at boot time by passing the diag=<number> boot argument, where <number> contains set bits corresponding to the enaDiagSCs constant (0x8), as noted in Table 617. Similarly, the firmware interface is enabled by passing set bits corresponding to the enaUsrFCall constant (0x2). For example, to enable both interfaces, pass diag=0xa, since 0xa is the logical OR of 0x8 and 0x2. Retrieving Boot-Screen InformationIn this example, we will write a program that uses the dgBootScreen() call to retrieve the boot-screen "video" information from the kernel. The information is maintained in a structure of type vc_info. The system console code in osfmk/console/video_console.c manages this structure. Figure 641 shows the output of our program on a system with a 1280x854 display attached to it. Note that the quantity labeled "physical address" shows the location of the raw framebuffer in physical memory. Figure 641. Retrieving boot-screen information using a diagnostics system call
Retrieving the Physical Address for a Virtual AddressIn this example, we will use the dgLRA() (where LRA stands for logical-to-real address) call to retrieve the physical page, and therefore the physical address, for a given virtual address in the address space of the calling process. If the virtual address is not mapped in the caller's address space, the dgLRA() system call returns a nonzero value. We can verify this program by retrieving the physical address of the page beginning at virtual address 0xFFFF8000as we saw earlier, this is the base virtual address of the comm area and should map to the same physical page in all user address spaces. Figure 642 shows the program. Figure 642. Retrieving the physical address (if any) for a virtual address in the caller's address space
Examining Physical MemoryThe dgpcpy() diagnostics system call copies physical memory into a supplied buffer. In this example, we will write a program that uses this call to fetch physical memory and dumps it on the standard output. Thereafter, we can either redirect the program's output to a file or pipe it through a utility such as hexdump to view the memory's contents in different formats. Figure 643 shows the program. Figure 643. Retrieving physical memory using a diagnostics system call
We can test the operation of our diagpcpy program by examining physical memory that is known to contain specific information. Recall from Figure 628 that the beginning of the comm area contains a string signature. Moreover, we know that the comm area should begin at virtual address 0xFFFF8000 in every user virtual address space, and we determined the corresponding physical address using our diagLRA program in a previous example. $ ./diagLRA 0xFFFF8000 virtual address 0xFFFF8000 :: physical page 0x1669 (address 0x1669000) $ ./diagpcpy 0x1669000 16 | strings commpage 32-bit $ Let us look at another example. We know that the exception vectors reside in physical memory starting at address 0x0. We can retrieve the contents of that page and compare them with the contents of the __interrupts section in the __VECTORS segment within the kernel executable. $ ./diagpcpy 0x0 4096 > /tmp/phys0.out $ hexdump -v /tmp/phys0.out | less ... 0000100 7db2 43a6 7d73 43a6 81a0 00f0 7d60 0026 0000110 2c0d 0001 4082 001c 3960 0000 9160 00f0 0000120 8080 00f4 8060 00f8 7c88 03a6 4e80 0020 ... $ otool -s __VECTORS __interrupts /mach_kernel | less /mach_kernel: Contents of (__VECTORS,__interrupts) section ... 00000100 7db243a6 7d7343a6 81a000f0 7d600026 00000110 2c0d0001 4082001c 39600000 916000f0 00000120 808000f4 806000f8 7c8803a6 4e800020 ... Note that the hexdump output is formatted somewhat differently from otool's output. The modern-day hexdump program's output format can be configured through format strings. In this example, you can make the hexdump output identical to otool's as follows: $ echo '"%07.7_Ax\\n"\n"%07.7_ax " 4/4 "%08x " "\\n"' | \ hexdump -v -f /dev/stdin /tmp/phys0.out ... 00000100 7db243a6 7d7343a6 81a000f0 7d600026 00000110 2c0d0001 4082001c 39600000 916000f0 00000120 808000f4 806000f8 7c8803a6 4e800020 ... Finally, let us retrieve a few bytes from the physical address 0x5000 and attempt to interpret them as a character string. We will see the reason for this string in Section 6.8.9.1. $ ./diagpcpy 0x5000 8 | strings HagfishCapturing a Screenshot of the Text ConsoleWe earlier determined the physical base address of the boot display's framebuffer using the diagBootScreen program. Since diagpcpy allows us to dump physical memory, we could capture a raw screenshot of the display using these two programs. In particular, this gives us a way of capturing a screenshot of the textual console. Let us consider the example of the display shown in Figure 641; the relevant information is repeated here. $ ./diagBootScreen 1280x854 pixels, 160x53 characters, 32-bit base address 0x2f72c000, physical address 0xb8010000 5120 bytes used for display per rowGiven the information dumped by diagBootScreen, we can see that our screenshot capturing on this particular system would involve copying a certain amount of physical memory starting at physical address 0xb8010000. Since this is a 32-bit framebuffer and there are 1280 x 854 pixels, the number of bytes we need to retrieve is 4 x 1280 x 854, which is 4,372,480. $ ./diagpcpy 0xb8010000 4372480 > display.dump $ file display.dump display.dump: data
Note that diagpcpy is not the only way to read physical memory from user space. Given the appropriate privileges, a user program can read physical memory and kernel virtual memory through the /dev/mem and /dev/kmem devices, respectively. The kernel functions that serve these devices are implemented in bsd/dev/ppc/mem.c. At this point, the display.dump file contains raw pixel dataa linear sequence of 32-bit pixel values in row-major order. When treated as big-endian, each pixel value contains a leading pad byte followed by 8-bit red, green, and blue components, in that order. We can convert this raw data to an image formatsay, TIFF or JPEGby using a variety of image-processing tools. For example, we can write a trivial Perl script to remove the padding from each pixel value to create a new raw pixel data file, which can then be converted to easily viewable image formats. The following example uses the freely available rawtoppm and ppmtojpeg command-line programs. $ cat unpad.pl #! /usr/bin/perl -w my $PROGNAME = "unpad"; if ($#ARGV != 1) { die "usage: $PROGNAME <infile> <outfile>\n"; } open(I, "<$ARGV[0]") or die "$!\n"; open(O, ">$ARGV[1]") or die "$!\n"; my $ibuf; while (sysread(I, $buf, 4) == 4) { my ($pad, $r, $g, $b) = unpack('C4', $buf); $buf = pack('C3', $r, $g, $b); syswrite(O, $buf, 3); } close(I); close(O); exit(0); $ ./unpad.pl display.dump display-rgb.raw $ rawtoppm -rgb -interpixel 1280 854 display-rgb.raw > display.ppm $ ppmtojpeg display.ppm > display.jpg
A user program can retrieve the base address of a framebuffer using the CGDisplayBaseAddress() Quartz Services API call. Thereafter, the program can access and modify the framebuffer memorysay, using the read() and write() system calls. We will see an API-compliant version of the screenshot-capturing example in Chapter 10. 6.8.9. Low-Level Kernel TracingIn addition to the various tracing facilities we have seen so far, the Mac OS X kernel contains yet another tracing facility used for low-level tracing. We have alluded to this facility earlier in this chapter in the context of the CutTrace() system call, which is the means by which kernel code logs low-level traces into a kernel buffer. The buffer can be examined from within KDB. Before we discuss this tracing mechanism, let us look at the low-memory global (lowglo) data structures, which also include the work area for this mechanism. 6.8.9.1. Low-Memory Global Data StructuresWe have seen earlier that the first 32KB of physical memorythe low memorycontains critical kernel data and code. For example, the PowerPC exception vectors begin at physical address 0x0. The low-level exception filter table (xcpTable) and the first-level system call dispatch table (scTable), both of which are implemented in osfmk/ppc/lowmem_vectors.s, also reside in low memory. Another low-memory area instantiated in lowmem_vectors.s is lowGloa structure of type lowglo that contains global (as opposed to per-processor) constants, data areas, and pointers. These entities are accessed by kernel code directly using absolute addresses. Hence, they must reside in low physical memory. The logGlo area starts at physical address 0x5000 and is a page long. The next physical pagestarting at address 0x6000is a shared page mapped into the kernel's address space; it can be used for low-level kernel debugging. Figure 644 shows the structure of the lowGlo area. Figure 644. The low-memory global data area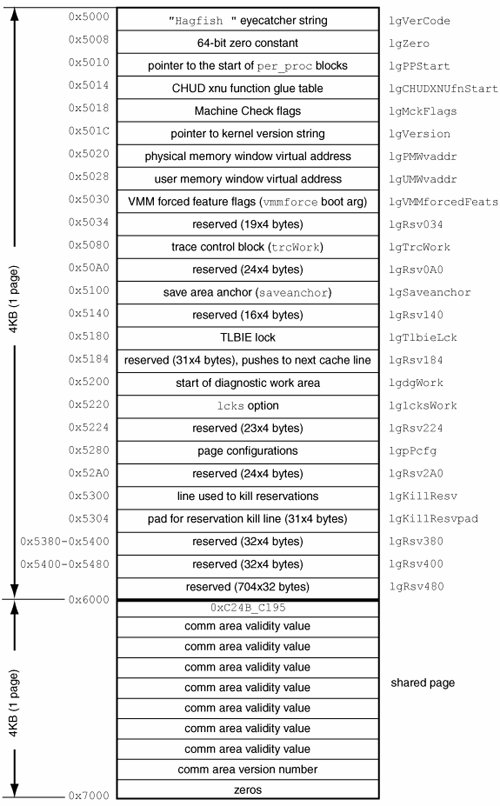 In Section 6.8.8.2, we found that memory at physical address 0x5000 contains the word Hagfish. To be precise, it is the string "Hagfish" (with a trailing space). It is an "eyecatcher" string used as a system verification code at the beginning of the lowGlo area. Let us use our diagpcpy program from Section 6.8.8.2 to glean some more information from this area. Kernel Version StringAs shown in Figure 644, physical address 0x501C contains a pointer to the kernel version string. $ ./diagpcpy 0x501C 4 | hexdump 0000000 0033 1da0 0000004 $ ./diagpcpy 0x00331da0 128 | strings Darwin Kernel Version 8.6.0: ... root:xnu-792.6.70.obj~1/RELEASE_PPC 8.6.0 Darwin Per-Processor Information AreasAs shown in Figure 644, physical address 0x5010 points to the start of the array containing per-processor information entries. Each entry is a structure of type per_proc_entry, which contains a pointer to a structure of type per_proc_info. The latter contains a variety of static and dynamic information about a processorfor example, the hardware exception counters (struct hwCtrs). Figure 645 shows excerpts from these structures, some of which we came across in Chapter 5. Figure 645. Data structures for holding per-processor information
Let us retrieve the value of a particular hardware countersay, hwProgramsusing diagpcpy. We will do so for the first processor, in case there are multiple processors. Given the information in Figures 644 and 645, we can compute the physical address of interest using the following information.
Let us now retrieve the value of hwPrograms. $ ./diagpcpy 0x5010 4 | hexdump # this will give us the address of PerProcTable 00000000 0035 d000 00000004 $ ./diagpcpy 0x35d000 16 | hexdump # fourth 32-bit word is the first # processor's ppe_vaddr 00000000 0000 0000 0035 e000 0000 0000 0035 e000 00000010 $ ./diagpcpy 0x35e81c 4 | hexdump # add 0x81c to get the address of hwPrograms 00000000 0000 0000 00000004 In this example, the counter's value is 0. Let us execute a trivial program that we know will increment the value of this counter. For example, executing an illegal hardware instructionsay, a supervisor-only instruction in user modewill result in a T_PROGRAM exception, which is counted by hwPrograms. Figure 646 shows a program that causes a T_PROGRAM to be generated. Figure 646. Causing an exception and retrieving the corresponding counter from the kernel
Figure 647 shows a portion of exception-handling code that increments various hardware exception counters. Note that the order of counter fields within the hwCtr structure is matched with the definition of exception numbersan exception number is the offset of the corresponding counter within hwCtr. For example, T_PROGRAM is defined to be (0x07 * T_VECTOR_SIZE) in osfmk/ppc/exception.h, with T_VECTOR_SIZE being 4. Figure 647. Maintenance of hardware exception counters in the kernel
6.8.9.2. Low TracingLet us now continue our discussion of "CutTrace" low-level tracing, or simply low tracing. Figure 644 shows an area called lgTrcWork: This is the control block for low tracing. It is a structure of type TRaceWork. // osfmk/ppc/low_trace.h typedef struct traceWork { unsigned int traceCurr; // Address of next slot unsigned int traceMask; // Types to be traced unsigned int traceStart; // Start of trace table unsigned int traceEnd; // End of trace table unsigned int traceMsnd; // Saved trace mask unsigned int traceSize; // Size of trace table unsigned int traceGas[2]; } traceWork;
Similarly, lgdgWork is the diagnostic work areait is a structure of type diagWork, which is declared in osfmk/ppc/Diagnostics.h. One of this structure's fields, dgFlags, stores the diagnostic flags. The flags passed through the diag boot-time argument are stored here. Low tracing is enabled by setting the enaExpTrace bit in the value of the diag boot-time argument. It can be limited to a specific processor by providing the processor number through the ctrc boot-time argument. Moreover, the size of the kernel buffer used for low tracing can be adjusted through the tb boot-time argument. ppc_init() [osfmk/ppc/ppc_init.c] processes these arguments during early system startup. Figure 648 shows this processing. Figure 648. Processing of low-tracing-related boot-time arguments during system startup
Later during the system startup, pmap_bootstrap() [osfmk/ppc/pmap.c] reserves physical memory for the trace table. // osfmk/ppc/pmap.c void pmap_bootstrap(uint64_t memsize, vm_offset_t *first_avail, unsigned int kmapsize) { ... trcWork.traceCurr = (unsigned int)addr; // set first trace slot to use trcWork.traceStart = (unsigned int)addr; // set start of trace table trcWork.traceEnd = (unsigned int)addr + trcWork.traceSize; // set end ... } As we noted earlier, low tracing is performed through the CutTrace() system call, a firmware call that is also an ultra-fast trapit is handled in osfmk/ppc/lowmem_vectors.s (in fact, before any other ultra-fast trap). The firmware call interface provides a stub, dbgTrace() [osfmk/ppc/Firmware.s], to call CutTrace(). ; osfmk/ppc/Firmware.s ; ; dbgTrace(traceID, item1, item2, item3, item4) ; .align 5 .globl EXT(dbgTrace) LEXT(dbgTrace) mr r2,r3 ; trace ID mr r3,r4 ; item1 lis r0,HIGH_ADDR(CutTrace) ; top half of firmware call number mr r4,r5 ; item2 mr r5,r6 ; item3 ori r0,r0,LOW_ADDR(CutTrace) ; bottom half mr r6,r7 ; item4 sc ; invoke the system call blr ; done Various portions of the kernel add low-trace records either by calling dbgTrace() or by directly invoking the CutTrace() system call. In the latter case, the trace identifier is passed in GPR2. Figure 649 shows an example of kernel code creating a low-trace record. Figure 649. An example of low-trace record generation by kernel code
A low-trace record is a structure of type LowTraceRecord, which is declared in osfmk/ppc/low_trace.h. Information contained in a LowTraceRecord structure includes the following:
A convenient way to view low-trace records is through the built-in kernel debugger KDB, whose lt command formats and displays these records. db{0}> lt 0 ... 00ADEA80 0 00000002 FD6D0959 - 0C00 DAR/DSR/CR: 00000000A000201C 40000000 84024A92 SRR0/SRR1 00000000000D6D00 1000000000001030 LR/CTR 00000000000D61F4 00000000000344A8 R0/R1/R2 FFFFFFFF80000000 000000001759BD00 0000000000004400 R3/R4/R5 0000000002626E60 000000000002CD38 0000000001E5791C R6/sv/rsv 000000002FD78780 0000000000000000 00000000 ... |
 KERN_PROF
EAN: 2147483647
Pages: 161
- Structures, Processes and Relational Mechanisms for IT Governance
- Integration Strategies and Tactics for Information Technology Governance
- A View on Knowledge Management: Utilizing a Balanced Scorecard Methodology for Analyzing Knowledge Metrics
- The Evolution of IT Governance at NB Power
- Governance Structures for IT in the Health Care Industry