6.2 Project formulation
6.2 Project formulation
Although not part of the portfolio-balancing activity, the project formulation process (see Figure 6.2) is the process during which most of the information required for planning and balancing the portfolio is produced. Of particular interest are the following tasks:
-
Producing a rough estimate;
-
Calculating contingency allowances (risk and opportunity management);
-
Evaluating individual projects' contribution to benefits (project concept definition);
-
Establishing project dependencies (updating dependency matrix).
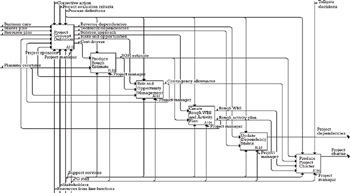
Figure 6.2: Project formulation process.
6.2.1 Producing a rough estimate
Cost, effort, and schedule estimates should be developed for the proposed project scope from relevant cost drivers. For example, functional size and complexity would be considered in the case of software; estimated number of devices would be taken into account in hardware projects; and therapeutic category and the number of chemical reactions necessary to synthesize a molecule [2] would be required for the pharmaceutical industry.
Once the initial cost, effort, and schedule estimates have been developed, before committing to the estimate, the following questions should be answered:
-
Does the estimate make sense?
-
Are estimated schedules, costs, and effort consistent with prior experience?
-
Do the estimated effort, cost, and schedule meet programmatic requirements?
-
Are required productivity levels reasonable?
-
Have all relevant costs drivers been included?
The analysis of the estimate serves four purposes: to ensure that the estimate is thoroughly understood, to ensure that the estimate is as accurate as possible; to provide a baseline upon which to evaluate the project benefits, and to conduct risk analyses. Typical methods used in the development of rough estimates, as described in Table 6.1, are expert judgment, analogy, and parametric models.
| Estimation Approach | Description | Advantages | Limitations |
|---|---|---|---|
| | |||
| Analogy | Compare project with past similar projects | Estimates are based on actual experience | Truly similar projects must exist |
| Expert judgment | Consult with one or more experts | Little or no historical data is needed; good for new or unique projects | Experts tend to be biased; knowledge level is sometimes questionable |
| Parametric models | Perform overall estimate using design parameters and mathematical algorithms | Models are usually fast and easy to use, and useful early in a program; they are also objective and repeatable | Models can be inaccurate if not properly calibrated and validated; historical data used for calibration may not be relevant to new programs |
Whatever the technique used in developing them, estimates are contingent on the many assumptions upon which they rely and over which the project manager has little or no control. Moreover, estimates could reflect bias on the part of those producing them. Because of uncertainty surrounding the estimated cost, effort, and schedule, three-point estimates (best case, worst case, and most-likely scenario) from which a probability distribution could be derived (see Figures 6.3 and 6.4) are a better alternative to single-number estimates.
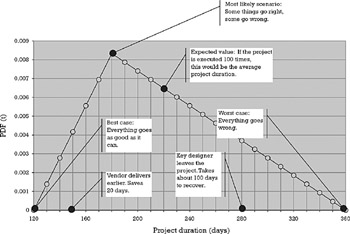
Figure 6.3: Three-point estimate.
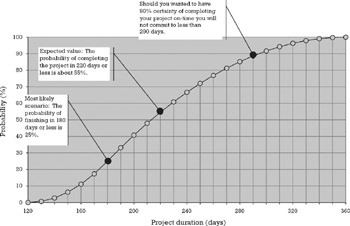
Figure 6.4: Cumulative probability distribution.
The schedule risk of any project, as illustrated in Figure 6.5, manifests itself as a project with the same "most likely" completion date, but farther to the right, a worst-case completion date. In statistical terms, this variation in the spread of completion dates is captured by the standard deviation of the distribution. Similar considerations could be made with respect to the effort and cost risks of a project.
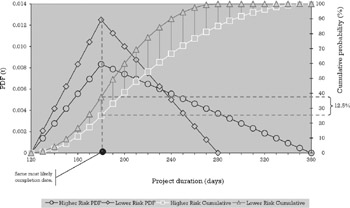
Figure 6.5: Project schedule risk.
Since a project is a unique happening, it is impossible to know its real effort and duration probability distributions, and in consequence, any distribution chosen would only approximate the true, but unknown, distribution. Given this fact, the use of a triangular distribution to model project risks is a sensible choice [3] because its parameters are easy to understand, its shape is consistent with project managers' and sponsors' expectations, and its probabilities are easy to compute, even without a pocket calculator. Assuming a triangular distribution, the expected effort and project duration and its standard deviations are calculated using the following expressions:

where a is the least effort at which the project can be completed, b the most likely, and c the worst case. σ(ProjectEffort) denotes the standard deviation of the required effort. Similarly, the expected project duration can be calculated by the expression

where a is the shortest time in which the project can be completed, b the most likely, and c the worst case. σ(ProjectDuration) denotes the standard deviation of the required effort.
The probability of a project finishing on or before a certain time t, or requiring less than a certain effort, F(t), could be calculated as follows:
if t < a then
F (t) = 0
if a ≤ t < b then
![]()
if b ≤ t < c then
![]()
if c ≤ t then
F(t) = 1
Choosing a 50% certainty in the completion date of the projects means that in the long run, one of every two projects will finish late. Choosing a 75% probability will reduce this number to one in four.
6.2.2 Calculating contingency allowances
Most street-smart project managers will hide funding in their budgets for unknown contingencies, and most savvy managers and sponsors, being aware of this, will cut the budgets back. The end result of this silly game is that there is no or little visibility with respect to these funds, how much has been allocated, who controls them, and when and on what they should be spent.
Clearly spelling out project risks and using an insurance-like mechanism for the management of contingency funds will result in the following benefits to the organization:
-
Better profitability decisions, as the risks posed by a project are taken into consideration in the business decision;
-
Reduced cost of capital, as the organization's budgets are based on a risk-spreading policy rather than on worst-case scenarios;
-
Reduced capital needs, as the "budget allocated is budget spent" syndrome is avoided;
-
Better anticipation of business needs on the part of those with profit-and-loss responsibilities, who will attempt to avoid being hit with an insurance premium that will go directly against their bottom line.
According to the Encyclopaedia Britannica, insurance is "a contract for reducing losses from accidents incurred by an individual party through a distribution of the risk of such losses among a number of parties". In other words, while the destruction of an automobile in a traffic accident imposes a heavy financial loss on an individual, one such loss is of relatively small consequence to an insurer who is collecting sufficient premiums on a large number of automobiles.
While the cost of ensuring a single project against all possible risks and uncertainties would be prohibitive, major risk categories, such as schedule, technology, and organizational maturity, could be singled out, and the project required to include in its budget an insurance premium as part of the cost of doing business. As an example, a project with a highly compressed schedule—a high risk factor—will have a higher insurance premium than a project with a more relaxed one. Taking this additional cost into account could lead to a totally different decision from that made without factoring such risk into the business case.
As an example (see Figure 6.6) let us look at a project with a very aggressive schedule requested by marketing to fit the window of opportunity. The targeted completion date for the project is 150 days, and this date has a probability of being met of around 6.2%. The probability of being late is therefore over 93%. Assuming that the policy of the organization is to have its projects scheduled so that its probability of being late is at most 25%, this would leave the project with a 68.75% (75% – 6.25%) probability of being late above the accepted risk. The question then becomes, should the project need to expend extra money to keep to the promised schedule, who is responsible for the additional funding?
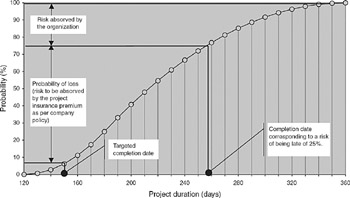
Figure 6.6: Schedule-risk calculations.
If the organization charges all of the risk to the project, it might price the product out of competition. If it decides not to charge anything, it is likely that the organization will have to complete the project at a loss. A fair valuation of this risk could be established using the insurance underwriter's most basic equation:
![]()
The probability of loss in this equation is the probability of not being on time as calculated above. The expense and profit ratio could be replaced by the organization's cost of borrowing. The magnitude of the loss is the extra amount of money necessary to keep to the schedule when this has been underestimated. The diagram in Figure 6.7 shows that in order to recover from an underestimation, it is necessary to use more resources than would be required if the amount underestimated would have been included in the original plan. The extra resources are needed to compensate for the following:
-
The time it will take to find them;
-
The time it will take to bring them up to speed;
-
The time taken away from other staff in order to bring the new resources up to speed.
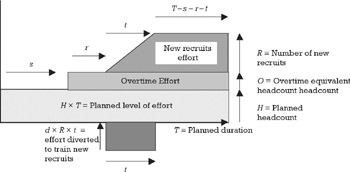
Figure 6.7: Cost of recovery. (Source: [3].)
The equations below, derived from the geometry of Figure 6.7, are used to calculate the recovery cost as follows:

where
| A = | effort required to complete the project at the risk level decided by the organization |
| H = | head count allocated as per original plan |
| T = | planned duration |
| O = | equivalent head count provided by overtime |
| R = | number of people to be added to the project to attempt a recovery |
| s = | time it takes to come to the conclusion that the project is going to be late |
| r = | time it takes to incorporate new people into the project |
| t = | time it takes for a new person to become fully productive |
| d = | proportion of effort that an original member of the team devotes to each newcomer |
| m = | regular cost per resource per unit of time |
| n = | overtime cost per resource per unit of time |
Table 6.2 develops a numeric example of the calculation process and Figures 6.8 and 6.9 plot the economics of project insurance.
| Step | Input and Process | Result |
|---|---|---|
| 1 | Assume the following conditions: | |
| 2 | Calculate the required effort (A): | A = 258 days 10 persons = 2,580 person − day |
| 3 | Calculate the cost of recovery: |
|
| 4 | Calculate the insurance premium for the project: |
|


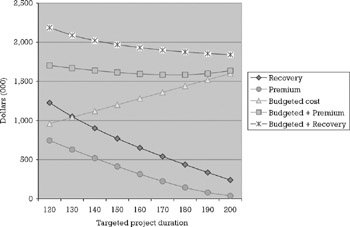
Figure 6.8: Economics of project insurance—acceptable risk level set at the expected project completion date.
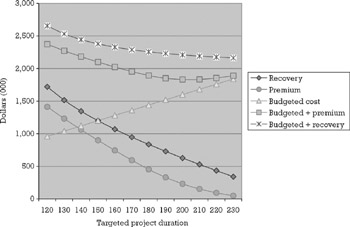
Figure 6.9: Economics of project insurance—acceptable risk level set at the project completion date with a 75% probability of being met.
The insurance premium is "payable" to the PO, which is responsible for the administration of funds. The PO is then able to isolate the organization from fluctuations in individual projects' budgets, which will therefore start to see its projects come in on budget.
Ideas similar to these can be found in the risk analysis and cost management model developed at Lockheed Martin Missiles and Space Company, Sunnyvale, California [4], the probabilistic analyses of technical, schedule and cost risks performed for major projects at the Los Alamos National Laboratory (LANL) [5], and the planning of contingency funds at Compaq [6].
6.2.3 Evaluating individual projects' contribution to benefits (project concept definition)
Evaluating the contribution of individual projects is an intrinsic part of the project-concept-definition activity. Individual projects might contribute to the organization's goals along a number of dimensions. For for-profit organizations, financial success is obviously a very important dimension, but by no means the only one. Common dimensions to be evaluated when judging the merits of a project include strategic position, probability of technical success, probability of commercial success, sociopolitical and regulatory consequences, costs, rewards, and nature of work.
The fact that a project scores low with respect to one dimension does not mean that the project should be automatically disqualified. A project could bring benefits to the organization by allowing it to develop a new competency or by providing entry into a new business segment, and in such cases, projects might be undertaken at a loss with the hope of harvesting larger benefits later.
The importance of the evaluation process resides as much on the final numeric results it produces as on the review process it forces upon the decision makers. The consistent application of the evaluation criteria is necessary to arrive at a thorough and fair comparison among the projects, and that is why it is necessary to define what those criteria are.
The strategic positioning dimension (see Table 6.3) measures where the project fits within the overall organizational strategy. The execution of the project could strengthen the competitive position of the organization along the lines of a defined strategy, or it could be a totally disruptive initiative whose success will allow the organization to enter into a new, previously un-thought-of business segment by developing a new competence.
| Evaluation Criteria | Ranking | |||
|---|---|---|---|---|
| | ||||
| Unfavorable | Favorable | |||
| | ||||
| Congruence | No fit with defined strategy; success will not bring about a new strategy | Marginal contribution to defined strategy | Direct fit and good contribution toward one element of the strategy | Strong fit toward several elements of the strategy; success could open up new opportunities |
| Impact (if project dropped or unsuccessful) | Moderate competitive and financial losses | Significant competitive and financial losses | Would lose current position; could take years to recover | Future of the business depends on this project |
| Synergy with other projects | One-of-a-kind, dead-end work | Slight change that will lead to repeated business | Continuation work has already been announced | Required as part of a multiyear program |
| Learning opportunities | No skills enhancement; have done it before | Adds new capabilities within current business | Develops new capabilities in different business area | |
The technical success probability measures the projects with respect to their likelihood of delivering what they are supposed to deliver. Obviously, other things being equal, the higher the probability of success of a project the better. This does not mean, however, that projects with a low probability of success should not be undertaken; it does mean, though, that for an organization to embark on such projects, the risks need to be understood and the rewards need to be consistent with the exposure incurred.
Although technical risk taxonomies are industry specific, most project failures could be traced to one or more of the factors depicted in Table 6.4.
| Evaluation Criteria | Ranking | |||
|---|---|---|---|---|
| | ||||
| Unfavorable | Favorable | |||
| | ||||
| Technology readiness level | Large gap between practice and target; must invent. | Technology demonstrated in the lab, but not in actual application. | Technology validated in a relevant environment. | Incremental improvement of existing technology. |
| Complexity | The final product involves over 5,000 modules, components, or assembly steps. | The final product involves less than 5,000 modules, components, or assembly steps. | The final product involves less than 200 modules, components, or assembly steps. | The final product involves less than 50 modules, components, or assembly steps. |
| Availability of people, facilities, and time | No appropriate people/facilities, must hire/build. | Acknowledged shortage in key areas. | Resources available but in demand. | People/facilities available immediately; agreed schedule. |
A technically successful project might still be a commercial failure should the organization fail to anticipate the size of the market, the availability of suppliers, or the strength of the competition. The probability of commercial success (see Table 6.5) measures the likelihood of the project results to be successful in the marketplace.
| Evaluation Criteria | Ranking | |||
|---|---|---|---|---|
| | ||||
| Unfavorable | Favorable | |||
| | ||||
| Competition | Many similar offerings; competing in price | Many similar offerings; competing in quality | Similar offers, distinctive value proposition | Unique solution |
| Market size | Single client | Multiple clients | Market | |
| | ||||
| Product life-cycle stage | Declining | Mature | Growth | Embryonic |
The projects an organization undertakes can have an impact on the community at large, or they might be imposed upon the organization by society through regulations and norms with which the organization, or the products it produces, must comply. The sociopolitical dimension (see Table 6.6) measures the projects with respect to the regulatory situation and with respect to the personal and environmental consequences that might arise from the execution of the project or the use of its results.
| Evaluation Criteria | Ranking | |||
|---|---|---|---|---|
| | ||||
| Unfavorable | Favorable | |||
| | ||||
| Regulatory environment | Does not meet current regulations | Extensive qualification needed to satisfy current regulations | Satisfies current regulations | Sets the standard Exceeds current regulations |
| Environmental hazards | Increases emissions subject to regulation | Reduces emissions subject to regulation | Replaces current emissions requirement with one less hazardous | Eliminates regulated emissions |
The rewards dimension measures the payoff to be derived directly from the execution of the project. In this dimension (see Table 6.7), we include the techniques for the economic analysis of the project, such as net present value (NPV), internal rate of return (IRR), return on investment (ROI), and real options valuation (ROV).
| Evaluation | Ranking | |||
|---|---|---|---|---|
| | ||||
| Unfavorable | Favorable | |||
| | ||||
| Revenue | The project is done at a loss | Project breaks even | Attractive revenues | Very attractive revenues |
| NPV/IRR/ROI/ROV | Negative | Does not meet the organization's hurdle rate | Meets the organization's hurdle rate | Exceeds the organization's hurdle rate |
| Time to break even | More than five times the project duration | Double the project duration | Project duration | |
In addition to the cost and schedule estimates required for the economic evaluation of the project, it is necessary to evaluate the magnitude of the effort required in relation to the resources of the organization. A million-dollar project could be a very small or very large project, depending on the size of the organization. The cost dimension of a project (see Table 6.8) measures this relationship.
| Evaluation Criteria | Ranking | |||
|---|---|---|---|---|
| | ||||
| Unfavorable | Favorable | |||
| | ||||
| Resources | Massively expensive | Very expensive | Moderately expensive | Affordable project |
| Time | 5 years or more | 2 years or less | 1 year or less | |
The nature of the work is an important but often neglected dimension, especially among successful organizations. The nature-of-work measurement classifies projects according to whether they support current initiatives or products or formulate the basis upon which the next generation of products will be built. The purpose of doing this is to align project work with product strategy: Are we taking care of the cash cows? Do we have enough stars? Are we spending money on any dogs? See Table 6.9.
| Nature of work | In support of: | Product Line 2 | Product Line 3 | … | Product Line n |
|---|---|---|---|---|---|
| | |||||
| Technology development | |||||
6.2.4 Establishing project dependencies (updating dependency matrix)
Projects would typically build on top of the knowledge, features, and market share developed by preceding projects. These dependencies manifest themselves in the assumptions that justify plans and business cases. Obviously, in the event of the cancellation, delay, or downsizing of any of these projects, those plans and business cases would have to reviewed; even better, before deciding on a cancellation or downsizing, we should take a look at the consequences of such a decision across the entire portfolio. Failure to consider this ripple effect could easily lead to a situation worse than the one we were trying to solve (see Figure 6.10).
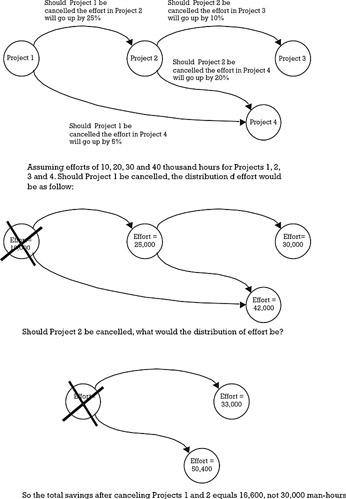
Figure 6.10: Project cancellation and the propagation of consequences.
By making the dependencies explicit and recording them on the dependency matrix introduced in Chapter 3 or in a special matrix called the propagation matrix, it would be possible to calculate the effects of any delay or cancellation decision across the project portfolio [7].
The concept of the propagation matrix and its use to spread the effect of a decision is explained in Section 6.3.5.
EAN: 2147483647
Pages: 81