Creating an Organization Chart
|
| < Day Day Up > |
|
When you create an organization chart in Word, you can create a new chart on the fly and enter text as you go, or you can build your chart from existing text in Word, PowerPoint, or Excel. Either way, creating the organization chart is a simple process that gives you the flexibility you need to fit the chart in your document and format it the way you want. Here are the steps:
-
Place the insertion point where you want to create the chart.
-
Choose Insert, Picture, Organization Chart. Word creates your basic chart-now you can enter text and add shapes as needed, as shown in Figure 14-17.
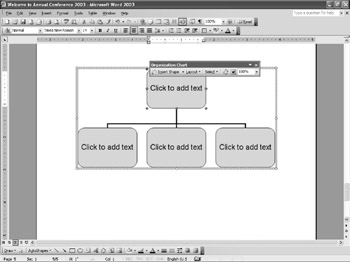
Figure 14-17: Word draws a simple organization chart and gives you the tools to add shapes as needed.
Organization Chart Elements
There aren't many parts to deal with in an organization chart. You'll use basic shapes to create relationships-subordinates, peers, and assistants-and you'll design, move, and change branches that show the relationships among people or processes. Here are the items you'll be working with in your organization charts:
-
Shapes Boxes used to name a person, identify a role, or describe a step or department.
-
Connector lines Lines that connect each shape in your chart.
-
Chart frame Border surrounding the organization chart. This is a nonprinting border, although you can add a border to the chart if you choose.
-
Organization Chart toolbar Provides the menus and tools you need to add, move, and wrap text around the chart in your document. Table 14-2 introduces the tools and gives examples of when each could be used.
| Button | Name | Description | Use |
|---|---|---|---|
| | Insert Shape | Adds subordinate, co-worker, or assistant shapes | You want to add a new position, person, or project to your chart. |
| | Layout | Changes the layout of the organization chart | You want to display the chart information in a different form. |
| | Select | Displays choices for selecting chart elements | You want to select a particular level, type of shape, or branch. |
| | AutoFormat | Provides a gallery from which you can choose predesigned chart styles | You want a professional look with coordinated colors and lines. |
| | Text Wrapping | Displays text wrap options for the placement of text around the chart | You want to arrange text around, next to, or even across your chart. |
| | Zoom | Changes the size in which the organization is displayed | You want to increase the size of the chart so that you can work with it more easily. |
Entering Text
Once you create the basic chart, you're ready to add text in the individual shapes. Simply click in the shape at the top of the chart, and then type the name of the person, position, or process. The text appears center-aligned in the shape by default, as shown in Figure 14-18.
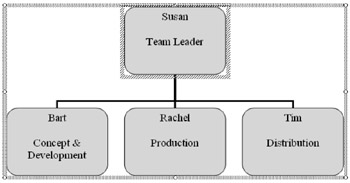
Figure 14-18: Word adds text in the default font for the current template; you can change the font, style, color, and alignment as needed.
| Note | The typical text navigation keys-Enter, Tab, and the arrow keys-don't work in the organization chart. Just move the mouse pointer, and then click to move from shape to shape. |
Inserting Shapes
When you first create an organization chart, Word gives you one superior, or lead, shape and three subordinates. For most charts, you'll want to add and reorder shapes as you build your chart. To insert shapes in your organization chart, click the shape to which you want to add a relationship. The frame for the shape changes, showing that it's selected. Next, click the Insert Shape arrow on the Organization Chart toolbar or simply click Insert Shape to add a subordinate. If you displayed the shortcut menu, choose the relationship you want to add from the menu:
-
Subordinate Adds a shape beneath the selected shape.
-
Coworker Adds a shape on the same level.
-
Assistant Adds a shape below and to one side, off the main branch.
Changing the Layout
The basic tree structure is the default arrangement for new organization charts, but you have other layouts to choose from. To see the different layouts, click Layout on the Organization Chart toolbar, as shown in Figure 14-19.
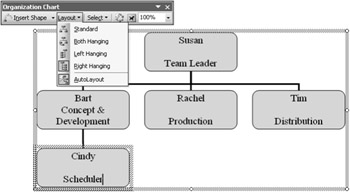
Figure 14-19: You can select a different layout for the organization chart.
Different types of organizations will lend themselves to different chart layouts, so try experimenting with the different choices to see what works best for your data. Also consider where the chart appears on the page, how it fits with your overall design, and which alignment might lead the reader's eyes in the most effective way.
Selecting Branches
As you work with your organization chart, you might find that you want to work with several items at once. You might, for example, want to change the line color for all connector lines to blue. Or you might want to add a drop-shadow to all management level shapes. Or you might want to change the fill color of individual shapes. Whatever change you want to make, you need to select the shapes before you can modify them.
You tell Word which items you want to select by using the Select menu. Then make your selection from the following choices:
-
Level All shapes on the current level
-
Branch All shapes in the current branch
-
All Assistants All assistant shapes in the chart
-
All Connecting Lines All lines in the chart so that you can change color, thickness, and so on
Note Can you raise a shape from one level to another? No-but you can simply delete the existing shape and create a new one, showing the correct relationship.
Moving Shapes and Sections
Once you select the shape or branch you want to work with, you can reorder the selections the way you want. Click the shape you want to move. If the frame appears around the shape, click the item again to display the shape handles. Next, position the pointer over one of the handles. The pointer changes to a four-sided arrow. Drag the shape to the new location in a position that is at the same level. (The shape will not move if you try to move it to a superior position.) An outline moves with the shape, and when you release the mouse button, the shape is moved to the new location.
To move an entire branch, simply click the shape at the top level of the branch you want to move so the handles appear. Then click Select on the Organization Chart toolbar, and then choose Branch from the menu. All shapes in that branch are selected. Drag the branch to the new location.
Using AutoFormat to Modify the Look
You can apply predesigned formatting to your organization chart by using AutoFormat. Click in the chart, and then click AutoFormat on the Organization Chart toolbar, and the Organization Chart Style Gallery dialog box appears, as shown in Figure 14-20. Click through the various Gallery styles to find the one you want. When you find a style that fits your document, click Apply.
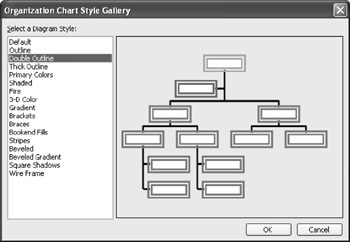
Figure 14-20: Select a style from the Organization Chart Style Gallery dialog box.
Controlling Text Wrap Around Charts and Diagrams
The text wrap feature works the same way for organization charts that it does for pictures and other objects in your Word documents. Simply click the Text Wrapping tool, and then choose the wrapping style that fits what you're trying to do. Here's a quick review of the choices:
-
In Line With Text Places the chart on the same line as the current text
-
Square Runs text up to the edge of a squared area around the chart
-
Tight Wraps the text tightly against the outline of the organization chart
-
Behind Text Runs text over the top of the chart
-
In Front Of Text Places text behind the chart
-
Top And Bottom Wraps text above and below the chart
-
Through Runs text through the white space in the organization chart
-
Edit Wrap Points Allows you to add custom points so that you can create your own text wrap boundary around the chart
|
| < Day Day Up > |
|
EAN: 2147483647
Pages: 373