Tool 8: Affinity Diagram
| AKA | K-J Method, Affinity Analysis |
| Classification | Idea Generating (IG) |
Tool description
First developed and used in the 1960s by Jiro Kawakita, the affinity diagram is the product of a team's brainstorming and consensus activities. This creative process gathers large amounts of data (ideas, issues, opinions, facts, etc.) and organizes them into logical groupings based on the natural relationships among items.
Typical application
-
Sort by affinity large volume of data.
-
Identify key ideas for process improvement.
-
Push for creativity and breakthroughs.
-
Determine requirements for action plans.
-
Point to potential solutions to problems.
-
Identify patterns among seemingly unrelated factors.
Problem-solving phase
| → | Select and define problem or opportunity |
| → | Identify and analyze causes or potential change |
| → | Develop and plan possible solutions or change |
| Implement and evaluate solution or change | |
| Measure and report solution or change results | |
| Recognize and reward team efforts |
Typically used by
| Research/statistics | |
| 1 | Creativity/innovation |
| Engineering | |
| Project management | |
| Manufacturing | |
| Marketing/sales | |
| Administration/documentation | |
| 3 | Servicing/support |
| Customer/quality metrics | |
| 2 | Change management |
before
-
Brainstorming
-
Brainwriting pool
-
Events log
-
Focus group
-
Consensus decision
after
-
Interrelationship digraph (I.D.)
-
Tree Diagram
-
Action plan
-
Factor analysis
-
Potential problem analysis (PPA)
Notes and key points
-
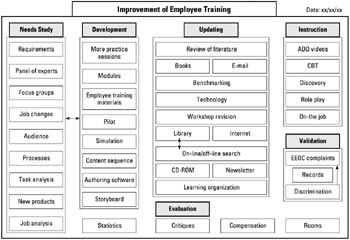
Typical affinity: 6-8 participants, 6-10 groupings of ideas, 50-100 ideas. Connect interrelated groupings with ⃡ and cause and effect with →.
Step-by-step procedure
-
STEP 1 Form a diverse team of 6-8 participants.
-
STEP 2 Write the issue or problem on a flip chart—no further explanation should be given. See example Improvement of Employee Training.
-
STEP 3 Participants generate and record ideas on 3 5 cards or post-its, one idea per card.
-
STEP 4 After approximately 15 minutes, cards are collected and randomly spread out on a large table or posted on a wall.
-
STEP 5 Participants sort cards in silence, placing related ideas into a grouping. Cards that do not fit are "loners" and kept outside the groups. Groups are reviewed and consensus is reached on ideas that are placed in a particular group.
-
STEP 6 A serach takes place to select a card in each grouping that captures the meaning of that group. This card is considered to be the header and is placed on top of the group. If unable to do this step, a header card is created by teh team.
-
STEP 7 Steps 3-6 are repeated to expand groupings, create others, and gain more ideas.
-
STEP 8 An affinity diagram is created by laying out groups. Place closely related groups together. Draw outlines for each group with the header card placed on top.
-
STEP 9 Team checks the final affinity diagram, makes modifications if needed, then titles and dates the diagram.
Example of tool application
EAN: 2147483647
Pages: 326