Tool 75: Fault Tree Analysis (FTA)
| AKA | N/A |
| Classification | Analyzing/Trending (AT) |
Tool description
The fault tree analysis (FTA) was first introduced by Bell Laboratories. It is a logical tool that assists in the uncovering of potential root causes of defects or equipment failures. It can, however, be applied to administrative areas as well. Similar to a tree diagram, the output is the result of various levels of contributing factors or potential causes for failure.
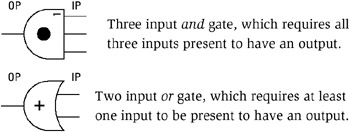
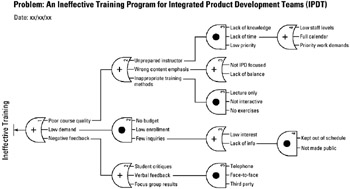
The logic behind this diagram uses and and or function gates to illustrate symptoms of failure down to real root causes. As shown in the fault tree analysis, an or (+) function gate will, for example, have an output of few inquiries as a result of input low interest, lack of info, or both. On the other hand, an and (•) function gate will show a true output of unprepared instructor only if all and inputs are true. This type of analysis, therefore, provides great insight into the interrelationships among the various cause and effect conditions.
Typical application
-
To allow a backward approach to systematically identify potential causes of failures.
-
To provide an overview of interrelationships between causes and failures.
-
To break down failure indications into more detailed input branches.
Problem-solving phase
| → | Select and define problem or opportunity |
| → | Identify and analyze causes or potential change |
| → | Develop and plan possible solutions or change |
| Implement and evaluate solution or change | |
| Measure and report solution or change results | |
| Recognize and reward team efforts |
Typically used by
| Research/statistics | |
| Creativity/innovation | |
| 4 | Engineering |
| Project management | |
| 2 | Manufacturing |
| Marketing/sales | |
| Administration/documentation | |
| 3 | Servicing/support |
| Customer/quality metrics | |
| 1 | Change management |
before
-
Problem specification
-
Checklist
-
Failure Mode Effect Analysis
-
Dendrogram
-
Events log
after
-
Countermeasures matrix
-
Potential problem analysis (PPA)
-
What-if analysis
-
Process analysis
-
Problem analysis
Notes and key points
The fault tree is drawn using two logic gates interconnected in various functions.
| Note | This tool works well with other major tools, such as quality function deployment, metrics, and management by policy. |
Step-by-step procedure
-
STEP 1 The first step for a team is to write down the failure as an output for the top or gate (Level 1). See example Problem! An Ineffective Training Program for Integrated Product Development Teams (IPDT).
-
STEP 2 Determine what input (symptoms) could be considered a contributing element (Level 2).
-
STEP 3 Continue breaking down the failure with additional gate levels (Levels 3, 4 or more).
-
STEP 4 Always ask yourself: Can this gate output be true with any input (or function), or does all input need to be present for a true gate output (and function)?
-
STEP 5 Lastly, finalize and date the diagram.
Example of tool application
EAN: 2147483647
Pages: 326