6.9 Clustering Border Smugglers with a SOM: A Demonstration
6.9 Clustering Border Smugglers with a SOM: A Demonstration
Dr. Kohonen's SOM is one of the most popular artificial neural network algorithms in the world. This type of neural network can be used to discover clusters of similar records in a database; for example, a case study will be provided in which investigators use a SOM to associate MOs to a network of criminals. The learning process of SOMs is competitive and unsupervised, meaning that there is no teacher to define the correct output, as there is with most of the other types of neural networks. A SOM is, thus, most commonly used to find hidden clusters in databases automatically. Applications abound in finance, marketing, and medicine, and we will see how it can be used in the context of investigative data mining in this demonstration.
The architecture and function of a SOM is like that of a fabric wrapping itself around database records with similar features. A SOM, for example, can transform a database of, say, fraudulent and legal transactions into a two-dimensional, discrete color map so that the illegal transactions are red and the legal ones are blue. This neural network works by performing tests for similarities in the data in order to identify distinct clusters of fraud versus legal records and organize them accordingly. In a two-dimensional graph from which further explorations can be performed. Another way this type of clustering network might be used is in the detection of potential smugglers at a border crossing. Envision an immigration inspector keying in the plate number of an auto at a point-of-entry border station, relaying the information to a centralized system containing a model that uses data from INS, the Departments of Transportation, the Treasury, and the Social Security Administration. In this scenario, important data relating to this visitor's activity can be used to develop a clustering profile, which may warrant issuing an alert, resulting in the inspector taking further steps in questioning a particular driver. There are several ways such a model could be constructed, including through the use of a neural network, either an MLP or a SOM, or through the use of machine-learning algorithms, as we shall demonstrate in the next chapter.
To demonstrate how a SOM-based system would perform and could be used to extract distinct features from a database in a totally autonomous and automatic method, we will use a data set we will call Border Profile, containing the following values:
AGENCY DATA SOURCES Transportation_(Truck_License_1=Yes_0=No) : A 1 increases the alert Immigration (Number_Trips_Abroad): A high number increases the alert Treasury (Number_of_Wire_Transfers): A high number increases the alert SSN (Days_Since_Issued_Number): A lower number increases the alert Profile_Score: Range from 0-100, the higher the number increases the ALERT
The data itself would look like that in Figure 6.5 in a spreadsheet format. Note the profile score is the rightmost cell, with 100 representing instances of a detection at a border point-of-entry culminating in an arrest.
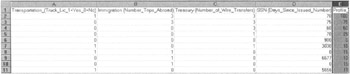
Figure 6.5: This is how the data looks in our Border Profile database.
For example, the first record is a high-risk target; its parameters are as follows:
Transportation Truck License is Yes = 1 Immigration Number of Trips is = 3 Treasury Number of Wire Transfers is = 3 Social Security Number Days Since Issue is = 70 Profile is = 100 (High Alert)
On the other hand, for record 7 the values are quite different:
Transportation Truck License is Yes = 1 Immigration Number of Trips is = 0 Treasury Number of Wire Transfers is = 0 Social Security Number Days Since Issue is = 3030 Profile is = 10 (Very Low Alert)
After importing the data, the SOM tool is allowed to train itself and discover key clusters; the error rate starts dropping after a few minutes. Once the training is complete, a two-dimensional map is generated by the SOM tool and is reviewed with the objective of looking at those occurrences where inspections led to the apprehension of illegal entries and eventual arrests. Different clusters are created by the SOM ranging from low- to moderate- and high-alert status. Those instances were scored in a scale from 0 to 100 with the higher values indicating arrest (see Figure 6.6).
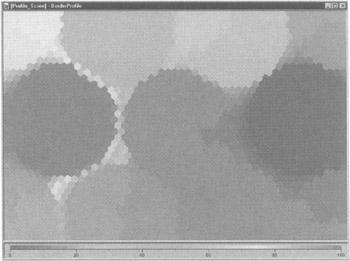
Figure 6.6: The different colors represent different stages of alerts.
This tool, called SOMine is from Eudaptics, a data mining company from Austria (http://www.eudaptics.com/home/index.html). It supports the further exploration of the clusters it discovered. For example, the dark cluster on the left side of the map, which represents illegal detentions, can be marked and extracted as a text file (see Figure 6.7).
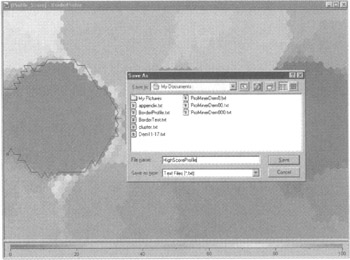
Figure 6.7: The cluster of arrests can be marked and exported to a file.
In other words, a sub-set of the data can be cut out and pasted as a separate database. This new data set will represent only the dark cluster of detections that led to "arrests."
The user can mark and extract the dark cluster, exporting it into a spreadsheet for further analysis. In the spreadsheet of highly scored smugglers, we can further explore a range of factors about these individual accounts, such as their average number of days (84) since the Social Security Administration issued a number to them or the average number of trips abroad (3) and average number of wire transfers (5), etc.
However, this would only be the start of this type of investigative data mining analysis. Additional information can be associated to these records to further develop a profile of these individuals. For example, there are a host of other demographics from commercial data providers. There are also additional attributes that could be matched from other government databases, such as vehicle records and license information that could be associated to them. For example, what are the demographics of their neighborhoods at the zip-code and geo-code level. Are these individuals students? What are their median ages? What is the dominant gender? What are their income ranges? Through the use of a SOM, further clues and features can be developed for the creation of a profile about potential smugglers and their lifestyle and socioeconomic features.
EAN: 2147483647
Pages: 232