Checking the Plan s Duration
Checking the Plan’s Duration
At this point, you might want to know how long the project is expected to take. You haven’t directly entered a total project duration or finish date, but Project has calculated these values, based on individual task durations and task relationships. An easy way to see the project’s scheduled finish date is via the Project Information dialog box.
In this exercise, you see the current total duration and scheduled finish date of the project, based on the task durations and relationships you’ve entered.
-
On the Project menu, click Project Information.
The Project Information dialog box appears.
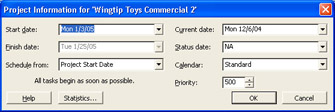
Note the Finish date: 1/25/05.
Tip This tip describes enterprise project management (EPM) functionality. If you are running Project Professional, you will see a slightly different dialog box. The Project Information dialog box in Project Professional includes an Enterprise Custom Fields section. Enterprise custom fields are used only with Project Server. For more information about Project Server, see Part 4, “Introducing Project Server.”
You can’t edit the finish date directly because this project is set to be scheduled from the start date. Project calculates the project’s finish date based on the total number of working days required to complete the tasks, starting at the project’s start date. As this project plan is now built, any change to the start date will cause Project to recalculate the finish date.
Next let’s look at the duration information in more detail.
-
Click the Statistics button.
The Project Statistics dialog box appears:
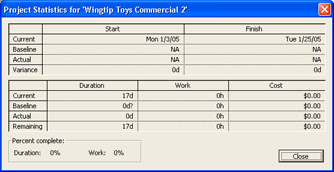
You don’t need to pay attention to all these numbers yet, but the current finish date and the current duration are worth noting. The duration is the number of working days in the project calendar between the project’s start date and finish date.
You can visually verify these numbers on the Gantt chart.
-
Click the Close button to close the Project Statistics dialog box.
-
Click the Show/Hide Project Guide button on the Project Guide toolbar.
The Project Guide closes. Next you will look at the complete project by changing the timescale in the Gantt Chart view.
-
On the View menu, click Zoom.
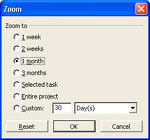
The Zoom dialog box appears.
-
Click Entire project, and then click OK.
The entire project appears on the screen. Your screen should look similar to the following illustration:
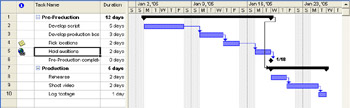
You can see the project’s overall duration in the Gantt Chart view.
| Tip | You can also click the Zoom In and Zoom Out buttons to change the timescale of the Gantt Chart view. |
CLOSE: the Wingtip Toys Commercial 2 file.
EAN: 2147483647
Pages: 199