Section 11.4. Kernel Memory Allocator Tracing
11.4. Kernel Memory Allocator TracingThe slab allocator includes a general-purpose allocation tracing facility that tracks the allocation history of objects. The facility is switched off by default and can be enabled by setting the system variable kmem_flags. The tracing facility captures the stack and history of allocations into a slab cache, named as the name of the cache being traced, with .DEBUG appended to it. Audit tracing can be enabled by the following:
11.4.1. Enabling KMA DEBUG FlagsThe following simple example shows how to trace a cache that is created on a large system, after the flags have been set. To enable tracing on all caches, the system must be booted with kmdb and the kmem_flags variable set. The steps for such booting are shown below. ok boot kmdb -d Loading kmdb... Welcome to kmdb [0]> kmem_flags/D kmem_flags: kmem_flags: 0 [0]> kmem_flags/W 0x1f kmem_flags: 0x0 = 0x1f [0]> :c SunOS Release 5.10 Version gate:2004-10-18 32-bit Copyright 1983-2004 Sun Microsystems, Inc. All rights reserved. Use is subject to license terms. Loaded modules: [ ufs unix krtld genunix specfs ] ... If instead, you're doing this with a system where GRUB is used to boot Solaris, you add the -kd to the "kernel" line in the GRUB menu entry (you can edit GRUB menu entries for this boot by using the GRUB menu interface, and the "e" (for edit) key). Note that the total number of allocations traced will be limited by the size of the audit cache parameters, shown in Table 11.14. Table 11.14 shows the parameters that control kernel memory debugging.
11.4.2. Examining Kernel Memory Allocations with MDBRecall from Section 11.2.3.9 how we can use the ::kmastat dcmd to view the kmem caches. Another way to list the various kmem caches is with the ::kmem_cache command. # mdb -k > ::kmem_cache ADDR NAME FLAG CFLAG BUFSIZE BUFTOTL ffffffff80021008 kmem_magazine_1 0000 080000 16 18900 ffffffff80021748 kmem_magazine_3 0000 080000 32 5922 ffffffff80022008 kmem_magazine_7 0000 080000 64 7497 ... ffffffff80025748 kmem_slab_cache 0000 080000 56 150912 ffffffff80026008 kmem_bufctl_cache 0000 080000 24 895608 ffffffff80026748 kmem_bufctl_audit_cache 0000 080000 192 0 ffffffff80027008 kmem_va_4096 0200 110000 4096 204640 ffffffff80027748 kmem_va_8192 0200 110000 8192 4880 ffffffff80029008 kmem_va_12288 0200 110000 12288 930 ... ffffffff8002c008 kmem_alloc_8 0000 200000 8 55045 ffffffff8002c748 kmem_alloc_16 0000 200000 16 11340 ffffffff8002d008 kmem_alloc_24 0000 200000 24 7896 ffffffff8002d748 kmem_alloc_32 0000 200000 32 15120 ffffffff8002e008 kmem_alloc_40 0000 200000 40 15150 ffffffff8002e748 kmem_alloc_48 0000 200000 48 54936 ... This command is useful because it maps cache names to addresses and provides the debugging flags for each cache in the FLAG column. It is important to understand that the allocator's selection of debugging features is derived on a per-cache basis from this set of flags. These are set in conjunction with the global kmem_flags variable at cache creation time. Setting kmem_flags while the system is running has no effect on the debugging behavior, except for subsequently created caches (which is rare after boot-up). Next, walk the list of kmem caches directly by using MDB's kmem_cache walker. > ::walk kmem_cache ffffffff80021008 ffffffff80021748 ffffffff80022008 ffffffff80022748 ffffffff80023008 ffffffff80023748 ... This produces a list of pointers that correspond to each kmem cache in the kernel. To find out about a specific cache, apply the kmem_cache dcmd. > ffffffff80021008::kmem_cache ADDR NAME FLAG CFLAG BUFSIZE BUFTOTL ffffffff80021008 kmem_magazine_1 0000 080000 16 18900 Important fields for debugging include bufsize, flags, and name. The name of the kmem_cache (in this case, kmem_alloc_24) indicates its purpose in the system. bufsize gives the size of each buffer in this cache; in this case, the cache is used for allocations of size 24 and smaller. flags tells what debugging features are turned on for this cache. You can find the debugging flags listed in sys/kmem_impl.h. In this case, flags is 0x20f, which is KMF_AUDIT | KMF_DEADBEEF | KMF_REDZONE | KMF_CONTENTS | KMF_HASH. The debugging features are explained in subsequent sections. When you are interested in looking at buffers in a particular cache, you can walk the allocated and freed buffers in that cache directly. > ffffffff80021008::walk kmem fffffe810c652000 fffffe810c652010 fffffe810c652020 fffffe810c652030 ... MDB provides a shortcut to supplying the cache address to the kmem walker: a specific walker is provided for each kmem cache, and its name is the same as the name of the cache. For example: > ::walk kmem_alloc_24 ffffffff80120008 ffffffff80120020 ffffffff80120038 ffffffff80120050 ffffffff80120068 ... > ::walk thread_cache ffffffff82f60120 ffffffff81f00140 ffffffff85320500 ffffffff852e0580 ffffffff81f004a0 ffffffff82f607e0 ... Now you know how to iterate over the kernel memory allocator's internal data structures and examine the most important members of the kmem_cache data structure. 11.4.3. Detecting Memory CorruptionOne of the primary debugging features of the allocator is the inclusion of algorithms for quick recognition of data corruption. When corruption is detected, the allocator immediately panics the system. This section describes how the allocator recognizes data corruption; you must understand this process to be able to debug these problems. Memory abuse typically falls into one of the following categories:
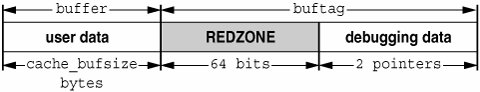
Keep these problems in mind as you read the next three sections. They will help you understand the allocator's design and enable you to diagnose problems more efficiently. 11.4.4. Checking a Freed Buffer: 0xdeadbeefWhen the KMF_DEADBEEF (0x2) bit is set in the flags field of a kmem_cache, the allocator tries to make memory corruption easy to detect by writing a special pattern into all freed buffers. This pattern is 0xdeadbeef. Since a typical region of memory contains both allocated and freed memory, sections of each kind of block will be interspersed; here is an example from the kmem_alloc_24 cache. 0x70a9add8: deadbeef deadbeef 0x70a9ade0: deadbeef deadbeef 0x70a9ade8: deadbeef deadbeef 0x70a9adf0: feedface feedface 0x70a9adf8: 70ae3260 8440c68e 0x70a9ae00: 5 4ef83 0x70a9ae08: 0 0 0x70a9ae10: 1 bbddcafe 0x70a9ae18: feedface 139d 0x70a9ae20: 70ae3200 d1befaed 0x70a9ae28: deadbeef deadbeef 0x70a9ae30: deadbeef deadbeef 0x70a9ae38: deadbeef deadbeef 0x70a9ae40: feedface feedface 0x70a9ae48: 70ae31a0 8440c54e The buffer beginning at 0x70a9add8 is filled with the 0xdeadbeef pattern, which is an immediate indication that the buffer is currently free. At 0x70a9ae28 another free buffer begins; at 0x70a9ae00 an allocated buffer is located between them. Note: You might have observed that there are some holes in this picture. Three 24-byte regions should occupy only 72 bytes of memory, instead of the 120 bytes shown here. This discrepancy is explained in the next section. 11.4.5. Debugging with the Redzone Indicator: 0xfeedfaceThe pattern 0xfeedface appears frequently in the buffer above. This pattern is known as the "redzone" indicator. It enables the allocator (and a programmer debugging a problem) to determine if the boundaries of a buffer have been violated by "buggy" code. Following the redzone is some additional information. The contents of that data depend on other factors (see Section 11.4.8). The redzone and its suffix are collectively called the buftag region. Figure 11.8 summarizes this information. Figure 11.8. The Redzone The buftag is appended to each buffer in a cache when any of the KMF_AUDIT, KMF_DEADBEEF, or KMF_REDZONE flags are set in that buffer's cache. The contents of the buftag depend on whether KMF_AUDIT is set. Decomposing the memory region presented above into distinct buffers is now simple. 0x70a9add8: deadbeef deadbeef \ 0x70a9ade0: deadbeef deadbeef +- User Data (free) 0x70a9ade8: deadbeef deadbeef / 0x70a9adf0: feedface feedface -- REDZONE 0x70a9adf8: 70ae3260 8440c68e -- Debugging Data 0x70a9ae00: 5 4ef83 \ 0x70a9ae08: 0 0 +- User Data (allocated) 0x70a9ae10: 1 bbddcafe / 0x70a9ae18: feedface 139d -- REDZONE 0x70a9ae20: 70ae3200 d1befaed -- Debugging Data 0x70a9ae28: deadbeef deadbeef \ 0x70a9ae30: deadbeef deadbeef +- User Data (free) 0x70a9ae38: deadbeef deadbeef / 0x70a9ae40: feedface feedface -- REDZONE 0x70a9ae48: 70ae31a0 8440c54e -- Debugging Data In the free buffers at 0x70a9add8 and 0x70a9ae28, the redzone is filled with 0xfeedfacefeedface. This a convenient way of determining that a buffer is free. In the allocated buffer beginning at 0x70a9ae00, the situation is different. There are two allocation types:
For example, a request for 20 bytes will be fulfilled from the kmem_alloc_24 cache. The allocator enforces the buffer boundary by placing a marker, the redzone byte, immediately following the client data. 0x70a9ae00: 5 4ef83 \ 0x70a9ae08: 0 0 +- User Data (allocated) 0x70a9ae10: 1 bbddcafe / 0x70a9ae18: feedface 139d -- REDZONE 0x70a9ae20: 70ae3200 d1befaed -- Debugging Data 0xfeedface at 0x70a9ae18 is followed by a 32-bit word containing what seems to be a random value. This number is actually an encoded[3] representation of the size of the buffer. To decode this number and find the size of the allocated buffer, use the following formula:
size = redzone_value / 251 So, in this example, size = 0x139d / 251 = 20 bytes. This result shows that the buffer requested was of size 20 bytes. The allocator performs this decoding operation and finds that the redzone byte should be at offset 20. The redzone byte is the hex pattern 0xbb, which is present at 0x729084e4 (0x729084d0 + 0t20) as expected (Figure 11.9). Figure 11.9. Sample kmem_alloc(9F) Buffer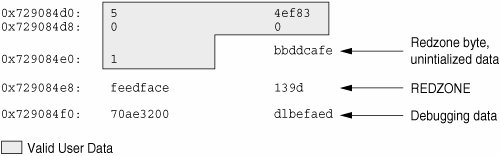 Figure 11.10 shows the general form of this memory layout. Figure 11.10. Redzone ByteIf the allocation size is the same as the bufsize of the cache, the redzone byte overwrites the first byte of the redzone itself, as shown in Figure 11.11. Figure 11.11. Redzone Byte at the Beginning of the Redzone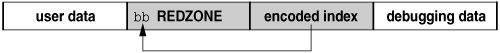 This overwriting results in the first 32-bit word of the redzone being 0xbbedface or 0xfeedfabb, depending on the endianness of the hardware on which the system is running. 11.4.6. Detecting Uninitialized Data: 0xbaddcafeYou might be wondering what the suspicious 0xbbddcafe at address 0x729084d4 was before the redzone byte got placed over the first byte in the word. It was 0xbaddcafe. When the KMF_DEADBEEF flag is set in the cache, allocated but uninitialized memory is filled with the 0xbaddcafe pattern. When the allocator performs an allocation, it loops across the words of the buffer and verifies that each word contains 0xdeadbeef, then fills that word with 0xbaddcafe. A system can panic with a message such as the following: panic[cpu1]/thread=e1979420: BAD TRAP: type=e (Page Fault) rp=ef641e88 addr=baddcafe occurred in module "unix" due to an illegal access to a user address In this case, the address that caused the fault was 0xbaddcafe: The panicking thread has accessed some data that was never initialized. 11.4.7. Associating Panic Messages with FailuresThe kernel memory allocator emits panic messages corresponding to the failure modes described earlier. For example, a system can panic with a message like this: kernel memory allocator: buffer modified after being freed modification occurred at offset 0x30 The allocator was able to detect this case because it tried to validate that the buffer in question was filled with 0xdeadbeef. At offset 0x30, this condition was not met. Since this condition indicates memory corruption, the allocator panicked the system. Another example failure message is kernel memory allocator: redzone violation: write past end of buffer The allocator was able to detect this case because it tried to validate that the redzone byte (0xbb) was in the location it determined from the redzone size encoding. It failed to find the signature byte in the correct location. Since this circumstance indicates memory corruption, the allocator panicked the system. Other allocator panic messages are discussed later. 11.4.8. Memory Allocation LoggingThis section explains the logging features of the kernel memory allocator and describes how you can employ them to debug system crashes. 11.4.8.1. Buftag Data IntegrityAs explained earlier, the second half of each buftag contains extra information about the corresponding buffer. Some of this data is debugging information, and some is data private to the allocator. While this auxiliary data can take several different forms, it is collectively known as "Buffer Control" or bufctl data. However, the allocator needs to know whether a buffer's bufctl pointer is valid since this pointer might also have been corrupted by malfunctioning code. The allocator confirms the integrity of its auxiliary pointer by storing the pointer and an encoded version of that pointer and then cross-checking the two versions. As shown in Figure 11.12, these pointers are the bcp (buffer control pointer) and bxstat (buffer control XOR status). The allocator arranges bcp and bxstat so that the expression bcp XOR bxstat equals a well-known value. Figure 11.12. Extra Debugging Data in the Buftag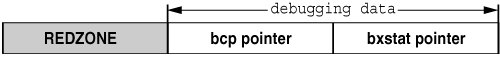 In the event that one or both of these pointers become corrupted, the allocator can easily detect such corruption and panic the system. When a buffer is allocated, bcp XOR bxstat = 0xa110c8ed ("allocated"). When a buffer is free, bcp XOR bxstat = 0xf4eef4ee ("freefree"). Note: You might find it helpful to reexamine the example provided in Section 11.4.4 in order to confirm that the buftag pointers shown there are consistent. In the event that the allocator finds a corrupt buftag, it panics the system and produces a message similar to the following: kernel memory allocator: boundary tag corrupted bcp ^ bxstat = 0xffeef4ee, should be f4eef4ee Remember, if bcp is corrupt, it is still possible to retrieve its value by taking the value of bxstat XOR 0xf4eef4ee or bxstat XOR 0xa110c8ed, depending on whether the buffer is allocated or free. 11.4.8.2. The bufctl PointerThe buffer control (bufctl) pointer contained in the buftag region can have different meanings, depending on the cache's kmem_flags. The behavior toggled by the KMF_AUDIT flag is of particular interest: When the KMF_AUDIT flag is not set, the kernel memory allocator allocates a kmem_bufctl_t structure for each buffer. This structure contains some minimal accounting information about each buffer. When the KMF_AUDIT flag is set, the allocator instead allocates a kmem_bufctl_audit_t structure, an extended version of the kmem_bufctl_t structure. This section presumes the KMF_AUDIT flag is set. For caches that do not have this bit set, the amount of available debugging information is reduced. The kmem_bufctl_audit_t structure (bufctl_audit for short) contains additional information about the last transaction that occurred on this buffer. The following example shows how to apply the bufctl_audit macro to examine an audit record. The buffer shown is the example buffer used in Section 11.4.4. > 0x70a9ae00,5/KKn 0x70a9ae00: 5 4ef83 0 0 1 bbddcafe feedface 139d 70ae3200 d1befaed With the techniques presented above, it is easy to see that 0x70ae3200 points to the bufctl_audit record: It is the first pointer following the redzone. To examine the bufctl_audit record it points to, apply the bufctl_audit macro. > 0x70ae3200$<bufctl_audit 0x70ae3200: next addr slab 70378000 70a9ae00 707c86a0 0x70ae320c: cache timestamp thread 70039928 e1bd0e26afe 70aac4e0 0x70ae321c: lastlog contents stackdepth 7011c7c0 7018a0b0 4 0x70ae3228: kmem_zalloc+0x30 pid_assign+8 getproc+0x68 cfork+0x60 The addr field is the address of the buffer corresponding to this bufctl_audit record. This is the original address: 0x70a9ae00. The cache field points at the kmem_cache that allocated this buffer. You can use the ::kmem_cache dcmd to examine it. > 0x70039928::kmem_cache ADDR NAME FLAG CFLAG BUFSIZE BUFTOTL 70039928 kmem_alloc_24 020f 000000 24 612 The timestamp field represents the time this transaction occurred. This time is expressed in the same manner as gethrtime(3C). tHRead is a pointer to the thread that performed the last transaction on this buffer. The lastlog and contents pointers point to locations in the allocator's transaction logs. These logs are discussed in detail in Section 11.4.11. Typically, the most useful piece of information provided by bufctl_audit is the stack trace recorded at the point at which the transaction took place. In this case, the transaction was an allocation called as part of executing fork(2). 11.4.9. Analyzing Memory with Advanced TechniquesThis section describes facilities for performing advanced memory analysis, including locating memory leaks and sources of data corruption. 11.4.9.1. Finding Memory LeaksThe ::findleaks dcmd provides powerful and efficient detection of memory leaks in kernel crash dumps for which the full set of kmem debug features has been enabled. The first execution of ::findleaks processes the dump for memory leaks (this can take a few minutes), and then coalesces the leaks by the allocation stack trace. The findleaks report shows a bufctl address and the topmost stack frame for each memory leak that was identified. > ::findleaks CACHE LEAKED BUFCTL CALLER 70039ba8 1 703746c0 pm_autoconfig+0x708 70039ba8 1 703748a0 pm_autoconfig+0x708 7003a028 1 70d3b1a0 sigaddq+0x108 7003c7a8 1 70515200 pm_ioctl+0x187c ------------------------------------------------------ Total 4 buffers, 376 bytes Using the bufctl pointers, you can obtain the complete stack backtrace of the allocation by applying the bufctl_audit macro. > 70d3b1a0$<bufctl_audit 0x70d3b1a0: next addr slab 70a049c0 70d03b28 70bb7480 0x70d3b1ac: cache timestamp thread 7003a028 13f7cf63b3 70b38380 0x70d3b1bc: lastlog contents stackdepth 700d6e60 0 5 0x70d3b1c8: kmem_alloc+0x30 sigaddq+0x108 sigsendproc+0x210 sigqkill+0x90 kill+0x28 You can usually use the bufctl_audit information and the allocation stack trace to quickly track down the code path that leaks the given buffer. 11.4.9.2. Finding References to DataWhen trying to diagnose a memory corruption problem, you should know what other kernel entities hold a copy of a particular pointer. This is important because it can reveal which thread accessed a data structure after it was freed. It can also make it easier to understand what kernel entities are sharing knowledge of a particular (valid) data item. You use the ::whatis and ::kgrep dcmds to answer these questions. You can apply ::whatis to a value of interest. > 0x705d8640::whatis 705d8640 is 705d8640+0, allocated from streams_mblk In this case, 0x705d8640 is revealed to be a pointer to a STREAMS mblk structure. To see the entire allocation tree, use ::whatis -a instead. > 0x705d8640::whatis -a 705d8640 is 705d8640+0, allocated from streams_mblk 705d8640 is 705d8000+640, allocated from kmem_va_8192 705d8640 is 705d8000+640 from kmem_default vmem arena 705d8640 is 705d2000+2640 from kmem_va vmem arena 705d8640 is 705d2000+2640 from heap vmem arena This command reveals that the allocation also appears in the kmem_va_8192 cachea kmem cache that is fronting the kmem_va vmem arena. It also shows the full stack of vmem allocations. The complete list of kmem caches and vmem arenas is displayed by the ::kmastat dcmd. You can use ::kgrep to locate other kernel addresses that contain a pointer to this mblk. This approach illustrates the hierarchical nature of memory allocations in the system; in general, you can determine the type of object referred to by the given address from the name of the most specific kmem cache. > 0x705d8640::kgrep 400a3720 70580d24 7069d7f0 706a37ec 706add34 And you can investigate them by applying ::whatis again. > 400a3720::whatis 400a3720 is in thread 7095b240's stack > 706add34::whatis 706add34 is 706add20+14, allocated from streams_dblk_120 Here, one pointer is located on the stack of a known kernel thread, and another is the mblk pointer inside of the corresponding STREAMS dblk structure. 11.4.10. Finding Corrupt Buffers with ::kmem_verifyThe MDB ::kmem_verify dcmd implements most of the same checks that the kmem allocator does at runtime. ::kmem_verify can be invoked in order to scan every kmem cache with appropriate kmem_flags or to examine a particular cache. Here is an example of using ::kmem_verify to isolate a problem. > ::kmem_verify Cache Name Addr Cache Integrity kmem_alloc_8 70039428 clean kmem_alloc_16 700396a8 clean kmem_alloc_24 70039928 1 corrupt buffer kmem_alloc_32 70039ba8 clean kmem_alloc_40 7003a028 clean kmem_alloc_48 7003a2a8 clean ... It is easy to see here that the kmem_alloc_24 cache contains what ::kmem_verify believes to be a problem. With an explicit cache argument, the ::kmem_verify dcmd provides more detailed information about the problem. > 70039928::kmem_verify Summary for cache 'kmem_alloc_24' buffer 702babc0 (free) seems corrupted, at 702babc0 The next step is to examine the buffer that ::kmem_verify believes to be corrupt. > 0x702babc0,5/KKn 0x702babc0: 0 deadbeef deadbeef deadbeef deadbeef deadbeef feedface feedface 703785a0 84d9714e The reason that ::kmem_verify flagged this buffer is now clear: The first word in the buffer (at 0x702babc0) should probably be filled with the 0xdeadbeef pattern, not with a 0. At this point, examining the bufctl_audit for this buffer might yield clues about what code recently wrote to the buffer, indicating where and when it was freed. Another useful technique in this situation is to use ::kgrep to search the address space for references to address 0x702babc0, in order to discover what threads or data structures are still holding references to this freed data. 11.4.11. Using the Allocator Logging FacilityWhen KMF_AUDIT is set for a cache, the kernel memory allocator maintains a log that records the recent history of its activity. This transaction log records bufctl_audit records. If the KMF_AUDIT and the KMF_CONTENTS flags are both set, the allocator generates a contents log that records portions of the actual contents of allocated and freed buffers. The structure and use of the contents log is outside the scope of this book. The transaction log is discussed in this section. MDB provides several facilities for displaying the transaction log. The simplest is ::walk kmem_log, which prints out the transaction in the log as a series of bufctl_audit_t pointers. > ::walk kmem_log 70128340 701282e0 70128280 70128220 701281c0 ... > 70128340$<bufctl_audit 0x70128340: next addr slab 70ac1d40 70bc4ea8 70bb7c00 0x7012834c: cache timestamp thread 70039428 e1bd7abe721 70aacde0 0x7012835c: lastlog contents stackdepth 701282e0 7018f340 4 0x70128368: kmem_cache_free+0x24 nfs3_sync+0x3c vfs_sync+0x84 syssync+4 A more elegant way to view the entire transaction log is by using the ::kmem_log command. > ::kmem_log CPU ADDR BUFADDR TIMESTAMP THREAD 0 70128340 70bc4ea8 e1bd7abe721 70aacde0 0 701282e0 70bc4ea8 e1bd7aa86fa 70aacde0 0 70128280 70bc4ea8 e1bd7aa27dd 70aacde0 0 70128220 70bc4ea8 e1bd7a98a6e 70aacde0 0 701281c0 70d03738 e1bd7a8e3e0 70aacde0 ... 0 70127140 70cf78a0 e1bd78035ad 70aacde0 0 701270e0 709cf6c0 e1bd6d2573a 40033e60 0 70127080 70cedf20 e1bd6d1e984 40033e60 0 70127020 70b09578 e1bd5fc1791 40033e60 0 70126fc0 70cf78a0 e1bd5fb6b5a 40033e60 0 70126f60 705ed388 e1bd5fb080d 40033e60 0 70126f00 705ed388 e1bd551ff73 70aacde0 ... The output of ::kmem_log is sorted in descending order by timestamp. The ADDR column is the bufctl_audit structure corresponding to that transaction; BUFADDR points to the actual buffer. These figures represent transactions on buffers (both allocations and frees). When a particular buffer is corrupted, it can be helpful to locate that buffer in the transaction log, then determine in which other transactions the transacting thread was involved. This can help you assemble a picture of the sequence of events that occurred before and after the allocation (or free) of a buffer. You can employ the ::bufctl command to filter the output of walking the transaction log. The ::bufctl -a command filters the buffers in the transaction log by buffer address. This example filters on buffer 0x70b09578. > ::walk kmem_log | ::bufctl -a 0x70b09578 ADDR BUFADDR TIMESTAMP THREAD CALLER 70127020 70b09578 e1bd5fc1791 40033e60 biodone+0x108 70126e40 70b09578 e1bd55062da 70aacde0 pageio_setup+0x268 70126de0 70b09578 e1bd52b2317 40033e60 biodone+0x108 70126c00 70b09578 e1bd497ee8e 70aacde0 pageio_setup+0x268 70120480 70b09578 e1bd21c5e2a 70aacde0 elfexec+0x9f0 70120060 70b09578 e1bd20f5ab5 70aacde0 getelfhead+0x100 7011ef20 70b09578 e1bd1e9a1dd 70aacde0 ufs_getpage_miss+0x354 7011d720 70b09578 e1bd1170dc4 70aacde0 pageio_setup+0x268 70117d80 70b09578 e1bcff6ff27 70bc2480 elfexec+0x9f0 70117960 70b09578 e1bcfea4a9f 70bc2480 getelfhead+0x100 ... This example illustrates that a particular buffer can be used in numerous transactions. Note: Remember that the kmem transaction log is an incomplete record of the transactions made by the kernel memory allocator. Older entries in the log are evicted as needed to keep the size of the log constant. The ::allocdby and ::freedby dcmds provide a convenient way to summarize transactions associated with a particular thread. Here is an example of listing the recent allocations performed by thread 0x70aacde0. > 0x70aacde0::allocdby BUFCTL TIMESTAMP CALLER 70d4d8c0 e1edb14511a allocb+0x88 70d4e8a0 e1edb142472 dblk_constructor+0xc 70d4a240 e1edb13dd4f allocb+0x88 70d4e840 e1edb13aeec dblk_constructor+0xc 70d4d860 e1ed8344071 allocb+0x88 70d4e7e0 e1ed8342536 dblk_constructor+0xc 70d4a1e0 e1ed82b3a3c allocb+0x88 70a53f80 e1ed82b0b91 dblk_constructor+0xc 70d4d800 e1e9b663b92 allocb+0x88 By examining bufctl_audit records, you can understand the recent activities of a particular thread. |
EAN: 2147483647
Pages: 244
- ERP Systems Impact on Organizations
- The Second Wave ERP Market: An Australian Viewpoint
- The Effects of an Enterprise Resource Planning System (ERP) Implementation on Job Characteristics – A Study using the Hackman and Oldham Job Characteristics Model
- Context Management of ERP Processes in Virtual Communities
- Development of Interactive Web Sites to Enhance Police/Community Relations