Basic Summarization Techniques
 |
| |||||||||
Each time you add a group, you have the opportunity to do some quick and easy summarization on the data being grouped. In Chapter 1 we listed the basic summarization techniques for character data, including Count. The design result of using Count on the Country field can be seen in Figure 2.18.
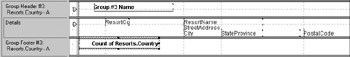
Figure 2.18. Group and summarize
Summary information is automatically added to a footer section area. However, there is nothing preventing you from dragging and dropping the summary field Count of Resorts.Country into the Group Header area. Many reports look better with the summary information presented before the detail data.
It would make sense in this report to add a summary based on the region information we added earlier. You can use Insert > Summary or the Insert Summary toolbar icon to add summary information based on field data if it was not specified in the Report Creation Wizard or if no wizard was used to build the report. Figure 2.19 shows the Insert Summary dialog. In this case, for each group of regions a percentage will be displayed showing what part of all the regions it comprises.
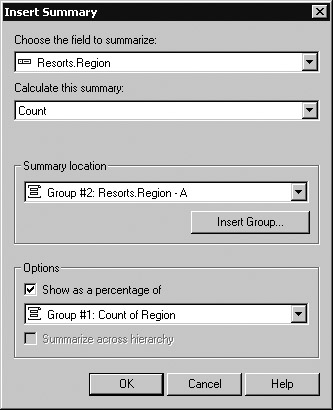
Figure 2.19. Percentage summary
Visual Checkpoint: Groups, Sorts, and Summaries
The data has been finessed in a way that not only answers the business question but also presents it in an organized way that is pleasing to the eye. Figure 2.20 shows the North America group, the region code group beneath that, the country group within the region group, and the records within the country group sorted according to the ascending order of the resort code and summarized on group values.
Business Question: We need the resort region, resort code, and mailing information for all the resorts sorted by resort name with totals grouped by region and showing which ones are in North America.
Notice that the group tree on the left displays the specified group for North America and all of the region groups within North America. From examining the data, you can tell that Region 14 has properties in both North America and other territories. You can click each of the group tree items to jump to that group of information.
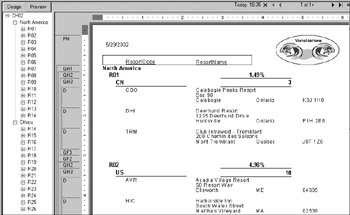
Figure 2.20. Groups, sorts, and summaries
Finally, you can see that the sections of the report are represented in their entirety, showing the section hierarchy, even in Preview mode. The following abbreviations should help you figure out exactly what is in each section:
| PH | Page Header |
| GH1 | Group Header 1 |
| GH2 | Group Header 2 |
| GH3 | Group Header 3 |
| D | Details |
| GF3 | Group Footer 3 |
| GF2 | Group Footer 2 |
| GF1 | Group Footer 1 |
| Use of content on this site is expressly subject to the restrictions set forth in the Membership Agreement | |
| Conello © 2000-2003 Feedback | |
EAN: 2147483647
Pages: 217