3.4 Developing Service Metrics
3.4 Developing Service Metrics
After gathering requirements for the network, the next step is to analyze these requirements so that you can distinguish between various performance levels in the network. We will develop and use performance thresholds and limits to distinguish between low and high performance and will also use performance characteristics to identify predictable and guaranteed performance levels. Performance thresholds, limits, and characteristics are measured in the system with service metrics.
Service metrics either are actual measurable quantities in the network or are derived from measured quantities. These service metrics are important; they are where "the rubber meets the road"—where requirements from all layers in the system are distilled into configurable and measurable quantities.
Recall from Chapter 2 that for a performance characteristic to be useful, it must be configurable, measurable, and verifiable within the network. This is particularly true when parts of the network are outside the control of the network administrator, for example, when a service provider is contracted to supply a service such as ATM or frame relay in the network or when parts of the network (or the entire network) are outsourced. In such cases, service metrics can be used to ensure that you are getting the service you are requesting (and paying for) from the service provider or outsourcing agent.
The types of service metrics you will use will depend on your design and the types of equipment (network devices) you implement in the network, but at this point in the analysis process, you can influence or require what will be measured in the network and (to some extent) how it will be measured.
Service metrics for RMA include:
-
Reliability, in terms of mean time between failures (MTBFs) and mean time between mission critical failures (MTBCFs)
-
Maintainability, in terms of mean time to repair (MTTR)
-
Availability, in terms of MTBF, MTBCF, and MTTR
Additional metrics can include uptime and downtime (as a percentage of total time), error and loss rates at various levels, such as packet error rate, bit error rate (BER), cell loss ratio (CLR), cell misinsertion ratio (CMR), frame and packet loss rates.
Service metrics for capacity include:
-
Data rates, in terms of peak data rate, sustained data rate, and minimum data rate
-
Data sizes, including burst sizes and durations
Service metrics for delay include:
-
End-to-end or round-trip delay
-
Latency
-
Delay variation
As configurable and measurable quantities in the network, service metrics can be described in terms of variables in network devices. There will also be mechanisms to configure and measure these variables. As we will see in Chapter 7, current mechanisms to configure and measure service metrics are with network management platforms that use the Simple Network Management Protocol (SNMP) and the Common Management Information Protocol (CMIP), which access variables described in management information bases (MIBs). MIBs describe generic and enterprise-specific management variables.
Examples of variables used as service metrics include:
-
Bytes in/out (per interface)
-
IP packets in/out (per interface)
-
Dropped Internet Control Message Protocol (ICMP) messages per unit time (per interface)
-
Service-level agreement (SLA) metrics (per user)
-
Capacity limit
-
Burst tolerance
-
Delay
-
Downtime
3.4.1 Measurement Tools
In addition to the management protocols and MIBs, we can use commonly available tools to help us measure service metrics. One such tool is the utility ping (Packet InterNet Groper) (available in TCP/IP releases), which roughly measures round-trip delays between selected sources and destinations in the network. Another tool is pathchar (available from ee.lbl.gov), which combines round-trip delay and per-link capacity measurements with path traces, such as with another popular utility traceroute. Another popular tool to analyze TCP traffic is TCPdump. There are also proprietary tools, enterprise-specific tools, and technology-specific tools that may be used in addition to those described.
For example, one method to monitor availability in the network is to use ping to estimate delay and packet loss (Figure 3.6). Ping tells us the approximate round-trip delay, as well as when ICMP echo packets (ping packets) are lost in the network or at the destination. Although not an exact method, it is fairly simple to set up and use and it provides an early warning mechanism for RMA problems.
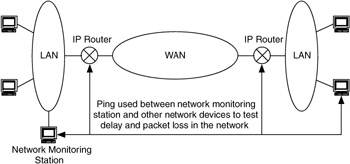
Figure 3.6: Using ping and IP packet loss as service metrics for RMA.
When developing service metrics, we want to also try to determine where in the system we want to measure each metric, as well as potential mechanisms for measurement, as in Figure 3.7.
| Service Metric | Where Metric Will Be Measured in System | Measurement Method | |
|---|---|---|---|
| 1 | LAN Delay | Between NM Device and Each Router in LAN | Ping |
| 2 | Wan Delay 1 | Between NM Device and Local Router Interface to WAN | Ping |
| 3 | WAN Delay 2 | Between NM Device and Remote Router Interface to WAN | Ping |
| 3 | LAN Packet Loss | At Each Local Router | SNMP |
Figure 3.7: Example service metrics.
3.4.2 Where to Apply Service Metrics
Where service metrics are applied is determined in part by what you plan to achieve from them (e.g., separating responsibilities). They are useful when trying to isolate and track problems in the network, especially when multiple groups are responsible for the network. For example, in Figure 3.6, the service metrics that are applied can also be used to separate responsibilities between an end-to-end provider, a WAN service provider, and other intermediate providers.
EAN: 2147483647
Pages: 161