Section 9.2. Receiving Traps
9.2. Receiving TrapsLet's start by discussing how to deal with incoming traps . Handling incoming traps is the responsibility of the NMS. Some NMSs do as little as display the incoming traps to standard output (stdout). However, an NMS server typically has the ability to react to SNMP traps it receives. For example, when an NMS receives a linkDown trap from a router, it might respond to the event by paging the contact person, displaying a pop-up message on a management console, or forwarding the event to another NMS. This procedure is streamlined in commercial packages but still can be achieved with freely available open source programs. 9.2.1. HP OpenViewOpenView uses three pieces of software to receive and interpret traps:
OpenView's main trap-handling daemon is called ovtrapd. This program listens for traps generated by devices on the network and hands them off to the Postmaster daemon (pmd). In turn, pmd triggers what OpenView calls an event. Events can be configured to perform actions ranging from sending a pop-up window to NNM users, forwarding the event to other NMSs, or doing nothing at all. The configuration process uses xnmtrap, the Event Configurations GUI. The xnmevents program displays the events that have arrived, sorting them into user-configurable categories. OpenView keeps a history of all the traps it has received; to retrieve that history, use the command $OV_BIN/ovdumpevents. In older versions of OpenView, traps are kept in an event logging file in $OV_LOG/trapd.log. By default, this file rolls over after it grows to 4 MB. It is then renamed trapd.log.old and a new trapd.log file is started. If you are having problems with traps, either because you don't know whether they are reaching the NMS or because your NMS is being bombarded by too many events, you can use tail -f to watch trapd.log so that you can see the traps as they arrive. (You can also use ovdumpevents to create a new file.) To learn more about the format of this file, refer to OpenView's manual pages for trapd.conf (4) and ovdumpevents (1M). Recent releases of OpenView instead put traps into the OpenView Event Database. Many admins prefer the old logfile format, however. If you are running a recent release of OpenView and want to see a trapd.log file of all your traps, run ovdumpevents to create this file. It might be helpful to define exactly what an OpenView event is. Think of it as a small record, similar to a database record. This record defines which trap OpenView should watch out for. It further defines what sort of action (send an email, page someone, etc.), if any, should be performed. 9.2.2. Using NNM's Event ConfigurationsOpenView uses an internal definition file to determine how to react to particular situations. This definition file is maintained by the xnmtrap program. We can start xnmtrap by selecting Options Figure 9-1. OpenView Event ConfiguratorOV_Node_Down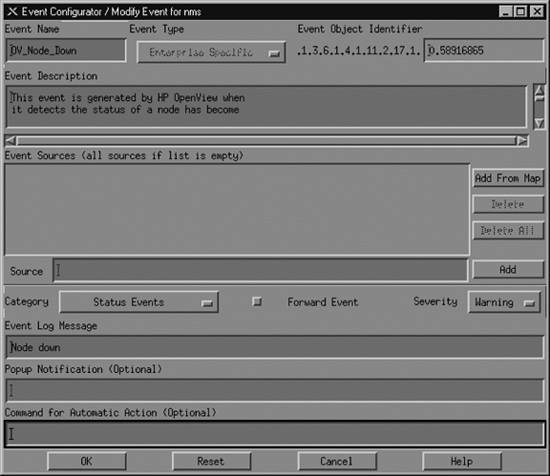 Figure 9-1 shows the OV_Node_Down event in the Event Configurator. When this event is triggered, it inserts an entry containing the message "Node down," with a severity level of Warning, into the Status Events category. OpenView likes to have a leading 0 (zero) in the Event Object Identifier, which indicates whether this is an event or trapthere is no way to change this value yourself. The number before the 0 is the enterprise OID; the number after the 0 is the specific trap numberin this case, 58916865.[*] Later we will use these numbers as parameters when generating our own traps.
9.2.2.1. Selecting event sourcesThe Source option is useful when you want to receive traps from certain nodes and ignore traps from other nodes. For example, if you have a development router that people are taking up and down all day, you probably would rather not receive all the events generated by the router's activity. In this case, you could use the Source field to list all the nodes from which you would like to receive traps and leave out the development router. To do this, you can either type each hostname by hand and click Add after each one, or select each node (using the Ctrl and mouse-click sequence) on your OpenView Network Node Map and click Add From Map. Unfortunately, the resulting list isn't easy to manage. Even if you take the time to add all the current routers to the Event Sources, you'll eventually add a new router (or some other hardware you want to manage). You then have to go back to all your events and add your new devices as sources . OpenView allows you to use pattern matching and source files, making it easier to tailor and maintain the source list. 9.2.2.2. Setting event categoriesWhen NNM receives an event, it sorts the event into an event category. The Categories drop-down box lets you assign the event you're configuring to a category. The list of available categories will probably include the following predefined categories (you can customize this list by adding categories specific to your network and deleting categories, as we'll see later in this section):
The last two categories really aren't event categories in the true sense of the word. If you select "Don't log or display," OpenView will not save the event in its database and will not display the Event Log Message in any Event Categories. OpenView will display the Popup Notification in a pop-up window and run the Command for Automatic Action. The "Log only" option tells OpenView not to display the event but to keep a log of the event in its database.[*]
9.2.2.3. Forwarding events and event severitiesThe Forward Event radio button, once checked, allows you to forward an event to other NMSs. This feature is useful if you have multiple NMSs or a distributed network management architecture. Say that you are based in Atlanta, but your network has a management station in New York in addition to the one on your desk. You don't want to receive all of New York's events, but you would like the node_down information forwarded to you. On New York's NMS, you could click Forward Event and insert the IP address of your NMS in Atlanta. When New York receives a node_down event, it will forward the event to Atlanta. The Severity drop-down list assigns a severity level to the event. OpenView supports six severity levels: Unknown, Normal, Warning, Minor, Major, and Critical. The severity levels are color-coded to make identification easier; Table 9-1 shows the color associated with each severity level. The levels are listed in order of increasing severity. For example, an event with a severity level of Warning has a higher precedence than an event with a severity level of Minor.
The colors are used both on OpenView's maps and in the Event Categories. Parent objects, which represent the starting point for a network, are displayed in the color of the highest severity level associated with any object underneath them.[*] For example, if an object represents a network with 250 nodes and one of those nodes is down (a Critical severity), the object will be colored red, regardless of how many nodes are up and functioning normally. The term for how OpenView displays colors in relation to objects is status source; it is explained in more detail in Chapter 5.
9.2.2.4. Log messages, notifications, and automatic actionsReturning to Figure 9-1, the Event Log Message and Popup Notification fields are similar but serve different purposes. The Event Log Message is displayed when you view the Event Categories and select a category from the drop-down list. The Popup Notification, which is optional, displays its message in a window that appears on any server running OpenView's NNM. Figure 9-2 shows a typical pop-up message. The event name, delme in this case, appears in the titlebar. The time and date at which the event occurred are followed by the event message, "Popup Message Here." To create a pop-up message like this, insert "Popup Message Here" in the Popup Notification section of the Event Configurator. Every time the event is called, a pop-up will appear. Figure 9-2. OpenView pop-up message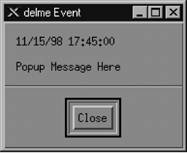 The last section of the Event Configurator is the Command for Automatic Action. The automatic action allows you to specify a Unix command or script to execute when OpenView receives an event. You can run multiple commands by separating them with a semicolon, much as you would in a Unix shell. When configuring an automatic action, remember that rsh can be very useful. We like to use rsh sunserver1 audioplay -v50 /opt/local/sounds/siren.au, which causes a siren audio file to play. The automatic action can range from touching a file to opening a trouble ticket. In each Event Log Message, Popup Notification, and Command for Automatic Action, special variables can help you identify the values from your traps or events. These variables provide the user with additional information about the event. Here are some of the variables you can use (the online help has a complete list):
9.2.3. Custom Event CategoriesOpenView uses the default categories for all its default events. Look through the $OV_CONF/C/trapd.conf file to see how the default events are assigned to categories. You can add categories by going to Event Configuration It's worth your while to spend time thinking about what categories are appropriate for your environment. If you plow everything into the default categories, you will be bothered by the Critical "Printer Needs Paper" event when you really want to be notified of the Critical "Production Server on Fire" event. Either event will turn Status Events red. The categories in Figure 9-3 are a good start, but think about the types of events and activities that will be useful for your network. The Scheduled and Unscheduled (S/U) Downtime category is a great example of a category that is more for human intervention than for reporting network errors. Printer Events is a nice destination for your "Printer Needs Paper" and "Printer Jammed" messages. Even though none of the default categories is required (except for Error), we recommend that you don't delete them, precisely because they are used for all of the default events. Deleting the default categories without first reconfiguring all the Figure 9-3. Adding event categories in OpenView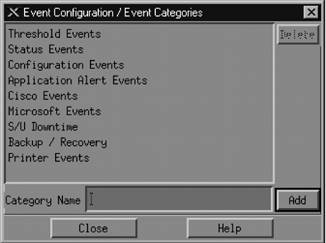 default events will cause problems. Any event that does not have an event category available will be put into the default Error category. To edit the categories, copy the trapd.conf file into /tmp and modify /tmp/trapd.conf with your favorite editor. The file has some large warnings telling you never to edit it by hand, but sometimes a few simple edits are the best way to reassign events. An entry in the portion of the file that defines event behavior looks like this: EVENT RMON_Rise_Alarm .1.3.6.1.2.1.16.0.1 "Threshold Events" Warning FORMAT RMON Rising Alarm: $2 exceeded threshold $5; value = $4. (Sample type = \ $3; alarm index = $1) SDESC This event is sent when an RMON device exceeds a preconfigured threshold. EDESC It's fairly obvious what these lines do: they map a particular RMON event into the Threshold Events category with a severity of Warning; they also specify what should happen when the event occurs. To map this event into another category, change Threshold Events to the appropriate category. Once you've edited the file, use the following command to merge in your updates: $ $OV_BIN/xnmevents -l load /tmp/trapd.conf 9.2.4. The Event Categories DisplayThe Event Categories window (Figure 9-4) is displayed on the user's screen when NNM is started. It provides a very brief summary of what's happening on your network; if it is set up appropriately, you can tell at a glance whether there are any problems you should be worrying about. If the window gets closed during an OpenView session, you can restart it using the Fault Figure 9-4. OpenView Event Categories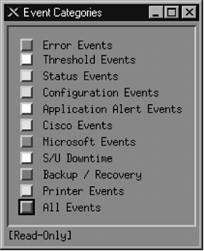 Two categories are special: the Error category is the default category used when an event is associated with a category that cannot be found; the All category is a placeholder for all events and cannot be configured by the Event Configurator. The window shows you the highest severity level of any event in each event category. The box to the left of Status Events is cyan (a light blue), showing that the highest unacknowledged severity in the Status Events category is Warning. Clicking on that box displays an alarm browser that lists all the events received in the category. A nice feature of the Event Categories display is the ability to restore a browser's state or reload events from the trapd.log and trapd.log.old files. Reloading events is useful if you find that you need to restore messages you deleted in the past.
At the bottom of Figure 9-4, the phrase "[Read-Only]" means that you don't have write access to Event Categories. If this phrase isn't present, you have write access. OpenView keeps track of events in a single database, though older versions stored events on a per-user basis, using a special database located in $OV_LOG/xnmevents.<username>. With write access, you have the ability to update this file whenever you exit. By default, you have write access to your own event category database, unless someone has already started the database by starting a session with your username. There may be only one write-access Event Categories per user, with the first one getting write access and all others getting read-only privileges. 9.2.5. The Alarms BrowserFigure 9-5 shows the alarms browser for the Status Events category. In it we see a single Warning event, which is causing the Status Events category to show cyan. Figure 9-5. OpenView alarms browser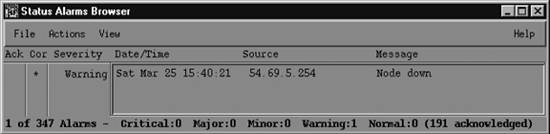 The color of the Status Events box is determined by the highest precedence event in the category. Therefore, the color won't change until either you acknowledge the highest precedence event or an event arrives with an even higher precedence. Clicking in the far-left column (Ack)[*] acknowledges the message and sets the severity to 0.
The Actions menu in the alarms browser allows you to acknowledge, deacknowledge, or delete some or all events. You can even change the severity of an event. Keep in mind that this does not change the severity of the event on other Event Categories sessions that are running. For example, if one user changes the severity of an event from Critical to Normal, the event will remain Critical for other users. The View menu lets you define filters, which allow you to include or discard messages that match the filter. When configuring events, keep in mind that you may receive more traps than you want. When this happens, you have two choices. First, you can go to the agent and turn off trap generation, if the agent supports this. Second, you can configure your trap view to ignore these traps. We saw how to do this earlier: you can set the event to "Log only" or try excluding the device from the Event Sources list. If bandwidth is a concern, you should investigate why the agent is sending out so many traps before trying to mask the problem. 9.2.6. Creating Events Within OpenViewOpenView gives you the option of creating additional (private) events. Private events are just like regular events, except that they belong to your private enterprise subtree rather than to a public MIB. To create your own events, launch the Event Configuration window from the Options menu of NNM. You will see a list of all currently loaded events (Figure 9-6). Figure 9-6. OpenView's Event Configuration window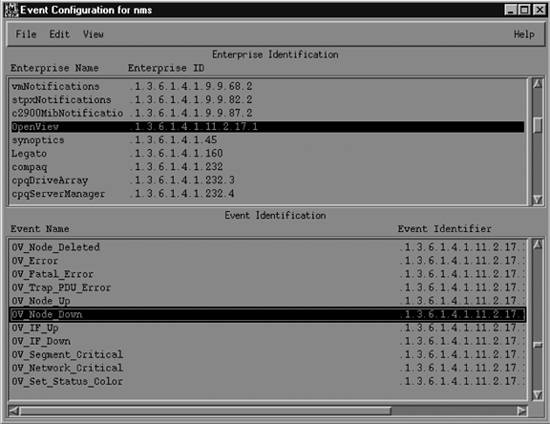 The window is divided into two panes. The top pane displays the Enterprise Identification, which is the leftmost part of an OID. Clicking on an enterprise ID displays all the events belonging to that enterprise in the lower pane. To add your own enterprise ID, select Edit
|
 Event Configurations (in the NNM GUI) or by giving the command $OV_BIN/xnmtrap. In the Enterprise Identification window, scroll down and click on the enterprise name OpenView .1.3.6.1.4.1.11.2.17.1. This displays a list in the Event Identification window. Scroll down in this list until you reach OV_Node_Down. Double-click on this event to bring up the Event Configurator (Figure 9-1).
 Add
Add 
EAN: 2147483647
Pages: 165