Section G-2. Nagios
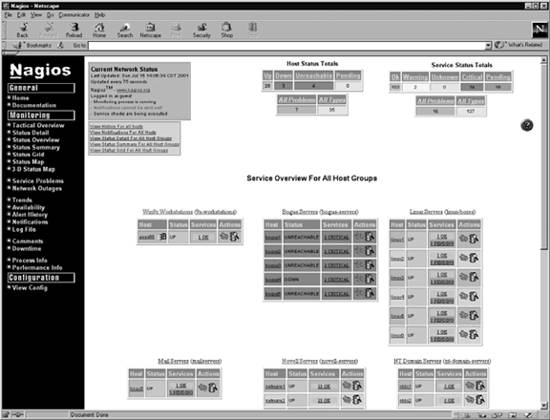
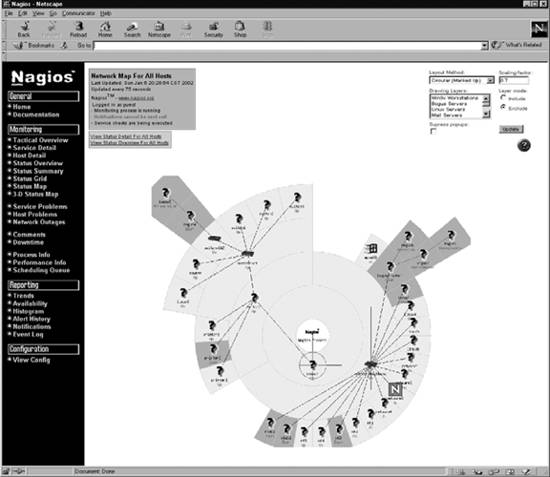
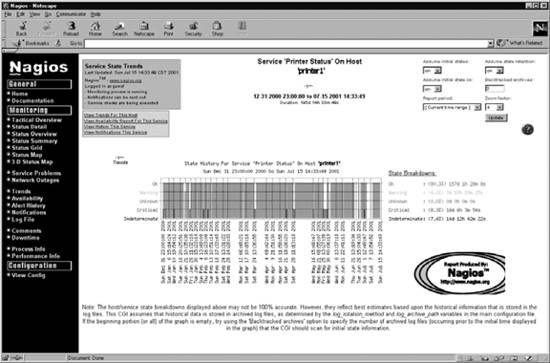
G-2. NagiosNagios is a comprehensive monitoring software package that, if installed and configured properly, can work nicely for many small to large companies. It has all the typical features like status overview, map view, and an alerts screen (just to name a few), but it goes a step further to give you sections on trends, a tactical overview, and process and performance data. Beyond that, Nagios offers some rather advanced features such as 3D maps of your network (using Virtual Reality Markup Language or VRML) and a WAP interface for cell phones. Nagios is pretty easy to download and compile. The online docs are useful and easy to read. Experienced users recommended that I download and install the Nagios plug-ins as well. These plug-ins are little pieces of software (which must also be compiled) that do most of the actual monitoring checks (check_pop, check_ssh, etc.). In my setup, I used the check_ssh program to ensure that the SSH port (22) was open and available. Before installing Nagios, you must have the Apache web server installed and configured. While many packages give you the ability to monitor and show typical alerts, Nagios has the ability to monitor servers and services and group them efficiently to generate a variety of related notifications. After installation, configuring the product took some time. I had to trudge through numerous configuration files (with the help of the documentation) to get everything up and running. Even with the example files, it took a few hours to get a single host and service (check_ssh) working. Despite this, I enjoyed the fact that I could define and customize a wide variety of parameters. Although during installation I was somewhat frustrated to discover that I must modify yet another definition file, I applaud Nagios for its extensibility. Overall, Nagios does not provide an easy setup and requires some planning and thought. Once that is done, however, Nagios can provide a wealth of information. Here's a quick sample of what a configuration file might contain. Please keep in mind that this is not a complete configuration but simply a snippet from the one that I used during my setup, excerpted here to give you a feel for Nagios's configuration: define timeperiod{ timeperiod_name 24x7 alias 24x7 sunday 00:00-24:00 monday 00:00-24:00 tuesday 00:00-24:00 wednesday 00:00-24:00 thursday 00:00-24:00 friday 00:00-24:00 saturday 00:00-24:00 } define command{ command_name go_logger command_line /usr/bin/logger "Nagios MSG: $HOSTADDRESS$" } define command{ command_name check_ssh command_line /usr/local/nagios/libexec/check_ssh -H $HOSTADDRESS$ } define service{ host_name myhost service_description check_ssh_for_myhost check_command check_ssh max_check_attempts 5 normal_check_interval 5 retry_check_interval 3 check_period 24x7 notification_interval 30 notification_options w,c,r } define contact{ contact_name root alias Douglas Mauro service_notification_period 24x7 host_notification_period 24x7 service_notification_options w,u,c,r host_notification_options d,u,r service_notification_commands go_logger host_notification_commands go_logger email root@localhost } define contactgroup{ contactgroup_name my1stgroup alias my_1st_group members root } define hostgroup{ hostgroup_name allhosts alias all my hosts members myhost } define host{ host_name myhost alias my_local_host address 192.168.40.130 max_check_attempts 5 contact_groups my1stgroup notification_interval 30 notification_period 24x7 notification_options d,u,r All of the Nagios screenshots shown here come from the online docs available at http://www.nagios.org/about/screenshots.php. Figure G-1 shows the status overview. It gives a quick look at host and service status totals along with a service overview for all the different host groups (which you can define). Figure G-1. Nagios - status overview Figure G-2 shows a high-level color-coded status map. Hovering the mouse over a node pops up detailed information about that particular node. Clicking on a host forwards you to the host's Service Status Details page. The top-right section of the page gives you additional layout options. Figure G-2. Nagios status map Figure G-3 shows the Trends page, which you can see by clicking on the Trends link (on the left) and filling out a report form page. This area allows you to create different reports based on hosts, services, and groups over a given interval (today, the last three months, and so on). The upper-left section of the window links to related reports. This allows you to quickly jump to an availability report for the same object (node, service, etc.) right from this page. For big shops with strapped budgets and little shops with some extra time on their hands, Nagios is a tool worth looking into. All of the features that Nagios offers (for free) are the same as (if not more than) those in the commercial packages available today. One feature that would be nice is a live graphing area. Nagios can be forced to immediately poll an object (node, service, and so on), but a live, scrolling graph of something is critical when troubleshooting. Table G-3 summarizes information about Nagios. Figure G-3. Nagios trends
|
EAN: 2147483647
Pages: 165