Section 8.2. What is the Enterprise Services Inventory?
8.2. What is the Enterprise Services Inventory?As we mentioned at the beginning of this chapter, the Enterprise Services Repository can be thought of in one sense as a container for descriptions of enterprise services. The Enterprise Services Repository is a directory, just like a phone book. And like a phone book, it is not filled with what it describes, but rather with information about what it describes. A person's phone number is not a person. Nor is the information in the Enterprise Services Repository describing the interface for a service the same as describing the service itself. The concern of this portion of the chapter is the services themselves, described in a way that a business analyst can understand. That's what makes up the Enterprise Services Inventory. The Enterprise Services Inventory is a comprehensive set of business-level enterprise services created by SAP, though as we will see, the Enterprise Services Inventory is open and customers and partners may request services be built by SAP or submit services for inclusion in the Enterprise Services Inventory. (The process of adding to the Enterprise Services Inventory happens through the Enterprise Services Community, described in Chapter 6.) The Enterprise Services Inventory is a key differentiator for SAP. It's one thing to say to customers, "Create an SOA," or even to provide the tools for doing so. In the case of SAP, the Enterprise Services Inventory represents a collection of enterprise services that come ready made. These services have been created by SAP and are secure and scaleable. The first version of the Enterprise Services Inventory, including 500 services, was made public as a preview in June 2005. Registered users can access it via the SAP Developer Network (SDN; http://sdn.sap.com). We describe the ESA Preview System in detail later in this chapter. Not only can the services in the Enterprise Services Inventory be used by customers and partners as is, but they can also be adapted. Sometimes the service that meets your needs might be similar to a service in the inventory. In these cases, the Enterprise Services Inventory provides a starting point for adapting a service that meets your needs perfectly and saves you time versus developing that service from scratch. The actual list of what services have been implemented will change quarterly or even faster as new services are created and added to the inventory. This book is not a good place to list available services. SDN is a good place to do that. Instead, in this section we will explain in greater detail the sorts of services that will end up in the Enterprise Services Inventory, and some processes that are used for creating them. Is this a bit on the technical side? You bet, but if you cannot get a little technical now and then, why bother to write a book about ESA at all? 8.2.1. What does the Enterprise Services Inventory provide for each service?Each service in the Enterprise Services Inventory includes not only the high-level description of the service but also information about that service so that organizations using open standards can consider whether to incorporate a particular service into their SOA. Each service in the inventory has an implementation-independent service definition. It includes information about providers or implementations of that service, with specific details. The inventory includes details relevant to consumers of services, such as scenarios and processes in which the service might be used. In fact, it provides a cross-reference listing of all the processes in which a given service is used. 8.2.2. What kinds of services are part of the Enterprise Services Inventory?A wide range of services will become part of the Enterprise Services Inventory. A service can be considered a candidate for the Enterprise Services Inventory if it supports one of four key business drivers:
Services fit into a variety of scenarios. Some services are utility services that are required for almost every application, such as pressing the F4 key to get context-sensitive help information. Other services follow a UI process, such as employees changing their address. Still other services implement application-to-application communications, enabling a business process behind the scenes. But how do services become part of the Enterprise Services Inventory? Figure 8-7 provides a view of the service definition and alignment process used to bring services into the Enterprise Services Inventory. Figure 8-7. The Enterprise Services Inventory service definition and alignment process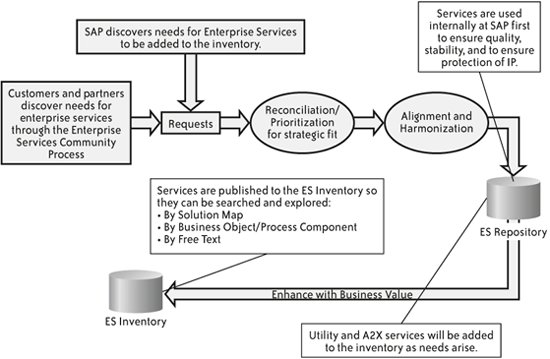 As Figure 8-7 shows, once the ideas for services arrive, they are prioritized and considered for their strategic fit and their harmonization with existing services. Their alignment with the business drivers listed earlier is examined. SAP also considers whether the service in question is relevant for the outside world and is appropriate for externalization. At this stage, a series of steps is taken to ensure quality, scalability, and protection of intellectual property (IP). If it is determined to be a strategic enterprise service, it is published as part of the Enterprise Services Inventory. The request for creating a particular service might come from SAP internally, or it might come from a customer or partner through the Enterprise Services Community. Regardless of from where the request came, the impulse for creating a service at all is generally motivated by one of three reasons:
The next two questions in this chapter describe a progressive methodology to identify meaningful enterprise services as a part of service enablement. The information that forms the basis of the answers to these questions comes from the internal SAP engineering documents that were used as the foundation of the more accessible Enterprise Services Design Guide, available on SDN. If you are new to the world of services and want to create a service or a system of services, you might be better off going to SDN and reading the design guide. But if you are the equivalent of an SAP sports fanatic, read on. The section later in this chapter titled "What is the Enterprise Services Preview?" will be of interest to everyone. 8.2.3. What methodology has SAP created for service enablement?A program of service enablement is not about building services. Service enablement is actually a design process in which scenarios, processes, and applications are analyzed and the opportunities for creating services are discovered and evaluated. In the first part of a program of service enablement, many ideas for services are invented and evaluated. In the second part, the services are actually built. All sorts of things happen in service enablement, and the SAP process we will describe is supported by existing analysis such as business scenario maps. The process of service enablement we will describe has two parts:
This process is described in Figure 8-8, which is one of the most elegant and eclectic process graphs you will ever see. A quick look at Figure 8-8 indicates that it is not like other process graphs. An exclusive or operator is used to indicate that the process may begin in one of three ways. Below, the and operator indicates that the process flow splits and moves in parallel. These primitives for flow control come from the sort of logic used in designing circuit boards, but they are used here to describe a procedural model. While some might find this approach obscure, for the right reader this graphic is an elegant and efficient mode of communication. The starting point for our service identification example is the SAP solution maps. We then select a business scenario by following this process:
Table 8-1 describes the key tasks in the procedural model. The idea is that scenarios for services are invented and then are evaluated with respect to indicators. Table 8-1 outlines the key tasks; Table 8-2 describes the performance indicators mentioned in the "Process step" column in Table 8-1. Figure 8-8. Procedural model for service discovery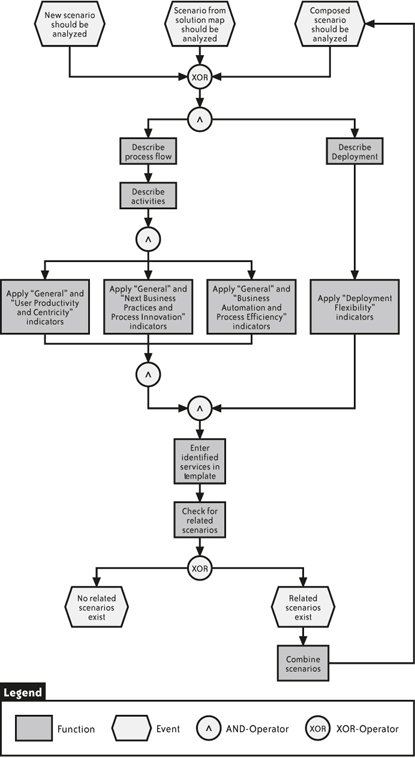
The indicators are the key to this process. The indicators help service designers determine if they have discovered a scenario for a service or if they are barking up the wrong tree. If certain indicators apply, it is a clue that a certain type of opportunity for a service may have been found. Table 8-2 lists the indicators.
Using the procedural model and the indicators, therefore, a large group of people can analyze many different scenarios and processes, and it's likely that the descriptions of opportunities for creating services will be understandable to each other. This process for service discovery creates a common language for a large team to use to communicate about a program of service enablement. If the communication for a large group can be harmonized, great things can happen. 8.2.4. How do the indicators and the procedural model work in practice?A concrete example will help you see how the indicators and procedural model work in practice. Consider a business scenario that describes the purchase of a new component in the context of a development project. First, here is a short overview of the scenario, including the process flow and the deployment. 8.2.4.1. Scenario for purchasing a new componentIn the development and launch of new products, companies risk huge sums developing ideas into prototypes and, finally, into products and brands for consumers. This cross-functional activity touches many departments, including product management, supply management, manufacturing, invoicing, and finance. Best practices for new-product development involve creating a set of increasingly demanding gates that each idea must pass through to move to the next stage. Figure 8-9 illustrates this scenario. Figure 8-9. Purchasing a new component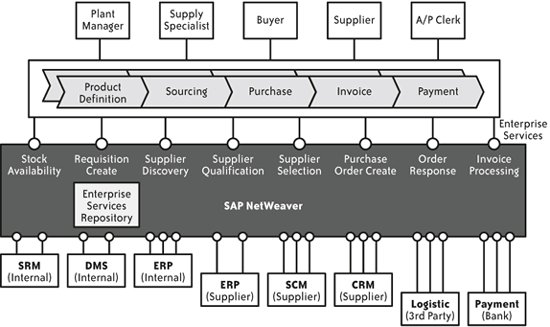 8.2.4.2. Process flowFigure 8-10 shows the high-level process flow of our example. Table 8-3 describes each step of this process in detail. We kept the example simple. That means that the process flow does not show every possible case of the scenario. Figure 8-10. High-level process flow, with roles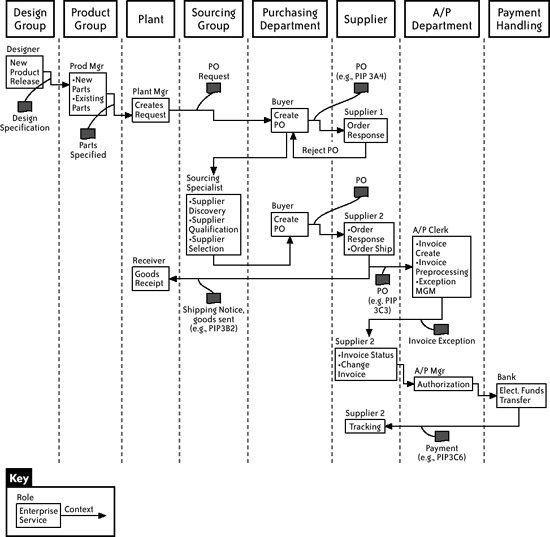
8.2.4.3. DeploymentFigure 8-11 shows the current system landscape and application deployment of our model company. Figure 8-11. System landscape of an example company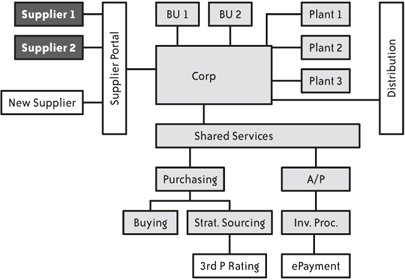 8.2.4.4. Service identification by applying the indicatorsUsing the process flow with the process steps and the deployment diagram, we can now take the indicators from Table 8-2 and apply them to our scenario. 8.2.4.5. Applying general indicatorsThe most relevant general indicator is Indicator 1, which says what we should look for: "Complete processes or process steps with frequent high execution time or frequent high execution costs are potential candidates for being supported by services." In our example, the process step "Evaluate Supplier" has a high execution time because the sourcing specialist has to perform many activities manually (e.g., search for suppliers, call suppliers). We suggest building a role-specific UI to support him with the supplier discovery and qualification. The UI would call a service that provides all the necessary information about suppliers needed to select a defined part. 8.2.4.6. Applying user productivity and centricity indicatorsTo apply these indicators, concentrate on the process steps that are not performed automatically and therefore need human interaction. Analyze the activities of those process steps and apply the following indicators. Here's how we would apply these indicators in this case. Indicator 3 says what we should look for: "Information logically linked and often needed by users is distributed throughout disparate systems." Since each plant has its own system, it is sometimes necessary to log on to every plant to search for parts. We suggest building a service that searches automatically across the relevant plants. Indicator 4 also applies. It states: "Business know-how is decentralized, but the decentralized users need support from central users to get their business done. There is a high call or request rate to expert users that results in repeated information retrieval from application systems or the application of well-defined business rulesi.e., tasks that could be automated." In the example, to go from the process step "Invoice Received" to the process step "Authorize Payment," the A/P Clerk needs to know whether the ordered goods have been received yet. We suggest building a UI element, based on a service, so that the A/P Clerk can see whether the goods have been received. An example of automatically applying business rules could be to check an incoming electronic invoice. If a corresponding PO is found and matches the invoice, the invoice can be posted automatically without manual intervention. As we will see later, this is only the first approach to optimizing the interaction between the Receiver and the A/P Clerk. By considering other indicators, we will optimize this interaction even more. 8.2.4.7. Applying best practices and process innovation indicatorsIndicator 5 states: "Information is manually transferred from paper into applications or between applications." In this example, the sourcing specialist is using a web site of a third-party service provider to get information about potential suppliers and their products, such as performance ratings. He uses copy-and-paste to get that information into the vendor master record of his Enterprise Services Repository system. We suggest a service in which the Enterprise Services Repository system calls the service provider upon request, automatically retrieving the most current data. 8.2.4.8. Applying business automation and process efficiency indicatorsTo apply these indicators, we concentrate on process steps where human beings are involved but don't need to be, or where human beings just trigger the next process step. Indicator 6 states: "All needed input parameters for performing a specific activity are already available in a system, not necessarily in the system implementing this activity." In our example, during the "Evaluate Supplier" process step, the Source Specialist needs to attach further information for an RFQ. The Source Specialist needs to know where the information is and attach it manually. We suggest a service that aligns the information needed for the RFQ automatically so that the Source Specialist doesn't need to know exactly where he can find the information. Indicator 7 states what we should look for: "Important data from external (technical) sources or functionality not supported by an existing enterprise service and is either needed within the process in general or enables the automation of the respective task." Consider our discussion of Indicator 4. There we suggested a service for the Receiver that allows him to enter the goods received. But considering this indicator, we can optimize this step even more by using bar coding or radio frequency identification (RFID) technology. Using this technology obviates the need for the Receiver to enter the goods received because this entry will be done automatically. We suggest that we define a service in such a way that goods receipt is automatic via bar coding or RFID technology. Considering the next indicator will optimize our interaction between Receiver and A/P Clerk even more. Indicator 8 states: "In some cases, an application might reach a 'steady state' even though a process is not completedi.e., the application has finished processing data but has not triggered the events that logically follow in the business process. In such cases, manual intervention usually is necessary to get the process going again." Indicator 4 led us to services that make it needless for the A/P Clerk to call the Receiver every day to ask for the goods received. Indicator 7 led us to services that obviate the need for the Receiver to enter the goods received. Still, the A/P Clerk has to use his service to check whether the goods are received. Now this indicator leads us to a service that informs the A/P Clerk as soon as the goods are received and shows him the invoice he needs to authorize. We suggest you do not build a service that allows the A/P Clerk to look for goods received, but that you redefine the service from Indicator 7 in such a way that it notifies the A/P Clerk as soon as the goods are received and shows him automatically which invoice to authorize. We have seen how we can optimize a process by considering more indicators. In doing this, we might start out with fairly simple, atomic services and move to more sophisticated, composite services. We can identify services after considering a single indicator, but we may have to redefine them after we have considered more indicators. Indicator 9 states that we should look for "A process crossing a (potential) borderline to other applications, other systems, or external organizations." When an invoice is received, information from multiple backend systems may be necessary to automatically process the rules mentioned earlier to determine whether the invoice can be accepted. This information may reside in several systems, and the update of, for example, the PO that the invoice belongs to may happen in a different system. Retrieving information and updating the status of the PO are suitable services. Indicator 10 states that industry standards (such as CIDX and RosettaNet) can be an indicator for services that optimize the communication between applications and industry standards. For purchasing, the industry standard CIDX should be used. We suggest building a service that takes the data needed for purchasing and transforms it in the format used by CIDX. Indicator 11 shows us that a given business process needs external synchronization to a B2B scenario without including details of a specific standard. During the process step to create the PO, the Buyer has to wait for a confirmation from the supplier in order to know whether the supplier has accepted the order. After the Buyer gets the confirmation, he informs others that the order is in progress. We suggest a service that accepts an electronic order confirmation in a suitable B2B format and creates the appropriate notifications. If the supplier rejects the order, the Buyer will also be notified. Indicator 12 asks us to look for different variants of a given business process where major parts are stable and only single activities may vary. During the process step "Create PO," the Manager of the Purchasing Department has to approve a PO if it exceeds a certain amount. Therefore, we suggest building a UI element that informs the Manager about such POs and provides him with the appropriate actions (accept/reject/get more details). This leads to services for getting the relevant PO information and changing the status. 8.2.4.9. Applying flexible deployment indicatorsTo apply the following indicators we now consider the deployment diagram shown in Figure 8-11. When Indicator 13 looks for a solution, it often receives data from various other solutions. Figure 8-11 shows that the company has three instances of the operational system for its plants and one corporate finance system so that many transactions in the operational systems need to be mirrored in the corporate finance system. We suggest a service in the financial application that can receive relevant accounting information from the operational systems. Indicator 14 looks for a solution that often is deployed multiple times within one company, with data exchange between the solutions. If the company actually is running local financials in addition to corporate financials, we could create a service in the corporate system that periodically receives aggregated financial information from the local systems. Indicator 15 asks us to "Check the relevance of the business process for outsourcing. The outsourcing borders, interfaces, and messages exchanged between BPO Provider, enterprise, and third parties are indicating the need for services." As we can see in our deployment diagram, the company has outsourced its payment process. We suggest building a service that provides the outsourcer with the data he needs to fulfill the payment after the A/P Clerk authorized a payment. That means that the A/P Clerk only needs to authorize the payment; the rest, such as collecting the data and transferring it to the right format for the outsourcer, is done automatically by the service. While this example moves quickly, it does provide a real-world instance of how a program of service enablement might work. Having described how we do service discovery, we now turn our attention back to the Enterprise Services Inventory. 8.2.5. For each service, what does the Enterprise Services Inventory provide?Each service in the Enterprise Services Inventory includes information about that service so that organizations using open standards can consider whether to incorporate a particular service into their SOA. Each service in the inventory has an implementation-independent service definition. It includes information about providers or implementations of that service, with specific details. The inventory includes details relevant to consumers of services, such as scenarios and processes in which the service might be used. In fact, it provides a cross-reference listing of all the processes in which a given service is used. 8.2.6. What is the Enterprise Services Preview?An important facet of the Enterprise Services Inventory is the ability to search for and discover enterprise services in a variety of ways. Services can be located by drilling down through a solution map, by searching for a particular business object or component, or by freeform text searches. You can also review a categorized index of the services in the Enterprise Services Inventory and discover services in this way. To get a feel for outside-in development, sign on to the ESA Preview System on SDN (http://sdn.sap.com). Essentially, this system provides access to a PC-based tool, called Solution Composer, which you can use to create and modify solution maps for your own business processes. We've often written in this book and in this chapter about a methodology of looking at enterprise services that starts with business processes and drills down to services. The Solution Composer makes this process very concrete, literally providing the drill-down from industry to solution map to business scenario group, all the way down to service and the WSDL for that service, as shown in Figure 8-12. You can view solution maps for a generic business context or for specific industries. Using these maps, you can drill down to see individual business processes and view enterprise services that comprise parts of these processes. Typically, you start with a business solution map and drill down into an end-to-end scenario, such as sales and marketing. You can see particular processes relevant for that business scenario, such as Sales Order Management. By drilling down further, you can see the related enterprise services described on a business level. Registered users can click on a service operation and view the technical service implementation in WSDL. Figure 8-12. The ESA Preview System: a presentation of enterprise services along processes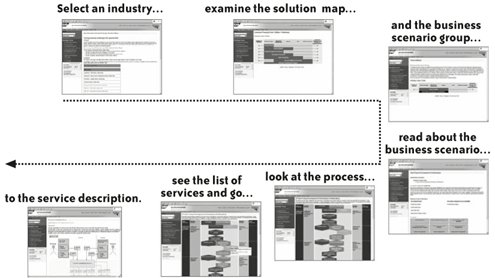 With that overview in mind, let's take a look at the Enterprise Services Inventory in the ESA Preview System, which is available at http://sdn.sap.com. You must register to access it. The ESA Preview System appears as an option on the left side of the screen, as shown in Figure 8-13. (Note that you must log in to see the option and that you may have to expand the ESA node to display it.) Figure 8-13. The ESA Preview System, reachable through the SDN homepage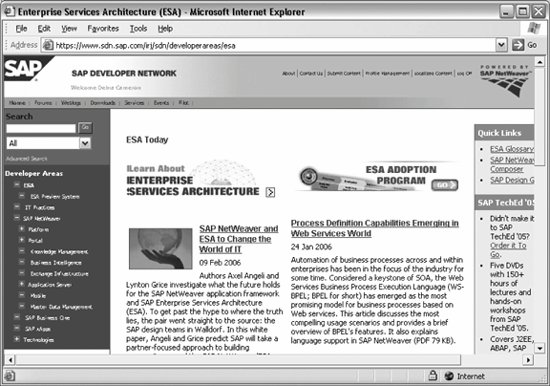 Clicking on ESA Preview System displays an introductory screen that offers not only access to the preview, but also a variety of supporting documents for your review. Under Quick Links on the right side of the screen, click on Browse service definitions to display the ESA Preview System shown in Figure 8-14. Figure 8-14. The ESA Preview System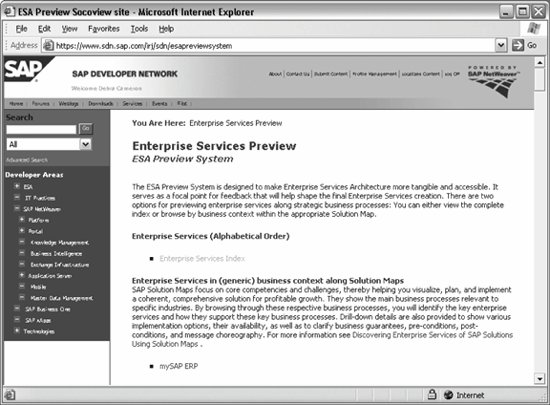 From here you can take one of two paths: you can either click on Enterprise Services Index to view a categorized list of all the services, or you can drill down through solution maps. Selecting mySAP ERP displays the solution map shown in Figure 8-15. This solution map covers a comprehensive range of business scenario groups divided by category. Business scenario groups listed here include those for analytics, financials, and human capital management to name a few. Select Human Capital Management to display Figure 8-16. This is where all human-resources-related functions can be found. The body of this screen describes the area of Human Capital Management and the challenges facing today's HR professionals. On the upper part of the screen, the options Search and See Also appear. Under See Also, click on Enterprise Services in Human Capital Management to display the screen shown in Figure 8-17. The enterprise services are grouped by business scenario. The enterprise services for Human Capital Management fall into three business scenarios: Recruiting Talent, Workforce Process Management, and Workforce Deployment. Subcategories for Workforce Process Management include Benefits Management, Time and Figure 8-15. Solution maps for mySAP ERP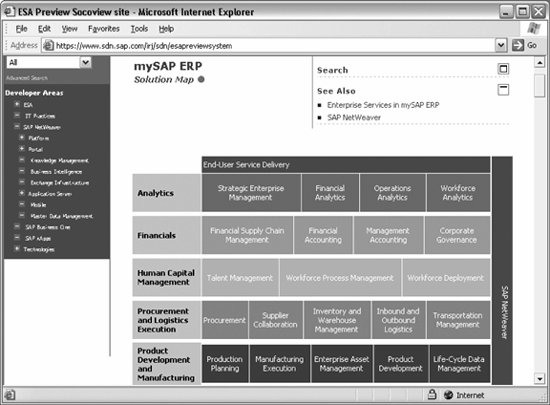 Figure 8-16. Drilling down into the Human Capital Management business scenario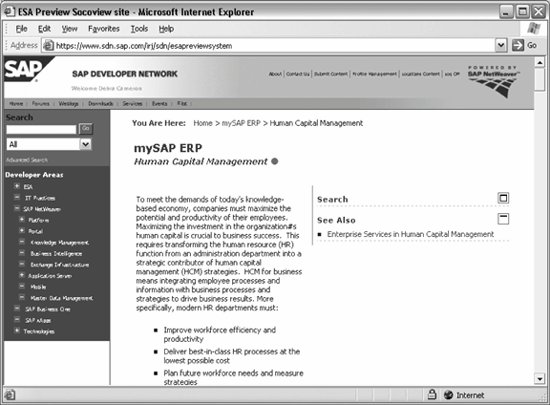 Figure 8-17. Categories of enterprise services for Human Capital Management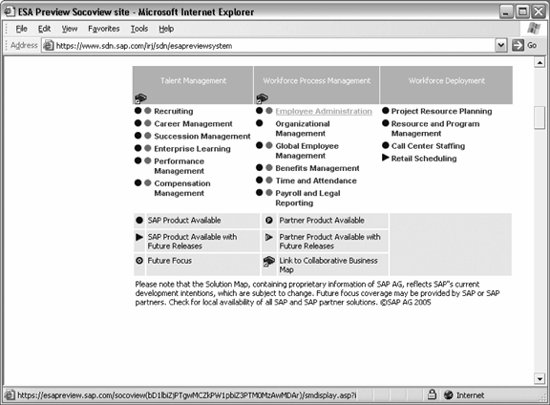 Attendance, and one that is important to everyone, Payroll and Legal Reporting. We will drill down into the Employee Administration area, so click on Employee Administration to display Figure 8-18. The Employee Administration business process includes a Personnel Management enterprise service. Clicking on this service reveals the related service operations, as shown in Figure 8-19. Under See Also, you can click on "Where used" to see where else this service is used. Numerous enterprise services operations are listed. We'll choose the second one in the list, Employee List of Manage Query Response, shown at the bottom of Figure 8-19. This service operation provides a list of the employees who report to a given manager as of a certain date. Clicking on this operation displays the screen shown in Figure 8-20. Now we have drilled down to the level of a service operation. The final drill-down step is to click on one of the WSDL files, either the Inbound Interface WSDL or the ERP Inbound WSDL. At this point, you will be asked to authenticate because this crosses the boundary from the Enterprise Services Inventory into the Enterprise Services Repository, from which the WSDL will be retrieved. After successfully authenticating, the WSDL file for the enterprise service is shown, as in Figure 8-21. On the left side, you can see where this service fits into the mySAP ERP hierarchy, which mirrors our drill-down process. Figure 8-18. The Employee Administration business process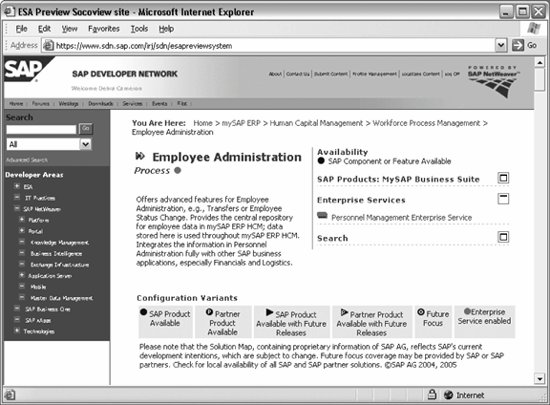 Figure 8-19. The Personnel Management enterprise service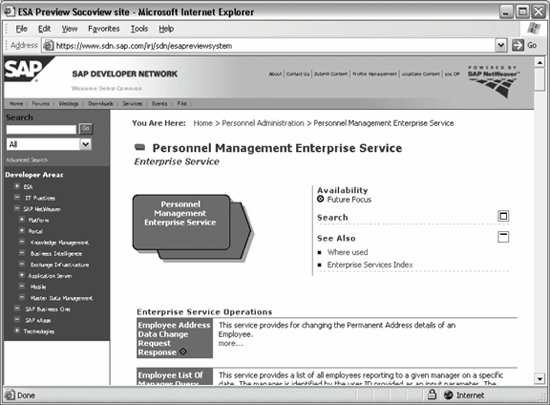 Figure 8-20. Employee List of Manage Query Response enterprise services operation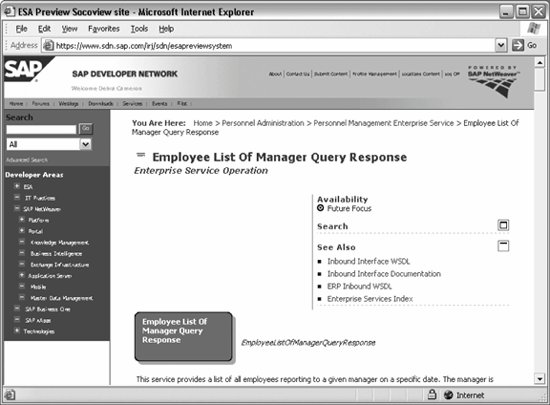 Figure 8-21. WSDL excerpt from the Enterprise Services Repository, viewed through the Solution Composer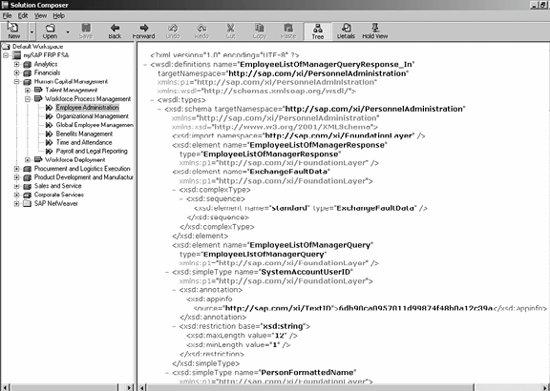 As you can see, we start with looking at the business and move, from the outside in, all the way down to the technical details of the WSDL file. Not everyone will need to see this level of detail, but by starting with a business view, the many people in the organization with business expertise can look at business processes and see how they map to enterprise services, drilling down as far as they desire, from the Enterprise Services Inventory right down into the Enterprise Services Repository. The Enterprise Services Repository, and the project to fill that repository with useful services, the Enterprise Services Inventory, are at the heart of ESA. This chapter described the strategic importance of the Enterprise Services Repository and how it is connected with the Enterprise Services Inventory. An understanding of the Enterprise Services Repository will inform your work with enterprise services whether that work involves consuming existing services, composing services, or creating services, and will help you formulate your ESA adoption strategy. |
EAN: 2147483647
Pages: 265