16.5 The Mandelbrot Set
16.5 The Mandelbrot Set Program 16 C2 iterated complex functions of the form f ( z ) = z 2 + c by varying the value of z over the complex plane for any given value of the constant c. The results were graphs of the Julia sets containing those z values whose orbits were bounded. We can turn this around and vary the value of the constant c over the complex plane and, for each value of c, compute its critical orbit the orbit that starts with z = 0 + 0 i. (Compare this with the bifurcation diagram.) The graph we would generate is the Mandelbrot set containing the c values with bounded critical orbits. [3]
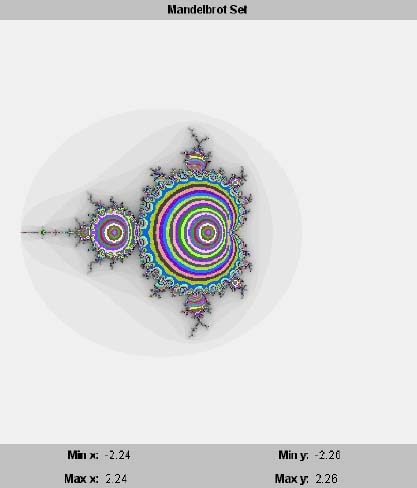
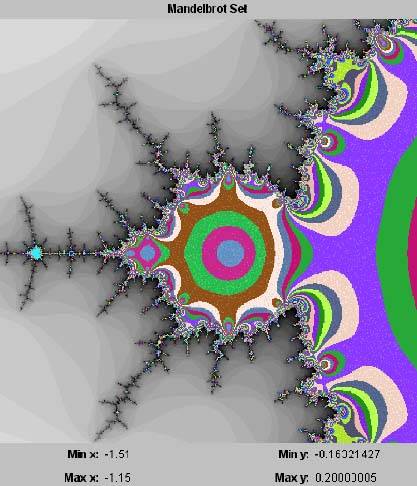
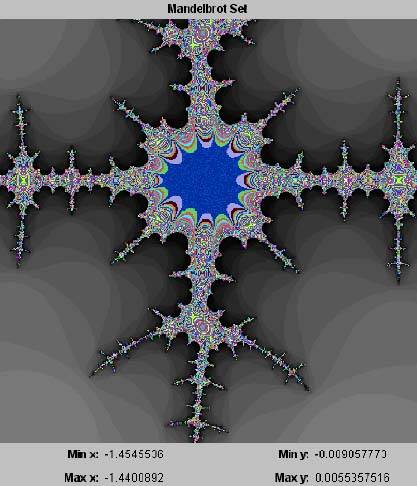
Listing 16-4 shows class PlotThread of Program 16-4, which plots the Mandelbrot set. Listing 16-4 Class PlotThread of Program 16 C4, which plots the Mandelbrot set of the complex function f(z) = z 2 + c . private static final int MAX_ITERS = 32; private static final int ESCAPE_MODULUS = 2; /** * Graph thread class that iterates z^2 + c as c varies over * each point in the complex plane bounded by the rectangle * xMin, xMax, yMin, yMax. */ private class PlotThread extends Thread { public void run() { // Loop over each graph panel pixel. for (int row = 0; row < h; ++row) { float y0 = yMax - row*delta; // row => y0 for (int col = 0; col < w; ++col) { float x0 = xMin + col*delta; // col => x0 Complex c = new Complex(x0, y0); // z = x0 + y0i Complex z = new Complex(0, 0); if (stopFlag) return; boolean escaped = false; int iters = 0; float x = x0; float y = y0; float modulus; // Iterate z^2 + c, keeping track of the // iteration count. do { z = z.multiply(z).add(c); modulus = z.modulus(); escaped = modulus > ESCAPE_MODULUS; } while ((++iters < MAX_ITERS) && (!escaped)); // Escaped: Set the shade of gray based on the // number of iterations needed to escape. The // more iterations, the darker the shade. if (escaped) { int k = 255 - (255*iters)/MAX_ITERS; k = Math.min(k, 240); plotPoint(col, row, new Color(k, k, k)); } // No escape: Set the colors based on the modulus. else { int m = ((int) (100*modulus)) /ESCAPE_MODULUS + 1; int r = (101*m)&255; int g = (149*m)&255; int b = (199*m)&255; plotPoint(col, row, new Color(r, g, b)); } } // Draw a row of the graph. drawPlot(); yield(); } } } As before, we consider a point to be bounded if its modulus does not exceed ESCAPE_MODULUS within MAX_ITERS number of iterations. Like Program 16 C2, this program plots in shades of gray the points with escaping critical orbits. It plots in color the points with bounded critical orbits. Screen 16-4a shows the initial plot of the Mandelbrot set. Screen 16-4a. The initial plot of the Mandelbrot set by Program 16 C4. Like all the other fractal images, the image of the Mandelbrot set is recursive. By using the mouse to zoom into various regions along the "coastline" of the set, we can find images such as those in Screen 16-4b. Screen 16-4b. Two zoomed-in regions of the Mandelbrot set. One way to look at the Mandelbrot set is that it is a catalogue of Julia sets. Because each point within the Mandelbrot set represents a c value for the function f ( z ) = z 2 + c, we could feed each such c value into Program 16 C2 to generate and plot the corresponding Julia set. |

| |
| Top |
EAN: 2147483647
Pages: 141