Data Analysis
|
| < Day Day Up > |
|
The data were analyzed with LISREL 8. First, the discriminant validity between Habit and Intended Use was verified. Discriminant validity is shown in LISREL by examining the significance of the difference in Χ2 between a model where the measurement items load as hypothesized against the Χ2 of a model where they are grouped together to reflect one latent variable (Gerbing & Anderson, 1988; Segars, 1997). Since the two factor model with the habit items loading onto one latent construct and with the intended use items loading on another had a X28 = 12.11, while the alternative model in which all six measurement items loaded on one latent construct had a X29 = 76.90, the difference in X21 = 64.79 is significant, meaning that discriminant validity is established (Gerbing & Anderson, 1988).
Having shown that a tautology between habit and intended use was not the case, the research model was run with the 18 items shown in Table 1. The model fit was mostly within the accepted thresholds (Gefen et al., 2000). The fit statistics were: X2129 at 314.65, RMR at .045, GFI at .83, NFI at .91 and CFI at .94. The data supported the hypotheses. PU, PEOU, and Habit increased Intended Use (standardized β=.29, .36, standardized γ=.24, respectively). The data also showed that PEOU and Habit increased PU (standardized β=.46 and standardized λ=.43, respectively), and that Habit also increased PEOU (standardized λ=.56). Composite construct reliabilities, the equivalent of Cronbach's α in LISREL (Hair, Anderson, Tatham & Black, 1998), were .84 for Intended Use, .80 for PU, .88 for PEOU, and .84 for Habit. [2] The SMC, the extent of explained variance (Hair et al., 1998), of Intended Use was 61%, of PU 63%, and of PEOU 32%. The LISREL analysis, however, indicated that there was a significant shared residual variance among the PEOU and PU items.
Based on the recommended methodology (Gerbing & Anderson, 1988), items with significant shared residual variance were eliminated one at a time until good fit indexes were achieved. [3] In this manner, two PU and two PEOU items were dropped. The resulting model shows good fit indexes: X271 at 112.84, RMR at .029, GFI at .92, NFI at .95 and CFI at .98. The data still supported all the hypotheses. PU, PEOU, and Habit increased Intended Use (standardized β=.30, .36, and standardized λ=.23, respectively), PEOU and Habit increased PU (standardized β=.43 and standardized λ=.46, respectively), and that Habit increased PEOU (standardized λ=.57). The explained variance of Intended Use was 61%, of PU 62%, and of PEOU 32%. Composite construct reliabilities were .84 for Intended Use, .86 for PU, .87 for PEOU, and .84 for Habit. This model with the standardized solution is shown in Figure 1 and in Table 1.
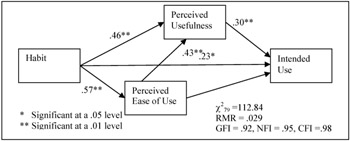
Figure 1: Research Model and Standardized LISREL Solution
Next, the model was run with only Habit and Intended Use to examine how much of the variance of Intended Use is explained by Habit alone. This model also shows good fit indexes: X28 at 12.18, RMR at .023, GFI at .98, NFI at .98 and CFI at .99. Habit significantly increased Intention Use (standardized λ=.63), explaining 40% of its variance.
The much higher than average degrees of explained variance of Intended Use may be because the questionnaire asked the respondents to assess their intentions to perform a specific act at a specific website from which they had bought many times before, rather than the way the question was stated in previous TAM studies dealing with a relatively unknown IT and without specifying exactly for what type of usage the users would utilize it. It is also possible that the specific circumstances of online activity, where consumers prefer to return to the same vendor over and over again (Reichheld & Schefter, 2000; The Economist, 2000), might explain these high degrees of explained variance.
[2]Construct Reliability is calculated as: (Σ std loadings)2 / ((Σ std loadings)2 + Σ (std errors))
[3]It should be noted that almost all TAM studies applying LISREL used only partial scales of PU and PEOU. Segars & Grover (1993) used a five item scale of PU and a three item scale of PEOU; Subramanian (1994) used a three item scale of PU and a four item scale of PEOU; Gefen & Keil (1998)) used a five item PU scale and a three item PEOU scale; and Gefen (2000) used a four items scale of PU and a two item scale of PEOU.
|
| < Day Day Up > |
|
EAN: 2147483647
Pages: 191