Handling Errors in Reports
As you create more complex reports and use more intricate expressions in those reports, you increase the chance of introducing errors. The Report Designer lets you know you have an error when you try to preview a report. You receive a message in the Preview tab saying, “There are compilation errors. See Task List for details.”
Fortunately, the Report Designer also provides tools for dealing with errors. A list of detailed error messages is displayed in both the Build section of the Output window and in the Task List window. In most cases, these error messages provide a pretty good description of the problem. In many cases, the problem is a syntax error in an expression you constructed in a property of a report item.
If you double-click an error entry in the Task List window, you return to the Layout tab (if you are not already there) and the report item that contains the offending expression is selected. You can then use the error message to determine which property contains the error and you can fix the problem. In some cases, if you open the Properties dialog box for the report item, the property containing the error has an exclamation mark surrounded by a red circle placed next to it.
Once you make changes to remedy each error listed in the Task List window, you can click the Preview tab to run the report. If all the errors have been corrected, the Build section of the Output window shows 0 errors and all the entries are cleared out of the Task List window. If you still have errors, continue the debugging process by double-clicking on a Task List window entry and try again to correct the error.
The Employee Time Report
Features Highlighted
-
Using a report template
-
Putting totals in headers and footers
-
Using the scope parameter in an aggregate function
-
Toggling visibility
Business Need The Galactic Delivery Services personnel department needs a report showing the amount of time entered by its employees on their weekly timesheets. The report should group the time by job, employee, and week, with totals presented for each grouping. The groups should be collapsed initially, and the user should be able to drill down into the desired group. Group totals should be visible even when the group is collapsed.
Task Overview
-
Create the Chapter07 Project, a Shared Data Source, a New Report, and a Dataset
-
Populate the Report Layout
-
Add Drilldown Capability
-
Add Totaling
Employee Time Report, Task 1: Create the Chapter07 Project, a Shared Data Source, a New Report, and a Dataset
-
Create a new Reporting Services project called Chapter07 in the MSSQLRS folder. (If you need help with this task, see the section “The Transport List Report” in Chapter 5.)
-
Create a shared data source called Galactic for the Galactic database. (Again, if you need help with this task, see the section “The Transport List Report” in Chapter 5.)
-
Right-click Reports in the Solution Explorer. Select Add | New Item from the Context menu. The Add New Item dialog box appears.
-
Single-click GDSReport in the Templates area to select it. Change the Name to EmployeeTime and click Add.
-
Select <New Dateset…> from the Dataset drop-down list. The Dataset dialog box appears.
-
Enter EmployeeTime for the name in the Dataset dialog box.
-
Galactic (shared) is selected for the data source by default. Click OK. You return to the Data tab, which now displays the Generic Query Designer.
-
Type the following in the SQL pane:
SELECT Description AS Job, Employee.EmployeeNumber, FirstName, LastName, CONVERT(char(4),DATEPART(yy, WorkDate))+'−'+ CONVERT(char(2),DATEPART(wk, WorkDate)) AS Week, WorkDate, HoursWorked FROM TimeEntry INNER JOIN Assignment ON TimeEntry.AssignmentID = Assignment.AssignmentID INNER JOIN Employee ON Assignment.EmployeeNumber = Employee.EmployeeNumber INNER JOIN Job ON Assignment.JobID = Job.JobID ORDER BY Job, Employee.EmployeeNumber, Week, WorkDateINNER JOIN Job ON Assignment.JobID = Job.JobID ORDER BY Job, Employee.EmployeeNumber, Week, WorkDate
-
Run the query to make sure no errors exist.
-
Select the Layout tab.
Task Notes If you need to, refer to the database diagram for the personnel department in Chapter 3 to see how the TimeEntry, Assignment, Employee, and Job tables are related. Our query joins these four tables to determine what work hours were entered for each employee and what job they held.
We are using a combination of the CONVERT() and DATEPART() functions to create a string containing the year and the week number for each time entry. This enables us to group the time into workweeks. Note, the year comes first in this string, so it sorts correctly across years.
When you selected the Layout tab, content was already in the page header and page footer of the report. This, of course, is because we used our new GDSReport template to create the report. By using our report template, we have a consistent header and footer on our reports without having to work at it.
Employee Time Report, Task 2: Populate the Report Layout
-
Place a text box onto the body of the report. Modify the following properties of this text box:
Property
Value
Font: FontSize
25pt
Font: FontWeight
Bold
Location: Left
0in
Location: Top
0in
Size: Width
2.875in
Size: Height
0.5in
Value
Employee Time
-
Place a table onto the body of the report immediately below the text box you just added.
-
In the Datasets window, expand the EmployeeTime dataset. Drag the WorkDate field into the detail row in the center column of the table.
-
Drag the Hours Worked field into the detail row in the right-hand column of the table.
-
Select the entire header row in the table. Modify the following property:
Property
Value
TextDecoration
Underline
-
Right-click in the gray square to the upper-left of the table. Select Properties from the Context menu. The Table Properties dialog box appears. Select the Groups tab.
-
Click Add. The Grouping and Sorting Properties dialog box appears.
-
Type JobGroup for the name. (No spaces are allowed in group names.)
-
In the Expression area, select =Fields!Job.Value from the drop-down list.
-
Click OK to exit the Grouping and Sorting Properties dialog box.
-
Click Add again. The Grouping and Sorting Properties dialog box appears.
-
Type EmpNumGroup for the name.
-
In the Expression area, select =Fields!EmployeeNumber.Value from the drop-down list.
-
Click OK to exit the Grouping and Sorting Properties dialog box.
-
Click Add a third time. The Grouping and Sorting Properties dialog box appears.
-
Type WeekGroup for the name.
-
In the Expression area, select =Fields!Week.Value from the drop-down list.
-
Click OK to exit the Grouping and Sorting Properties dialog box.
-
Click OK to exit the Table Properties dialog box.
-
Click in any cell in the table. Notice how three group header rows and three group footer rows have been added to the table. The gray boxes to the left of the table identify the group rows as 1, 2, and 3. Drag the Job field into the leftmost cell in the Group 1 header row.
-
Right-click the gray rectangle above the leftmost column in the table. Select Insert Column to the Right from the Context menu.
-
Drag the EmployeeNumber field into the cell in the column you just created and in the Group 2 header row.
-
Drag the width of the leftmost column in the table until the column is just wide enough for the word “Job” in the table header cell.
-
Select the two leftmost cells in the row for the Group 1 header, right-click them, and select Merge Cells from the Context menu. (Click-and-drag or hold down SHIFT while clicking to select multiple cells at the same time.)
-
Right-click the gray rectangle above the second-from-the-left column in the table. Select Insert Column to the Right from the Context menu.
-
Drag the Week field into the cell in the column you just created in the Group 3 header row.
-
Drag the width of the second column from the left until it is just wide enough for the words “Employee Number” in the table header cell.
-
Drag the width of the third column from the left until it is just wide enough for the =Fields! Week. Value expression in the Group 3 header cell.
-
Select the three group header rows at the same time. Modify the following property in the Property window:
Property
Value
Font: FontWeight
Bold
-
Select the three cells in the center of the Group 2 header row, right-click them, and select Merge Cells from the Context menu.
-
Modify the following properties for the merged cell that results from Step 30:
Property
Value
TextAlign
Left
Value (Select <Expression…> from the drop-down list to make editing easier. You can select the field expressions from the Fields area and double-click to add them to the Expression area. Remember, the Globals, Parameters, and Fields expressions are case-sensitive!)
=Fields!EmployeeNumber.Value &″-″ & Fields!FirstName.Value & ″ ″ & Fields!LastName .Value
-
Your report layout should appear similar to Figure 7–5.
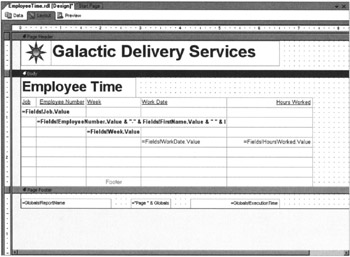
Figure 7–5: Employee Time Report layout after Task 2 -
Select the Preview tab. Your report should appear similar to Figure 7–6.
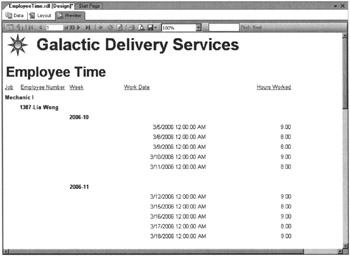
Figure 7–6: Employee Time Report preview after Task 2
Task Notes We placed a table on our report to contain the employee time information. We created three groups within the table to contain the groups required by the business needs for this report. The detail information is grouped into weeks (WeekGroup). The week groups are grouped into employees (EmpNumGroup). The employee groups are grouped into jobs (JobGroup). By merging cells in the grouping rows, we can give the report a stepped look, yet keep the width of our steps small, so it has enough room for the detail information.
Employee Time Report, Task 3: Add Drilldown Capability
-
Select the Layout tab.
-
Select the entire table and bring up the Table Properties dialog box as we did in Step 6 of Task 2. Select the Groups tab.
-
Select EmpNumGroup and click Edit. The Grouping and Sorting Properties dialog box appears.
-
Select the Visibility tab.
-
Select Hidden for the Initial Visibility setting.
-
Check the box labeled Visibility Can Be Toggled by Another Report Item.
-
Select Job from the Report Item drop-down list.
-
Click OK to exit the Grouping and Sorting Properties dialog box.
-
Select WeekGroup and click Edit. The Grouping and Sorting Properties dialog box appears.
-
Select the Visibility tab.
-
Select Hidden for the Initial Visibility setting.
-
Check the box labeled Visibility Can Be Toggled by Another Report Item.
-
Select EmployeeNumber from the Report Item drop-down list.
-
Click OK to exit the Grouping and Sorting Properties dialog box.
-
Click Details Grouping. The Details Grouping dialog box appears.
-
Select the Visibility tab.
-
Select Hidden for the Initial Visibility setting.
-
Check the box which is labeled Visibility Can Be Toggled by Another Report Item.
-
Select Week from the Report Item drop-down list. (This is at the bottom of the list.)
-
Click OK to exit the Details Grouping dialog box.
-
Click OK to exit the Table Properties dialog box.
-
Select the Preview tab. Your report should appear similar to Figure 7–7 after expanding the top few groups.
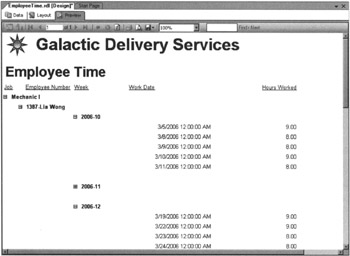
Figure 7–7: Employee Time Report preview
Task Notes We now have the drilldown capability working as required for this report. This was done by using the visibility and toggling properties of the groupings in the table. The visibility of each group is set to be toggled by a report item in the group above it. Therefore, EmpNumGroup is set to be toggled by the Job report item in JobGroup, and WeekGroup is set to be toggled by the EmployeeNumber report item in EmpNumGroup.
For the purposes of visibility, the detail row of the table is treated as a group and is called the details grouping. The details grouping is set to be toggled by the Week report item, which is part of WeekGroup.
EmpNumGroup, WeekGroup, and the details grouping all have their initial visibility set to Hidden. This means when you run the report in the Preview tab, you do not see any of these groups. Only the top group, JobGroup, is visible.
Remember, in data regions, the items are repeated according to the rows in the dataset. Therefore, the report contains a number of JobGroup rows, one for each distinct job contained in the dataset. Each JobGroup contains sets of EmpNumGroup rows, WeekGroup rows, and the details grouping rows.
The first JobGroup contains a Job report item (text box) with a value of Mechanic I. There is a small plus (+) sign in front of Mechanic I because it controls the visibility of the EmpNumGroup rows in the Mechanic I JobGroup. Clicking the plus sign changes the visibility of all the EmpNumGroup rows in the Mechanic I JobGroup from hidden to visible. The EmpNumGroup rows in the Mechanic I JobGroup now show up on the report.
When the EmpNumGroup rows are visible in the Mechanic I JobGroup, the plus sign next to Mechanic I changes to a minus (−) sign. Clicking the minus sign will again change the visibility of all the EmpNumGroup rows in the Mechanic I JobGroup, this time from visible to hidden. The EmpNumGroup rows in the Mechanic I JobGroup now disappear from the report.
Click the plus and minus signs to change the visibility of various groups and detail rows in the report. Make sure you have a good understanding of how visibility and toggling are working in the report. We make it a bit more complicated in Task 4.
Employee Time Report, Task 4: Add Totaling
-
Select the Layout tab.
-
Right-click the rightmost cell in the Group 1 header row and select Properties from the Context menu. The Textbox Properties dialog box appears.
-
Type the following for Value:
=Sum(Fields!HoursWorked.Value)
Note To save some typing, you can select =Fields!HoursWorked.Value from the Value drop-down list, and then add in the additional text.
-
Select the Visibility tab.
-
Check the box which is labeled Visibility Can Be Toggled by Another Report Item.
-
Select Job from the Report Item drop-down list. (We are leaving Initial Visibility set to Visible.)
-
Click OK to exit the Textbox Properties dialog box.
-
Right-click the rightmost cell in the Group 2 header row and select Properties from the Context menu. The Textbox Properties dialog box appears.
-
Type the following for Value:
=Sum(Fields!HoursWorked.Value)
-
Select the Visibility tab.
-
Check the box labeled Visibility Can Be Toggled by Another Report Item.
-
Select EmployeeNumber from the Report Item drop-down list. (We are leaving Initial Visibility set to Visible.)
-
Click OK to exit the Textbox Properties dialog box.
-
Right-click the rightmost cell in the Group 3 header row and select Properties from the Context menu. The Textbox Properties dialog box appears.
-
Type the following for Value:
=Sum(Fields!HoursWorked.Value)
-
Select the Visibility tab.
-
Check the box labeled Visibility Can Be Toggled by Another Report Item.
-
Select Week from the Report Item drop-down list. (We are leaving Initial Visibility set to Visible.)
-
Click OK to exit the Textbox Properties dialog box.
-
Click the gray square for the Group 1 footer row. Modify the following properties for this footer row using the Properties window (the drop-down list at the top of the Properties window calls this TableRow8):
Property
Value
Visibility: Hidden
True
Visibility: ToggleItem
Job
-
Click the gray square for the Group 2 footer row. Modify the following properties for this footer row using the Properties window:
Property
Value
Visibility: Hidden
True
Visibility: ToggleItem
EmployeeNumber
-
Click the gray square for the Group 3 footer row. Modify the following properties for this footer row using the Properties window:
Property
Value
Visibility: Hidden
True
Visibility: ToggleItem
Week
-
Select the rightmost cell in the Group 3 footer row. Modify the following properties for this text box using the Properties window:
Property
Value
BorderStyle: Top
Solid
Font: FontWeight
Bold
Value (Select <Expression...> from the drop-down list to make it easier to enter this value.)
=Sum(Fields!HoursWorked.Value)
Note You can accomplish Steps 24 and 25 by copying the text box whose properties you modified in Step 23, and then pasting it into the cells specified in Steps 24 and 25. Make sure you have the text box selected without the flashing text edit cursor inside of it, before you try to copy it.
-
Repeat Step 23 for the rightmost cell in the Group 2 footer row.
-
Repeat Step 23 for the rightmost cell in the Group 1 footer row.
-
Select the rightmost cell in the table footer row. Modify the following properties for this text box using the Properties window:
Property
Value
BorderStyle: Top
Double
BorderWidth: Top
3pt
Font: FontWeight
Bold
Value (Select <Expression...> from the drop-down list to make it easier to enter this value.)
=Sum(Fields!HoursWorked.Value)
-
Your report layout should appear similar to Figure 7–8.
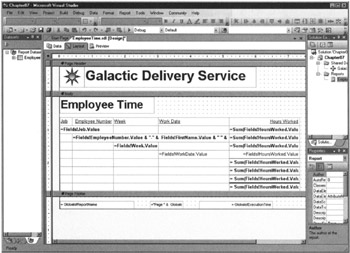
Figure 7–8: The Employee Time Report layout after Task 4 -
Select the Preview tab. Your report should appear similar to Figure 7–9 when the top few groups are expanded.
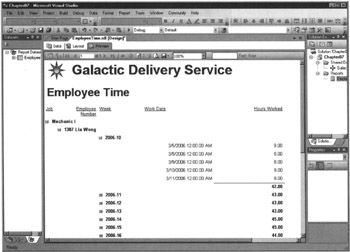
Figure 7–9: The Employee Time Report preview after Task 4 -
Click Save All in the toolbar.
Task Notes Now we not only have a report with group totals, we have a report that keeps its group totals where they ought to be. When the group is collapsed, the group total is on the same line with the group header. When the group is expanded, the group total moves from the group header to the group footer.
When you think about it, this is how you would expect things to work. When the group is collapsed, we expect it to collapse down to one line. Therefore, the group total should be on the line with the group header. When the group is expanded, a column of numbers is in the group. We would naturally expect the total for that column of numbers to be below it. Therefore, the group total should move to the group footer.
We achieved this functionality by using our toggle items to control the visibility of three other items at the same time. In the previous section, we discussed the fact that Mechanic I controls the visibility of the EmpNumGroup rows in the Mechanic I JobGroup. Now, Mechanic I also controls the visibility of the Hours Worked total in the group header and the Hours Worked total in the group footer. The Hours Worked total in the group header is initially set to Visible. The Hours Worked total in the group footer is initially set to Hidden.
When the plus sign next to Mechanic I is clicked, three things occur:
-
The EmpNumGroup rows are set to Visible.
-
The Hours Worked total in the group header is set to Hidden.
-
The Hours Worked total in the group footer is set to Visible.
When the minus sign next to Mechanic I is clicked, the reverse takes place. This same behavior occurs at each level. Again, you can click the plus and minus signs to change the visibility of various groups and detail rows in the report. Make sure you understand how the visibility and toggle items interrelate.
The other feature of note used in this task is the Sum() aggregate function. If you were paying attention, you noticed we used the following expression in a number of different locations:
= Sum(Fields!HoursWorked.Value)
If you were paying close attention, you also noticed this expression yields a number of different results. How does this happen? It happens through the magic of scope.
Scope is the data grouping in which the aggregate function is placed. For example, the Sum() function placed in the JobGroup header row (the Group 1 header row) uses the current JobGroup as its scope. It sums hours worked only for those records in the current JobGroup data grouping. The Sum() function placed in the EmpNumGroup header row (the Group 2 header row) uses the current EmpNumGroup as its scope. It sums the hours worked only for those records in the current EmpNumGroup data grouping. The Sum() function placed in the table footer row is not within any data grouping, so it sums the hours worked in the entire dataset.
As you have seen in this report, it does not make a difference whether the aggregate function is placed in the group header or the group footer. Either way, the aggregate function acts on all the values in the current data grouping. At first, this may seem a bit counterintuitive. It is easy to think of the report being processed sequentially from the top of the page to the bottom. In this scenario, the total for a group would only be available in the group footer after the contents of that group are processed. Fortunately, this is not the way Reporting Services works. The calculation of aggregates is separate from the rendering of the report. Therefore, aggregates can be placed anywhere in the report.
Finally, it is important not to confuse the aggregate functions within Reporting Services with the aggregate functions that exist within the environs of SQL Server. Many of the Reporting Services aggregate functions have the same names as SQL Server aggregate functions. Despite this, Reporting Services aggregate functions and SQL Server aggregate functions work in different locations.
SQL Server aggregate functions work within a SQL Server query. They are executed by SQL Server as the dataset is being created by the database server. SQL Server aggregate functions do not have a concept of scope. They simply act on all the data that satisfies the WHERE clause of the query. As just discussed, Reporting Services aggregate functions are executed after the dataset is created, as the report is executing and are dependent on scope.
Here is a list of the Reporting Services aggregate functions:
| Avg( ) | Calculates the average of the values in a scope. |
| Count( ) | Counts the number of values in a scope. |
| CountDistinct( ) | Counts the number of unique values in a scope. |
| CountRows( ) | Counts the number of rows in a scope. |
| First( ) | Returns the first value in the scope. |
| Last( ) | Returns the last value in the scope. |
| Max( ) | Returns the maximum value in the scope. |
| Min( ) | Returns the minimum value in the scope. |
| StDev( ) | Calculates the standard deviation of the values in the scope. |
| StDevP( ) | Calculates the population standard deviation of the values in the scope. |
| Sum( ) | Calculates the sum of the values in the scope. |
| Var( ) | Calculates the variance of the values in the scope. |
| VarP() | Calculates the population variance of the values in the scope. |
Each of the aggregate functions in the previous table returns a single result for the entire scope. The following two functions are known as running aggregates. The running aggregates return a result for each record in the scope. That result is based on a value in the current row and all of the previous rows in the scope.
The running aggregate functions are:
| RowNumber( ) | Returns the number of the current row, starting at 1 and counting upward. |
| RunningValued( ) | Returns the running sum of the values. |
EAN: 2147483647
Pages: 115