Data Regions
The table item is one of four special report items designed specifically for working with datasets. These special report items are called data regions. The other data regions are the matrix, the list, and the chart.
Data regions are able to work with multiple records from a dataset. The data region reads a record from the dataset, creates a portion of the report using the data found in that record, and then moves on to the next record. It does this until all the records from the dataset have been processed.
In the report you just completed, you saw how the table data region creates a detail row for each record in the dataset. The matrix data region creates both rows and columns based on the contents of the dataset. You will see this demonstrated in our next report. The list data region is not limited to rows and columns. It creates a whole section, perhaps a whole page, for each record in the dataset. We will create a report using a list data region later in this chapter. The chart data region creates elements on a graph for each record in a dataset. We will create a report using a chart data region in Chapter 6.
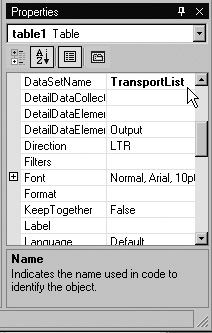
Each data region item has a property called DataSetName. This property contains the name of the dataset used by the data region. In the Transport List report you just created, the DataSetName property of the table has the value TransportList (see the following illustration). Visual Basic automatically set this property for you when you placed the first field, the SerialNumber field, in the table. Because the SerialNumber field is from the TransportList dataset and because the table’s DataSetName property was empty, Visual Basic put the value TransportList into the DataSetName property.
Now let’s move down the road a little further and create a matrix report without the wizard.
The Repair Count By Type Report
Features Highlighted
-
Creating a matrix report from scratch
-
Using a specialized property dialog box
Business Need GDS needs to purchase several new transports to update their delivery fleet. The company must decide which type of transport to purchase. One factor in the decision is the amount of time the new transports will spend in the maintenance hanger for repairs and preventative maintenance.
Upper management has asked the GDS maintenance department to provide a report showing the number of each type of repair that has been required by each type of transport. The report should include statistics from all transports, both active and retired. Also, the report should group the repairs by their cause.
Task Overview
-
Reopen the Chapter05 Project, Create a New Report in the Chapter05 Project, Select the Shared Data Source, and Create a Dataset
-
Place a Matrix Item on the Report and Populate It
-
Add Column Grouping and Other Report Formatting
Repair Count By Type Report, Task 1: Reopen the Chapter05 Project, Create a New Report in the Chapter05 Project, Select the Shared Data Source, and Create a Dataset
-
If you have closed the Chapter05 project, reopen it.
-
In the Solution Explorer on the right side of the screen, right-click the Reports folder.
-
Put your mouse pointer over Add in the context menu and wait for the submenu to appear. Select Add New Item from the context menu. This will display the Add New Item - Chapter05 dialog box.
-
Make sure that the Report icon is selected in the Template area. Enter RepairCountByType for the name.
-
Click Open. A new report called RepairCountByType.rdl will be created in the Chapter05 project. You will be taken to the Data tab of this new report.
-
Select “<New Dateset…>” from the Dataset drop-down list. The Dataset dialog box will appear.
-
Enter RepairsByType for the name in the Dataset dialog box.
-
“Galactic (shared)” will be selected for the data source by default. Click OK. You will return to the Data tab, which now displays the Generic Query Designer.
-
Click the Generic Query Designer button to switch to the Query Builder.
-
Right-click in the diagram pane of the Query Builder screen. Select Add Table from the context menu.
-
Add the following tables to the query:
Repair (dbo)
Transport (dbo)
TransportType (dbo)
RepairWorkDoneLink (dbo)
WorkDone (dbo)
RepairCause (dbo)
-
Click Close to exit the Add Table dialog box.
-
Check the following column in the Repair table:
RepairID
-
Check the following column in the TransportType table:
Description
-
In the grid pane, type TypeOfTransport in the Alias column in the Description row.
-
Check the following column in the WorkDone table:
Description
-
In the grid pane, type TypeOfWork in the Alias column in the Description row for the WorkDone (dbo) table.
-
Check the following column in the RepairCause table:
Description
-
In the grid pane, type RepairCause in the Alias column in the Description row for the RepairCause (dbo) table.
-
Type 1 in the Sort Order column for RepairCause. Type 2 in the Sort Order column for TypeOfWork.
-
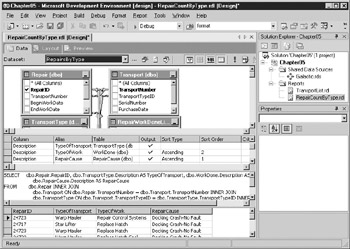
Right-click in the SQL pane and select Run from the context menu. The Query Builder should appear similar to this:
-
Right-click in the results pane and select Clear Results from the context menu.
Task Notes Although this report is a pretty straightforward request, we need to link together a number of tables to collect the necessary data. What we are interested in is repairs, so we start with the Repair table. However, none of the fields we need in the result set are actually in the Repair table. To find the type of transport being repaired, we need to join the Transport table with the Repair table and then join the TransportType table to the Transport table. To find the type of work done, we need to join the RepairWorkDoneLink table to the Repair table and then join the WorkDone table to the RepairWorkDoneLink table. Finally, to group by the cause of the repair, we need to join the RepairCause table to the Repair table. If you get confused by all of this, refer back to Figure 3-23 in Chapter 3.
Repair Count By Type Report, Task 2: Place a Matrix Item on the Report and Populate It
-
Click the Layout tab to begin working on the report layout.
-
Click the Matrix report item in the Toolbox. The mouse pointer will change to a matrix icon and crosshairs when you move your mouse pointer over the report layout area.
-
Click and drag the mouse over the lower three-quarters of the report layout.
-
When you release the mouse button, after dragging, a matrix will be created to occupy the area you just defined. By default, every cell in the matrix is occupied by an empty text box.
-
Drag the TypeOfTransport field from the Fields window and drop it on the cell containing the word “Columns.” The values in this column in the dataset will determine the columns in the matrix report.
-
Drag the TypeOfWork field from the Fields window and drop it on the cell containing the word “Rows.” The values in this column in the dataset will determine the rows in the matrix report.
-
Drag the RepairID field from the Fields window and drop it on the cell containing the word “Data.”
-
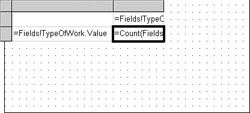
In the cell where you just dropped the RepairID field, change “Sum” to “Count” so that the contents of the cell appear as follows:
=Count(Fields!RepairID.Value)
-
With this cell still selected, change the following property:
Property
New Value
TextAlign
Center
-
Reduce the width and height of the columns in the matrix. When you are finished, your report design should look similar to this:
-
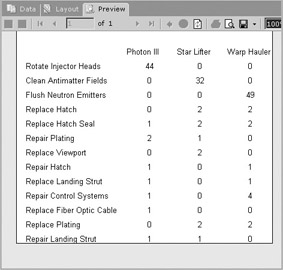
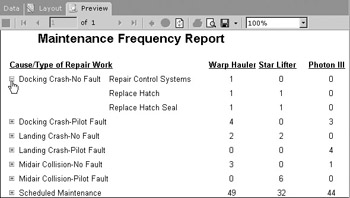
Click the Preview tab. Your report should look similar to the following illustration. The rows and columns in your report may appear in a different order from those shown here.
Task Notes Because the matrix report always groups a number of records from the dataset to create the entries in the matrix, the field which supplies the data for the matrix must be enclosed in some type of aggregate function. If the field placed in the data cell is a number, Visual Studio will enclose the field in the SUM() aggregate function.
The RepairID field, which we placed in the data cell in step 7, is a number. However, it does not make sense to add up the RepairIDs. Instead, we want to count the number of RepairIDs. For this reason, we changed the SUM() aggregate function to the COUNT() aggregate function.
Repair Count By Type Report, Task 3: Add Column Grouping and Other Report Formatting
-
Click the Layout tab to return to the report layout.
-
Click the cell in the upper-right corner of the matrix and change the following properties:
Property
New Value
FontWeight
Bold
TextDecoration
Underline
-
Click the square in the upper-left corner of the gray border to select the matrix item.
-
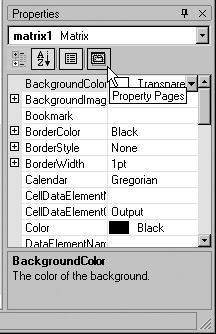
In the Properties window, click the Property Pages button shown in the following illustration. The Matrix Properties dialog box appears.
-
Click the Groups tab.
-
In the Rows area, click Add. The Grouping and Sorting Properties dialog box appears.
-
Next you will set up your matrix for drill-down. Replace “matrix1_RowGroup2” with “matrix1_RepairCause” for the name. Select Fields!RepairCause.Value from the drop-down list in the first row under Expression. Click OK.
-
In the Rows area, click Up to move matrix1_RepairCause to the top of the list. Click the matrix1_TypeOfWork entry. Click Edit in the Rows area. The Grouping and Sorting Properties dialog box appears.
-
Click the Visibility tab. Set the Initial Visibility to Hidden. Click the “Visibility can be toggled by another report item” check box. Select textbox2 from the Report Item drop-down list. (If textbox2 is not in the drop-down list, type textbox2 for the Report Item value.)
-
Click OK in the Grouping and Sorting Properties dialog box. Click OK in the Matrix Properties dialog box.
-
Click the cell in the upper-left corner of the matrix and change the following properties:
Property
New Value
FontWeight
Bold
TextDecoration
Underline
Value
Cause/Type of Repair Work
-
Click the Textbox report item in the Toolbox. Click and drag the mouse over the area above the matrix on the report layout area. When you release the mouse button, after dragging, a text box will be created to occupy the area you just defined. Click the text box and type the following:
Repair Count By Type Report
-
With the text box still selected, make the following changes in the Properties window:
Property
New Value
FontSize
16pt
FontWeight
Bold
TextAlign
Center
-
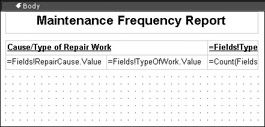
Your report layout should appear similar to the illustration.
-
Click the Preview tab. The report should appear.
-
Click Save All in the toolbar.
Task Notes The Property Pages button in the Properties window provides an alternative way to change the properties of a report item. This button displays a dialog box that deals specifically with the properties of the selected report item. These specialized property dialog boxes can make it much easier to modify the properties of a report item. You can also access the specialized property dialog boxes by right-clicking a report item and selecting Properties from the context menu.
EAN: 2147483647
Pages: 109
- ERP Systems Impact on Organizations
- The Second Wave ERP Market: An Australian Viewpoint
- Enterprise Application Integration: New Solutions for a Solved Problem or a Challenging Research Field?
- Distributed Data Warehouse for Geo-spatial Services
- Relevance and Micro-Relevance for the Professional as Determinants of IT-Diffusion and IT-Use in Healthcare