New Territory
Now that you have created the table and matrix reports without the aid of the Report Wizard, it is time to venture into new territory. As mentioned previously, the list item is the third type of data region. Just as the table item makes up the main portion of a table report and the matrix item makes up the main portion of a matrix report, the list item is the main part of a list report.
List reports are used when you need to repeat a large area of content—perhaps even an entire page—for each record in the dataset. They are often used to create forms. List reports function similarly to a mail merge in a word processing program such as Microsoft Word.
The Transport Information Sheet
Features Highlighted
-
Creating a list report
Business Need The GDS maintenance department needs an efficient way to look up general information about a particular transport that comes in for repair. The user should be able to select the serial number from a drop-down list and see all the basic information about the transport. This transport information sheet should also include the date of the next scheduled maintenance appointment for this transport.
Task Overview
-
Reopen the Chapter05 Project, Create a New Report in the Chapter05 Project, Select the Shared Data Source, and Create the TransportSNs Dataset
-
Create the TransportInfo Dataset
-
Place a List Item on the Report and Populate It
Transport Information Sheet, Task 1: Reopen the Chapter05 Project, Create a New Report in the Chapter05 Project, Select the Shared Data Source, and Create the TransportSNs Dataset
-
If you have closed the Chapter05 project, reopen it.
-
In the Solution Explorer on the right side of the screen, right-click the Reports folder. Select Add | Add New Item. This will display the Add New Item - Chapter05 dialog box.
-
Make sure the Report icon is selected in the Template area. Enter TransportInfoSheet for the name. Click Open.
-
Select <New Dateset…> from the Dataset drop-down list. The Dataset dialog box will appear.
-
Enter TransportSNs for the name in the Dataset dialog box.
-
The data source should be “Galactic (shared).”
-
Enter the following for the query string:
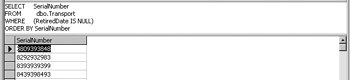
SELECT SerialNumber FROM Transport WHERE RetiredDate IS NULL ORDER BY SerialNumber
-
Click OK.
-
Click the Generic Query Designer button to switch to the Query Builder.
-
Right-click in the SQL pane and select Run from the context menu. The Query Builder should appear similar to the illustration.
-
Right-click in the results pane and select Clear Results from the context menu.
Task Notes The TransportSNs dataset provides a list of the serial numbers for all the active transports at GDS. This dataset is used to populate the drop-down list from which the user will select which transport the Transport Information Sheet will be printed for. Because the query for this dataset is relatively straightforward, it is faster to type the query string by hand rather than build it using the Query Builder.
This is not the case with the query string for the second dataset required by this report, as you shall see in the next task.
Transport Information Sheet, Task 2: Create the TransportInfo Dataset
-
Select <New Dateset…> from the Dataset drop-down list. The Dataset dialog box will appear.
-
Enter TransportInfo for the name in the Dataset dialog box. The data source should be Galactic. Click OK.
-
Click the Generic Query Designer button to switch to the Query Builder.
-
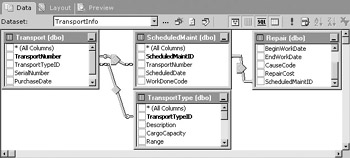
Right-click in the diagram pane of the Query Builder screen. Select Add Table from the context menu. Add the following tables to the query:
Transport (dbo)
TransportType (dbo)
ScheduledMaint (dbo)
Repair (dbo)
-
Click Close to exit the Add Table dialog box.
-
Right-click the link between the Transport and the Repair tables and select Remove from the context menu. (You may have to rearrange the tables in the diagram pane to make this visible.)
-
In the Repair table, scroll down until you can see the ScheduledMaintID field. Click this field and drag it to the ScheduledMaintID field in the ScheduledMaint table.
-
Right-click the diamond in the middle of the link that was created in the previous step. Select the command Select All Rows from ScheduledMaint (dbo) in the context menu.
-
Find the diamond in the middle of the link between the Transport and ScheduledMaint tables. (You may have to rearrange the tables in the diagram pane to make this visible.) Right-click this diamond and select Select All Rows from Transport (dbo) from the context menu. With a bit of rearranging, your screen should look similar to the illustration.
-
Check the following columns in the Transport table:
SerialNumber
PurchaseDate
-
Check the following columns in the TransportType table:
Description
CargoCapacity
Range
Cost
Crew
Manufacturer
ManAddr1
ManAddr2
ManCity
ManState
ManZipCode
ManPlanetAbbrv
ManEmail
-
Check the following column in the ScheduledMaint table:
ScheduledDate
-
Check the following column in the Repair table:
RepairID
-
In the grid pane, type the following in the Criteria column for SerialNumber:
= @SerialNumber
-
In the Criteria column for RepairID, type this:
IS NULL
-
Right-click in the diagram pane and select Group By from the context menu.
-
In the grid pane, in the Group By column for ScheduledDate, select Min from the drop-down list.
-
In the Alias column for ScheduledDate, change “Expr1” to “NextMaintDate.”
-
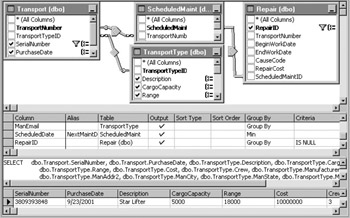
Right-click in the SQL pane and select Run from the context menu. Enter 3809393848 for the @SerialNumber parameter and click OK. The Query Builder should appear similar to the illustration.
-
Right-click in the results pane and select Clear Results from the context menu.
Task Notes The TransportInfo dataset must include all the information about a selected transport. This is not complicated except for the last item noted in the business need for this report: the date of the next scheduled maintenance for this transport. You will need a little background on the way that the Galactic database functions with respect to scheduled maintenance in order to understand this query.
Records are added to the ScheduledMaint table for each time a transport needs to come into a maintenance facility for preventative maintenance. These are considered appointments for preventative maintenance. They are scheduled for dates in the future. Transports may have more than one pending preventative maintenance appointment. The ScheduledMaint table records are linked to a transport by the TransportNumber field.
When a transport comes in for preventative maintenance, a record is added to the Repair table. This indicates that an appointment for preventative maintenance has been fulfilled. The record in the Repair table is linked to the record in the ScheduledMaint table by the ScheduledMaintID field. If a scheduled appointment is missed, the appointment is rescheduled by changing the value in the ScheduledMaint.ScheduleDate field to a value in the future.
Given these business rules, records in the ScheduledMaint table for a given transport that do not have corresponding records in the Repair table represent pending preventative maintenance appointments. The record that has the minimum value in the ScheduledDate field represents the next appointment. To find this record, we are joining the ScheduledMaint table to the Repair table using a left outer join. Because we require the RepairID to be NULL, our result set will only include the pending appointments (that is, the records in the ScheduledMaint table that do not have a matching record in the Repair table).
Because a transport may have more than one pending appointment, we could end up with more than one record for a given transport. We need to use GROUP BY to consolidate these into one record. The MIN() aggregate function is used to find the ScheduledDate field with the lowest value (that is, the next scheduled appointment).
Transport Information Sheet, Task 3: Place a List Item on the Report and Populate It
-
Click the Layout tab to begin working on the report layout.
-
Select Report | Report Parameters from the menu. The Report Parameters dialog box will appear.
-
For the Prompt value, change “SerialNumber” to “Serial Number.”
-
Uncheck Allow Null Value.
-
Select From Query for Available Values.
-
Select TransportSNs from the Dataset drop-down list.
-
Click OK.
-
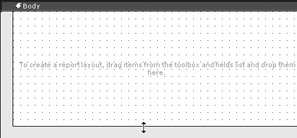
Move your mouse pointer to the bottom of the white report layout area so that it changes from the regular mouse pointer to the double-headed arrow, as shown in the following illustration. The white report layout area is actually the body of the report.
-
Drag the bottom of the report body down to create more room to lay out the list report.
-
Click the List report item in the Toolbox. The mouse pointer will change to a list icon and crosshairs when you move your mouse pointer over the report layout area.
-
Click and drag the mouse over the entire report body.
-
When you release the mouse button, after dragging, a list will be created to occupy the area you just defined.
-
Place a text box across the top of the list. This will be the title. Set its properties as follows:
Property
Value
FontSize
16pt
FontWeight
Bold
Name
Title
TextAlign
Center
Value
Transport Information Sheet
-
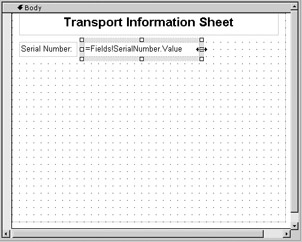
Select Textbox from the Toolbox and place a text box under the existing title as a second title. Type Serial Number: in this text box. Size the text box so that it just fits this text. This will serve as the label for the Serial Number field.
-
Make sure that TransportInfo is selected in the drop-down list at the top of the Fields window. When TransportInfo is selected, the Fields window will display a list of fields in the TransportInfo dataset.
-
Drag the SerialNumber field from the Fields window and place it to the right of the text box that was added in step 14. Click the white square to the right-center of the SerialNumber text box and drag it until the text box is approximately twice its original size. Your report layout should appear similar to the illustration.
-
Repeat this operation with each of the following fields, creating a label for the field and then placing the field to the right of the label:
Label
Field
Purchase Date:
PurchaseDate
Transport Type:
Description
Cargo Capacity:
CargoCapacity
Range:
Range
Cost:
Cost
Crew:
Crew
Next Maint:
NextMaintDate
-
Set the properties for these fields as follows:
Field
Property
Value
PurchaseDate
Format
MM/dd/yyyy
PurchaseDate
TextAlign
Left
CargoCapacity
TextAlign
Left
Range
TextAlign
Left
Cost
Format
###,###,###.00
Cost
TextAlign
Left
Crew
TextAlign
Left
NextMaintDate
Format
MM/dd/yyyy
NextMaintDate
TextAlign
Left
-
Select Line from the Toolbox and drag a line across the report layout at the bottom of the Serial Number label and Serial Number field. If you drag too far to the right while you are creating the line, Visual Studio will automatically increase the size of the List item and the body of the report. If this happens, simply reduce the size of the line, then reduce the width of the List item, and finally reduce the width of the body of the report.
-
Select Rectangle from the Toolbox and drag a rectangle around the unoccupied portion of the report body below the NextMaint fields. Set the properties of the rectangle as follows:
Property
Value
BorderStyle
Solid
-
Select Textbox from the Toolbox and place a text box in the upper-left corner of the rectangle. Type Manufacturer: in this text box. This is the manufacturer label.
-
Drag the Manufacturer field from the Fields window and place it inside the rectangle to the right of the manufacturer label. Size this field until it goes all the way to the right side of the rectangle.
-
Place the ManAddr1 and ManAddr2 fields inside the rectangle, below the Manufacturer field. Make these new fields the same size as the Manufacturer field.
-
Place a text box directly inside the rectangle, below the ManAddr2 field.
-
Right-click in the text box added in step 24 and select Expression from the context menu.
-
Click the plus sign to expand the Fields(TransportInfo) node in the Fields area.
-
Select the ManCity field and click Append.
-
In the Expression area, type the following after Fields!ManCity.Value:
& ", " &
-
Select the ManState field and click Append.
-
In the Expression area, type the following, including a space before and after each ampersand (&) character after Fields!ManState.Value:
& " " &
-
Select the ManZipCode field and click Append.
-
In the Expression area, type the following:
& " " &
-
Select the ManPlanetAbbrv field and click Append. Click OK.
-
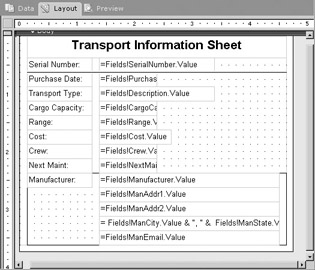
Drag the ManEmail field from the Fields window and place it inside the rectangle under the text box added in step 24. Enlarge this text box. Your report layout should appear similar to this:
-
Click the Preview tab.
-
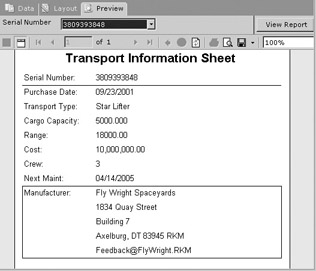
Select the first serial number from the Serial Number drop-down list and click View Report. Your report should appear similar to the illustration.
-
Click the Save All button in the toolbar.
Task Notes As you saw in the Transport Information Sheet report, the List item allows you to place information anywhere. Text boxes, lines, and rectangles can be placed anywhere within the List item to create complex forms. This type of report is good for presenting a large amount of information about a single entity, as we did in this report.
As stated earlier, the contents of the List item are repeated for each record in the dataset. The TransportInfo dataset selects only a single record based on the user’s selection of a serial number. Therefore, our report only has one page.
The Line report item is used simply to help format the report. It helps separate information on the report to make it easier for the user to understand. When working with the Table report item, we could use the borders of the text boxes in the table cells to create underlines. In the more freeform layout of the List report, the Line report item often works better than using cell borders.
The Rectangle report item serves two purposes. When its border is set to something other than None, it becomes a visible part of the report. Therefore, it can serve to help separate information on the report in the same manner as the Line report item. This is how we are using the Rectangle report item in this report.
The Rectangle report item can also be used to keep together other items in the report. We will examine this use of rectangles in Chapter 7.
EAN: 2147483647
Pages: 109