Report Authoring Architecture
As mentioned previously, Reporting Services reports are created using Microsoft Visual Studio .NET 2003. Visual Studio contains all the tools to create a wide variety of reports for Reporting Services. Everything you need to select information from data sources, create a report layout, and preview the report to test your creation is right at your fingertips.
Visual Studio does not come with Reporting Services. Instead, you need to obtain one copy of Visual Studio .NET 2003 for each person who will be authoring reports. If you have a copy of Visual Studio that you are using to develop Visual Basic .NET, C#, or ASP.NET applications, you can use that same copy for creating reports. If you do not currently own a copy of Visual Studio, you will need to obtain a copy and install it before installing Reporting Services.
Visual Studio .NET 2003 is known as an integrated development environment, or IDE. Integrated development environments came into being when the people who create programming languages thought it would be more convenient if the editor, compiler, and debugger were packaged together. Prior to the advent of integrated development environments, creating and debugging software could be a long and tedious process. With an IDE, however, a programmer can be much more efficient while writing and testing an application.
Even though we will be creating reports rather than writing software, Visual Studio provides us with a very friendly working environment. We won’t be editing, compiling, and debugging, but we will be selecting data, laying out the report, and previewing the end result. All of this is done quickly and easily within Visual Studio.
The Business Intelligence Project Type
Visual Studio can be used to build a wide variety of software solutions. It supports a number of different programming languages, from Visual Basic .NET to C#. It can create a number of different types of programs—from an application that runs on a single PC to a website that runs on a cluster of Internet servers.
To facilitate this variety, Visual Studio supports many different types of projects. These project types organize the multitude of programs that can be created within Visual Studio into related groups. Reporting Services reports are created using the Business Intelligence project type.
Project Templates
When you choose to create a new project in Visual Studio, you will see the New Project dialog box shown in Figure 1-1. The Project Types area shows all the various project types available through your installation of Visual Studio. This will vary depending on your version of Visual Studio and which programming languages have been installed.
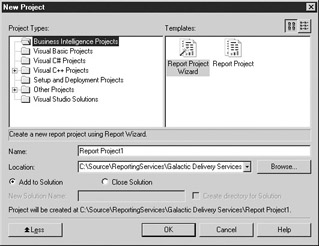
Figure 1-1: The New Project dialog box
The Business Intelligence project type contains two templates: Report Project Wizard and Report Project. Each of the templates will ultimately create a report project. The Report Project Wizard template uses the Report Wizard to guide you through the process of creating the first report in your new report project. The Report Project template simply creates an empty report project and turns you loose.
Report Structure
A report project can contain a number of reports. Each report contains two distinct sets of instructions that determine what the report will contain. The first is the data definition. The data definition controls where the data for the report will come from and what information will be selected from that data. The second set of instructions is the report layout. The report layout controls how the information will be presented on the screen or on paper. Both of these sets of instructions are stored using the Report Definition Language.
Figure 1-2 shows this report structure in a little more detail.
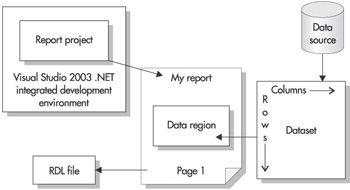
Figure 1-2: Report structure
Data Definition
The data definition contains two parts: the data source and the dataset. The data source is the database server or data file that provides the information for your report. Of course, the data source itself is not included in the report. What is included is the set of instructions that the report needs to gain access to that data source. These instructions include the following:
-
The type of source you will be using for your data (for example, Microsoft SQL Server 2000, Oracle, DB2, Informix, or Microsoft Access). Reporting Services will use this information to determine how to communicate with the data source.
-
The name of the database server or the path to the data file.
-
The name of the database.
-
The login for connecting to this data source, if a login is required.
When the report is executing, it uses the data source instructions contained in the report to gain access to the data source. It then extracts information from the data source into a new format that can be used by the report. This new format is called a dataset.
The content of the dataset is defined using a tool within Visual Studio called the Query Builder. The Query Builder, as the name implies, helps you to build a database query. This query provides instructions to the data source telling it what data you want selected for your report. The query is stored in the report as part of the data definition.
The data that is selected by the query into the dataset consists of rows and columns. The rows correspond to the records that the query selects from the data source. The columns correspond to fields that the query selects from the data source. Information on the fields that will be selected into the dataset is stored in the report as part of the data definition. Only the information on what the fields will be called and the type of data they will hold is stored in the report. The actual data is not stored in the report definition but instead is selected from the data source each time the report is run.
Report Layout
The data that the report has extracted into a dataset is not of much use to you unless you have some way of presenting it to the user. You need to specify which fields go in which locations on the screen or on paper. You also need to add things such as titles, headings, and page numbers. All of this forms the report layout.
In most cases, your report layout will include a special area that interacts with the dataset. This special area is known as a data region. A data region displays all the rows in the dataset by repeating a section of the report layout for each row.
Report Definition Language
The information in the data definition and the report layout are stored using the Report Definition Language (RDL). RDL is an Extensible Markup Language (XML) standard designed by Microsoft specifically for storing report definitions. This includes the data source instructions, the query information that defines the dataset, and the report layout. When you create a report in Visual Studio, it is saved in a file with an .RDL extension.
If you have not worked with XML or are not even sure what it is, don’t worry. Visual Studio and Reporting Services will take care of all the RDL for you. For those of you who want to learn more about RDL, we’ll take a quick peek under the hood in Chapter 7. For the really hardcore, a reference to the RDL standard is included in Appendix C.
Visual Studio .NET 2003
Figure 1-3 shows the Visual Studio environment that we will be using for creating and editing reports. We will take a glimpse at some of Visual Studio’s features now and discuss them in more detail in Chapter 5.
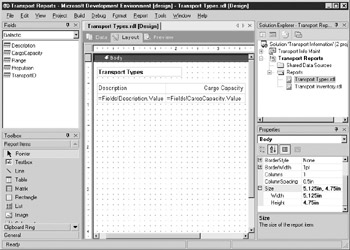
Figure 1-3: Microsoft Visual Studio .NET 2003
Design Window
The Design window, in the center of Figure 1-3, is where you create your report. You create both the data definition and the report layout here. This is also where you get to see your creation come to life!
The Design window has three tabs. On the Data tab, you define the data source for the report. This is also where you use the Query Builder to create datasets.
On the Layout tab, you build the report layout. To do this, you utilize three of the other windows visible in Figure 1-3: the Fields window, the Toolbox, and the Properties window. You will learn how this works in the following sections.
On the Preview tab, you get to see the report layout and the data combined to create an honest-to-goodness report. The report preview allows you to see what the report will look like as HTML or when it is exported to any of the other data formats.
Fields
The Fields window, in the upper-left corner of Figure 1-3, provides a list of the database fields that can be used in your report. These are the fields you selected for your dataset using the Query Builder. Once the dataset has been defined in the Query Builder, the selected fields are displayed in the Fields window.
The Fields window makes it very easy to add database information to your report layout. Simply drag the desired field from the Fields window and drop it in the appropriate location on your report layout in the Design window. Visual Studio will take care of the rest.
Toolbox
The Toolbox, in the lower-left corner of Figure 1-3, contains all the report items you use to build your reports. These report items, sometimes called controls, are responsible for getting the text and graphics to show up in the right place on your reports. As with any construction project, you will be able to properly construct reports only after you have learned how to properly use the tools (report items) in the Toolbox. You will be learning how to use each of the report items in the Toolbox in Chapters 4, 5, and 6.
As with the fields in the Fields window, the report items in the Toolbox are placed on the report layout with a simple drag and drop. However, whereas fields are pretty much ready to go when they are dropped onto the report layout, report items almost always need some formatting changes to get them just the way you want them. This is done by changing the size, the color, the font, or one of many other characteristics of the report item.
Properties Window
The Properties window, in the lower-right corner of Figure 1-3, is the place where you control the characteristics of each report item. The Properties window always shows the characteristics, or properties, for the report item currently selected in the Design window. You will see an entry in the Properties window for each and every aspect of this report item that you can control.
The top of the Properties window shows the name of the selected report item. In Figure 1-3, the body of the report is currently selected. The left column in the Properties window shows the name of each property that can be changed for that report item. The right column shows the current setting for each of those properties. For example, in Figure 1-3 you can see that the report body has a size of 5.125 inches by 4.75 inches.
Solution Explorer
The Solution Explorer, in the upper-right corner of Figure 1-3, manages all the objects you are working with in Visual Studio. Objects in the Solution Explorer are displayed in an outline that resembles an upside-down tree. There is a root entry at the top of the outline, and branch entries appear further down.
The entries in the outline can be expanded by clicking the plus (+) sign next to each entry. The entries can be contracted by clicking the minus (-) sign next to each entry. An entry in the outline that does not have a plus sign or a minus sign next to it does not have any additional entries beneath it. Expanding and contracting outline entries is useful for hiding portions of a complex outline so that you can concentrate on the area you are currently working on.
In Figure 1-3, the root entry is a solution called “Transport Information.” Visual Studio uses solutions to group together a number of projects that all relate to solving the same business problem. Each solution contains one or more projects. This could be a report project, a Visual Basic programming project, or a project from any of the other project types shown in Figure 1-1.
In our example, the Transport Information solution contains two projects. The first is a Visual Basic project called “Transport Info Maint” that creates an application for entering and editing information. The second project is a report project called “Transport Reports” that creates reports to present that information.
A report project always contains two folders. The Shared Data Sources folder contains connections to different sources of data for your reports. As the folder name implies, these data sources can be shared by multiple reports in the report project.
The second folder in the report project is the Reports folder, which contains the reports you create in Visual Studio. In Figure 1-3, the Reports folder contains two reports: Transport Types and Transport Inventory.
When you are editing a report project in Visual Studio, the Design window and the Fields window display information for one report at a time. If your project has multiple reports, you can switch among them by double-clicking a report in the Solution Explorer window.
EAN: 2147483647
Pages: 109