An End-to-End Scenario
|
|
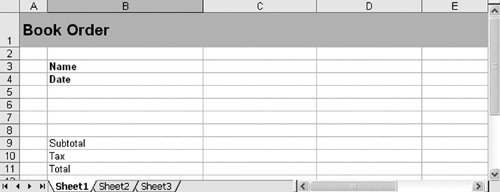
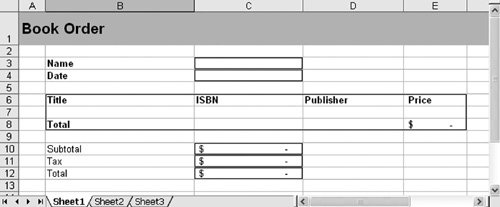
| This section deals with a more complex end-to-end scenario that puts together the schema-creation capabilities of Visual Studio and the schema-mapping capabilities of Excel. When you take a schema and map it into Excel using the XML Source task pane, you enable the exporting and importing of XML data in the spreadsheet. We are going to create an Excel spreadsheet that can be used to record a customer's book order. The spreadsheet will support the import and export of XML that conforms to our book-order schema. The spreadsheet will look like Figure 21.8. Figure 21.8. An Excel spreadsheet for processing a book order.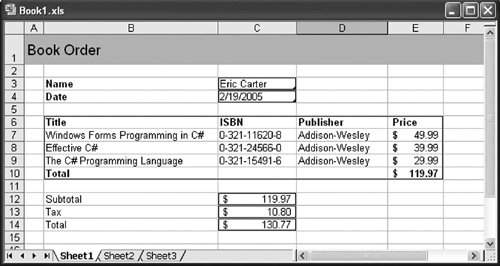 Listing 21.5 shows the XML that this spreadsheet will be able to import and export. Listing 21.5. XML File Generated from Book-Order Spreadsheet
Creating the Schema Using Visual StudioTo create this schema using Visual Studio, follow these steps:
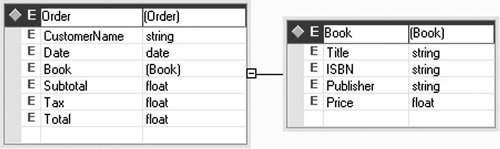
Figure 21.9 shows what the final schema in Visual Studio should look like. Figure 21.9. The book-order schema in Visual Studio. Listing 21.6 shows the generated XSD file. Note that the sequence of Book elements in an Order element is now a sequence with a minimum (minOccurs) of one Book element and a maximum (maxOccurs) of unbounded Book elements. This will allow our schema to represent one or more Books in an Order. Also, having a sequence where maxOccurs is greater than 1 or unbounded will help Excel know that it needs to represent the Books in an Order using an Excel list. Listing 21.6. Book-Order Schema XSD File
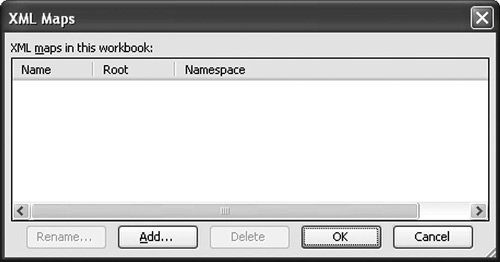
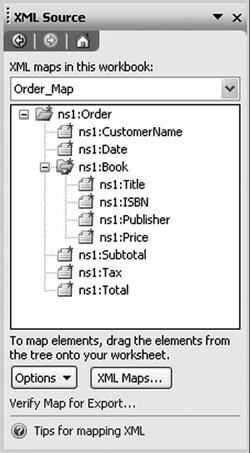
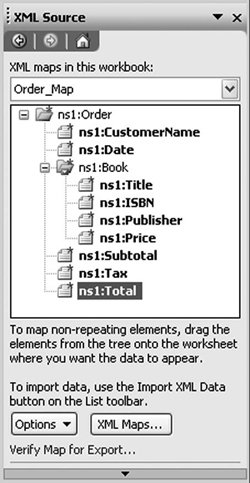
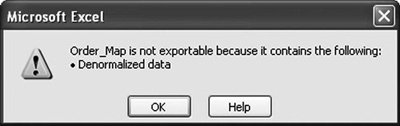
Adding a Schema to the Excel WorkbookNow that we have created a schema, let's add it to an Excel workbook. Launch Excel, and create a new, empty workbook. Bring up the Excel XML Source task pane, as described in the first section of this chapter. You should see the XML Source task pane with no mappings as yet in the task pane. To add an XML map, click the XML Maps button in the XML Source task pane. Doing so brings up the dialog box shown in Figure 21.10. Figure 21.10. The XML Maps dialog box. Click the Add button, and browse to wherever you saved your book-order schema. Select the schema, and click the Open button. The XML map now appears as a loaded XML map in the workbook. Using this dialog box, you can delete and rename an XML map. For now, we will just click the OK button to exit this dialog box. The Excel XML Source task pane shows the XML map we just added, as shown in Figure 21.11. Figure 21.11. The XML Source task pane with an XML map. Mapping the Schema to the Excel WorkbookThe XML Source task pane represents our book-order schema in a tree view. The icon associated with Order indicates a required parent element. The icons associated with CustomerName, Date, Title, ISBN, Publisher, Price, Subtotal, Tax, and Total indicate required child elements. The icon associated with Book indicates a required repeating parent element. Excel also supports other schema constructs, such as attributes and nonrequired elements and attributes. These constructs also have their own icons. Let's try a few different ways of mapping the schema into the workbook. The first approach we will take is to click the root ns1:Order node in the XML Source task pane and drag it to cell A1 in the workbook. Excel creates one list to contain all the data, as shown in Figure 21.12. Figure 21.12. The list created when ns1:Order is dragged to cell A1.The XML Source task pane now indicates that all the elements have been mapped by bolding each element that has been mapped, as shown in Figure 21.13. Parent elements such as Order and Book are not mapped explicitly in the Workbook because these containing relationships do not need to be mapped directly to an Excel cell or list. You can remove a mapping by selecting the mapped cell or list in the Workbook and pressing the Delete key. You can also right-click the elements in the XML Source task pane that are in bold and choose Remove Element to remove the mapping. Figure 21.13. Mapped elements are bolded in the XML Source task pane. At the bottom of the XML Source task pane, click the Verify Map for Export link. Excel displays the dialog box shown in Figure 21.14. Figure 21.14. Mapping cannot be exported because of denormalized data. To consider why this mapping cannot be exported, let's import the XML in Listing 21.5 into our current mapping. In Excel, choose Data > XML > Import. Browse to an XML file containing the XML in Listing 21.5, and click the Import button. Because of the mapping we have established, Excel knows how to bring the XML into the list defined in the worksheet. Figure 21.15 shows the resulting worksheet. Figure 21.15. Result of importing the XML in Listing 21.5.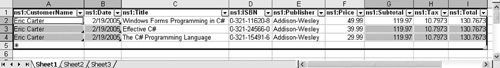 The error we got when we clicked Verify Map for Export was that the mapping contained denormalized data. In Figure 21.15, we have highlighted the data that is denormalized and redundant. If we were to try to export this list by choosing Data > XML > Export, Excel would fail to export because it would not know how to deal with the redundant data. Let's clear out this mapping and try to create a mapping that can be exported successfully as XML. Select the whole worksheet by pressing Ctrl+A and then press the Delete key. This time, we are going to drag in CustomerName, Date, Subtotal, Tax, and Total as individual cell mappings, and we will map the Book element sequence as a list. To prepare the spreadsheet for mapping, let's put in some labels in advance. Figure 21.16 shows the resulting spreadsheet. Figure 21.16. Preparing the spreadsheet for mapping. Now do the following to map the nonrepeating elements to cells in the spreadsheet:
Finally, let's map the repeating elements to a list by dragging the Book element to cell B6. Because Book is a repeating element in a sequence with 1 to unbounded elements, this will create a list containing the elements Title, ISBN, Publisher, and Price as column headers. The column headers created by Excel have the format ns1:Title rather than Title. You can edit these columns in the spreadsheet without breaking the XML mapping. We are also going to use some features of Excel in our spreadsheet:
Now the spreadsheet will look like the one shown in Figure 21.17. Note the blue borders around all the mapped cells or lists. You can hide these blue borders by using the Options button in the XML Source task pane. Click the Options button and then choose the Hide Border of Inactive Lists command from the pop-up menu. Figure 21.17. The final mapped spreadsheet. Now fill out the spreadsheet to make it look like Figure 21.8 earlier in this chapter. Note that when you have the list selected, a new row marked with * displays; you can enter new items in that row. Also note that as you type prices, the total row sums the prices in the list, and the formulas in the spreadsheet calculate the Tax and Total. With the spreadsheet filled out, let's export the data in the spreadsheet as XML conforming to the schema we have mapped. We have assumed that this mapping will be exportable. To verify that, click the Verify Map for Export link in the XML Source task pane. A dialog box should appear that says that our mapping is exportable. Choose Data > XML > Export. Type the name of the XML file you want to export tosomething like bookorder.xml. Then, after exporting the file, open it in a text editor such as Notepad. You should see the XML very similar to that shown in Listing 21.5 earlier in this chapter. |
|
|
EAN: 2147483647
Pages: 221