Monitoring Performance
Using the Windows performance monitoring tools to monitor Exchange server is a topic that could easily cover an entire chapter or even two. In this chapter, we'll cover some basic performance monitoring counters and EMS cmdlets that can help you in determining whether you have performance problems.
Performance Degradation
If all we had to worry about was measuring performance and planning for server capacity, then our jobs would be much easier. In your server design, capacity planning, and analysis, there are a number of addition factors to consider:
-
Consolidated servers (multiple roles on a single server) can contribute to degraded server performance. On a server that supports more than 500 mailboxes as well as other functions, such as Hub Transport and Client Access server roles, ensure that transaction logs, message databases, and message queues are all on separate physical disk drives.
-
Local continuous replication (LCR) will significantly increase the I/O requirements for mailbox servers. LCR databases and transaction logs must be on separate physical disks to ensure that performance does not suffer.
-
LCR will place a significant burden on the server's CPU - by some estimates, as much as 40 percent additional burden if all databases have an LCR copy. Consider this when calculating CPU capacity and the number of mailboxes that a single server can support.
-
Antivirus software configured to scan mailbox databases using the Exchange Antivirus API can use significant amounts of RAM and CPU capacity.
-
Antivirus applications on Hub Transport servers can also use quite a bit of RAM and consume some of the CPU resources.
-
Transport rules are executed for every message that passes through a Hub Transport server. The more transport rules that are processed, the more CPU and memory overhead will be consumed by the Hub Transport server. In an organization with more than 100 transport rules, consider segmenting the Hub Transport role to its own physical hardware.
-
Backup applications use a significant amount of resources during the backup process. Streaming backup applications use a lot of disk I/O time when backing up data in mailbox databases. Volume shadow copy backups of production databases will also impact perceived response time for users who are working during the backups. Perform streaming backups during the off-hours or implement LCR and then volume shadow copy backups of the LCR databases rather than the production databases.
-
Implementing Secure Sockets Layer (SSL) on Client Access servers is essential for providing better security for web applications such as Outlook Anywhere, Outlook Web Access, and ActiveSync. However, SSL will introduce approximately a 25 percent CPU overhead on the Client Access server.
-
EdgeSync can place a larger load on a Hub Transport server if it is run frequently. EdgeSync requires internal connectivity to both Active Directory and mailbox servers.
-
Running scheduled tasks such as updating address lists and e-mail address lists can generate additional disk utilization as well as CPU activity and Active Directory queries.
Exchange Management Shell Cmdlets
Exchange 2007 has a few cmdlets that are useful when testing or measuring potential performance problems. The first is the Test-MAPIConnectivity cmdlet. It allows you to test MAPI connectivity to a mailbox you specify. For example, if you want to test MAPI connectivity for a mailbox named Suriya.Supatanasakul, you would type this:
Test-MAPIConnectivity Suriya.Supatanasakul MailboxServer Database Result Latency(MS) Error ------------- -------- ------ ----------- ----- HNLEX03 Mailbox Database Success 20
The mailbox test will access the mailbox store on which the mailbox is located and access the mailbox to ensure that it can be accessed. The output tells you whether or not that test was successful and how much latency was measured. The latency should usually be less than 200 milliseconds. Higher latencies could indicate a network problem or that the server is not responding to RPC requests quickly enough.
If you do not specify a mailbox name, the cmdlet will access all of the system mailboxes on the local server and report latency for each of those mailbox databases:
[PS] C:\>Test-MAPIConnectivity MailboxServer Database Result Latency(MS) Error ------------- -------- ------ ----------- ----- HNLEX03 Engineering Mail Success 58 HNLEX03 Mailbox Database Success 18
Another useful testing tool for measuring server response time is the Test-Mailflow cmdlet. Without any parameters, the Test-Mailflow cmdlet will send mail to the local system mailbox:
Test-Mailflow TestMailflowResult MessageLatencyTime IsRemoteTest ------------------ ------------------ ------------ Success 00:00:01.6388565 False
The MessageLatencyTime column indicates (in seconds) how long it took to deliver a message. Within the same Active Directory site (or within the same server), this should take no longer than 2 or 3 seconds. By sending a test message (to a system mailbox by default), the Test-Mailflow cmdlet tests not only the Mailbox server's responsiveness, but also how well the Hub Transport server is responding as well as the efficiency of Active Directory queries. Each of these places can be a bottleneck when a message is sent.
However, you can specify a source server and a specific target server using the -TargetMailboxServer parameter. Here is an example:
Test-Mailflow hnlex01 -TargetMailboxServer hnlex03 TestMailflowResult MessageLatencyTime IsRemoteTest ------------------ ------------------ ------------ Success 00:00:02.8396133 True
For tests that indicate a message latency time of greater than 3 to 5 seconds within the same Active Directory site or greater than 10 seconds between Active Directory sites, you should begin to look for potential bottlenecks such as insufficient Hub Transport server capacity, low system resources (low memory, not enough disk I/O capacity) on the mailbox server, and bottlenecks when Active Directory is queried.
If you want to test responsiveness of Outlook Web Access, there is also a Test-OwaConnectivity cmdlet that can prove useful. However, that cmdlet requires a that Client Access server (CAS) test user be created; the New-TestCasConnectivityUser.ps1 script (included with the Exchange 2007 scripts) will create this user for you.
Performance Monitoring as a Work of Art
There is a lot more to performance monitoring than just adding a few counters to a chart or report and then making some conclusions based on what you see. Getting an accurate picture of the performance and bottlenecks is something between a science and an art form. Before we jump in to the actual mechanics of performance monitoring, we would like to cover just a few basic and important tips:
-
When monitoring, take averages over a period of hours (usually during the busiest part of the day).
-
Avoid the temptation to look at a small snapshot of performance and making load-balancing situations. Spikes or lulls in usage will not represent your average performance.
-
Don't run performance monitoring against a server you have just rebooted. Sometimes a server may take a few days to settle in to a typical performance profile.
-
Always develop a performance baseline for a system so that you know what counter values are "normal" for a particular usage profile. Remember, though, that this will change over time as usage increases, more features are used, or more users are added to the system.
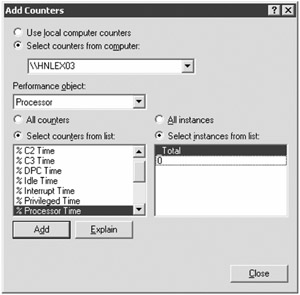
Now let's look at some of the basics of using the System Monitor application and what you can find when you use the Performance Monitor console and the System Monitor object. Figure 6.1 shows the Add Counters dialog box from the System Monitor tool. Counters are the meat and potatoes of what you are looking for when you use the System Monitor tool in the Performance Monitor console. However, we want to look a little more closely at this interface.

Figure 6.1: Adding counters to the System Monitor tool
At the top of the Add Counters interface is the option to specify which computer you are actually looking at. You can either specify the local computer or you can monitor another computer across the network. This means you don't actually have to be sitting on the console of the computer you want to monitor.
The Performance Object drop-down list allows you to select a specific performance object or object category. Different software components will add additional performance monitor objects to a server; this is also true of Exchange Server 2007 roles. Different server roles will add additional performance objects and this will explain why you will see different performance objects on different servers.
Some performance objects have multiple instances. A good example is the Processor object. You will have a_Total instance that represents all of the processes combined and you will have individual processor numbers (starting from 0). This means that you could monitor the performance of an individual CPU on a multiprocessor system.
Finally we get to the counters list. The counters are what actually provide us with data about the components of Windows and Exchange. In Figure 6.1, you see that the performance object that is selected is the Processor object; possible counters for that particular object include the percentage of idle time (%Idle Time), the percentage of time the CPU is running privileged threads (%Privileged Time), and the percentage of time the processor is doing real work (%Processor Time). Each object will have unique counters. Some of these counters report actual, measured data while others (such as the processor counters) may report on data measured in a percentage (0 to 100).
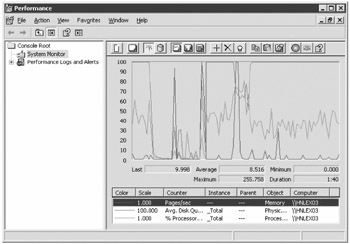
When performance monitor data is displayed, there are two views you'll find useful. The first is the chart view; the chart view is probably the most common (see Figure 6.2).

Figure 6.2: Using the chart view of the System Monitor
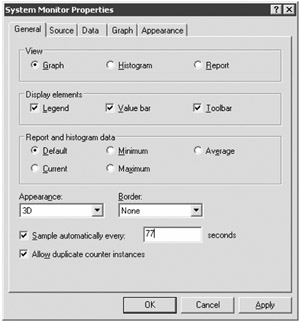
The chart view is best for spotting trends; by default it provides only 100 seconds of historical information, but the sample interval can be changed on the System Monitor property page (shown in Figure 6.3). If you are trying to gather information over a period of time (say, for an entire morning), you would definitely want to change the sample interval. For example, if you wanted the chart to include three hours worth of information, you would change the sample interval to about 77 seconds.

Figure 6.3: Changing System Monitor properties
The Performance Monitor console can also record activity over a period of time using the Counter Logs feature. You can schedule the Performance Monitor to start at a specific time (such as 8:30 in the morning), record the objects and counters you desire, and then stop at a specific time. You can then use the recorded Performance Monitor counters to review activity in a chart (or report) over time.
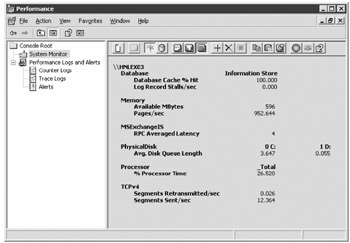
The report view of the System Monitor is not as spiffy-looking as the chart view, but it provides you with a much easier way to look at actual numbers as opposed to trends. If the data source you are viewing is current activity, then the values shown on the report view will be the average of the previous recorded value and the current recorded value. If the data source is a previously recorded log file, then the report view shows you the average over the life span of the log file.
The System Monitor view in Figure 6.4 shows the report view. When looking at live data, the report view is helpful for looking at a specific piece of information at a certain point in time. Remember that when you're looking at performance statistics and analyzing bottlenecks, a particular point in time is not as useful as looking at averages over a period of time, such as when the server is busiest.

Figure 6.4: Using the report view of System Monitor
The report view is helpful in seeing information that is static or that does not change much over time.
Performance Monitor Counters
As we mentioned earlier, a full discussion of performance monitoring and Exchange 2007 could consume several chapters. Indeed, once Exchange 2007 is installed on a server (depending on the roles selected), nearly 70 different Performance Monitor objects are created; that says nothing of the actual counters and instances of each of these objects!
In this section, we'll look at some of the counters that may help you to understand when a server has exceeded its capacity. Let's start with some basic operating system objects and counters; these are pretty universal when it comes to performance monitoring, so you may have seen them before. The recommendations that we are making for minimum or maximum thresholds are based on our own experiences and may not agree with "official" Microsoft documentation. Some of the basic operating system counters are shown in Table 6.1. These can help you decide if you need to add more capacity to an existing server or to add an additional server.
| Object/Counter | Recommended Values |
|---|---|
| Processor/%Processor Time | This is the total percentage of time that the server's CPU is doing useful work (as opposed to idle threads). Examine this counter over a period of typical usage rather than worrying about spikes in activity. The average value of the %Processor Time should usually be less than 70%. If CPU activity is excessive, examine other counters to make sure the server does not need memory or additional disk capacity before deciding you need additional CPU capacity. If the server is truly CPU bound, then the solution may be to move some Exchange roles or mailboxes to an additional Mailbox server. If a server does appear to have a CPU bottleneck, you can use the Process object's %Processor Time counter to isolate which process is using the most CPU time; for this counter, select the process instances you are interested in monitoring. |
| Memory/Available MBytes | Shows the total amount of unused RAM. All versions of Exchange Server love physical memory. Exchange Server 2007 can consume just about as much memory as you can throw at it. This additional memory will improve performance by allowing more and more data to be cached in RAM, thus reducing dependencies on disk I/O. If you see the Available MBytes counter reporting that there is less than 10% of the total amount of RAM available, you should consider adding additional RAM. |
| Memory/Pages/sec | The Pages/sec counter indicates the number of times per second that Windows goes to the page file to store or retrieve information that is in virtual memory. Paging can harm performance since disk access is significantly slower than RAM access. Specific maximum recommended paging values for the Pages/sec counter may vary widely depending on who is making the recommendation. In general, we consider sustained values of more than 10 pages/sec to be excessive. Additional physical RAM is usually the answer to reducing paging, though faster hard disks to support the page file may also provide better throughput for paging. |
| TCPv4/Segments Retransmitted/sec | This counter shows the number of TCP segments that have had to be retransmitted each second. If you find that the value of this counter is greater than 5% of the total TCPv4/Segments Sent/sec counter, then you may have network problems such as routers that are congested or switching problems. Each of these things can cause dropped or lost packets. Always check your network card configurations to make sure they are connected and make sure your network drivers are up-to-date, but this problem is almost always related to the physical infrastructure of your network. |
| Database/Database Cache % Hits | This is an Exchange Server-specific counter for the ESE database engine that tells you what percentage of disk requests are serviced from cache rather than from the disk. This value should be as high as possible (greater than 95%). The lower the value, the more of a disk I/O burden Exchange places on the disk subsystem. Increasing the available RAM on a server can improve the Database Cache % Hits ratio. |
| Database/Log Record Stalls/sec | This is an Exchange Server-specific counter for the ESE database engine that tells you if the ESE database engine is having to wait because the log buffers are full. Increasing the log buffer size may correct this, or you can increase the amount of memory in the server. Increasing the memory may reduce the amount of I/O operations that are necessary. If the server has sufficient memory, then improving the speed of the disk subsystem may be the next move. Moving transaction log file to dedicated spindles can help, as can increasing the I/O capacity of the disks that are used by the transaction logs. On servers that are hosting multiple server roles, moving roles that are disk intensive (such as the Mailbox and Hub Transport roles) to different servers can reduce the I/O load on the disk subsystem. |
| LogicalDisk/ %Disk Time | This counter reports how busy the disk is performing read and write operations. This is one of those counters that should be monitored over a period of typical activity. This value should not exceed 75% average utilization during this time. If disk usage is excessive, adding physical memory or additional disk I/O capacity can help, as can moving data or transaction logs off to other physical disks. |
| LogicalDisk/Avg. Disk Queue Length | The average disk queue length is the number of requests waiting in the disk queue to either be written to the disks or read from the disk. This is another value that should be monitored over a period of average activity rather than looking at a single point in time. The value should not be more than 2 over a sustained period of activity. Larger values may indicate that the disk subsystem is not able to keep up with the disk I/O requirements. If disk usage is excessive, adding physical memory or additional disk I/O capacity can help, as can moving data or transaction logs off to other physical disks. |
| MSExchangeIS/RPC Averaged Latency | The RPC Averaged Latency counter reports the latency of remote procedure calls that are serviced by the information store. The value is the average if the RPC latency of the last 1,024 RPC packets; the value displayed is in milliseconds. In general, it should not exceed 50 milliseconds. Insufficient server resources can often cause this value to be too high, but it is more frequently due to network problems. |
| MSExchangeIS/RPC Requests | The RPC Requests counter reports the number of remote procedure call requests that are currently being serviced by the information store. The information store service can service a maximum of 100 requests and this value should usually not exceed 30 requests. Insufficient Exchange Server resources (either memory or I/O capacity) usually contribute to the server accumulating RPC requests. If RPC requests are not being serviced in a timely manner, the RPC Averaged Latency counter value will also increase. |
| Network Interface/Bytes Total/sec | Bytes Total per second indicates the total data transfer rate of the network adapter. For 100MB network adapters, this value should be below approximately 6MB/second. For 1GB network adapters, this value should be below 60MB/second. If these values are exceeded, it may indicate that the network is a bottleneck or the server is under too much load. Installing additional servers and moving mailboxes or server roles may alleviate this condition. Upgrade to 1GB adapters and switches for the network segment that hosts the Exchange servers with only 100MB network adapters. Additional network adapters can also alleviate performance problems by locating clients on one network segment and Active Directory resources on a different network segment. |
| MSExchange ADAccess Domain Controllers/LDAP Read Time | The LDAP read time is the time (in milliseconds) that it takes to send an LDAP query and receive a response. For this counter, there are multiple instances (each a separate domain controller). The value of this counter should stay below 50ms on average. If it is higher than this on a sustained basis, you have a domain controller bottleneck. Adding additional domain controllers, adding additional memory to existing domain controllers, or replacing 32-bit Windows domain controllers with 64-bit domain controllers may help. Of course, poor network performance can also cause this counter to be high; local domain controllers are always preferred to domain controllers in another Active Directory site. |
| MSExchange ADAccess Domain Controllers/LDAP Search Time | The LDAP search time is the amount of time (in milliseconds) that it takes to send an LDAP search to a domain controller and then receive a response. Performance characteristics for this counter are the same as the LDAP Read time mentioned earlier. |
While we can't easily come up with performance counters that will help you in every situation, the ones in Table 6.1 are generic enough to help you get started and to help you in deciding if you have a specific type of bottleneck.
EAN: 2147483647
Pages: 198