Capacity Planning for Memory
3 4
When considering the adequate capacity planning of memory, you need certain pieces of information, including the number of concurrent users that will be on the system, the transaction workload type, and of course the operating system type. In sizing, you would typically start by conducting an interview. In this case, we are sizing a database server, so information pertaining to the memory usage and client application utilization do not affect database server size. You might decide against interviewing the application designer, but that would be a mistake.
The database server processes requests from users for information needed to complete transactions. To size a database server's memory, you need to know the number of concurrent user connections and the number of transaction I/Os that will be generated by those users. These I/Os are in the form of read and write operations. The application designer is necessary during the interview to provide information pertaining to the various transactions and the I/Os they will generate.
When calculating the proper amount of memory for your system, you must also take into account things like desirable cache hit rate and page faulting. Consider the following typical scenario: You are involved in sizing a system for a database server that will be used for an OLTP order entry system and need to know the number of concurrent users that will be generating the workload. This piece of information will help you decide the amount of memory that you will need. For example, you know that 50 concurrent users will be on the system at any given time. For this system, you will need 25 MB of memory just for the users.
NOTE
Generally, you should allow 500 KB of memory for each user because 500 KB is what the shadow process needs. The shadow process is the user process that is present for each user on the system.
Next you need to know the operating system that will be used. In this case, the operating system is Microsoft Windows 2000, which uses about 20 MB of memory. This brings your total memory up to 45 MB so far. You also need to know the size of the database executable that you are going to use—in this case, Microsoft SQL Server, which uses 5.5 MB. The total memory required is now 50.5 MB.
The final piece of information you need is the size of the database processing area. This area consists of two elements: the log area and the database cache. The log area holds the information about write activity that is taking place. This area is extremely important because if a system failure occurs during the processing of a transaction, the information held in the log area will be used to restore the "before" image—the image of the database before the failure occurred. The log area is also referred to as the audit trail.
The database cache is a special area of your system. All the data processed by your system will pass through this area. The larger the database cache, the greater your cache hit rate. The cache hit rate is the rate at which your system finds the data it is looking for in memory—obviously, you want the greatest cache hit rate you can get. If the desired information is not resident in cache memory, a cache fault occurs. A cache fault is similar to a page fault in that the desired information must be retrieved by the system and put in cache memory. So, a cache area that is too small will cause physical I/Os to occur because the system must access the disk to retrieve data not present in the cache. These physical I/Os will of course increase the response time of the transaction.
To calculate cache size, use the following formula:
cache size = (cache block size) * (number of blocks in cache)
The cache block size is the amount of data that will be transferred per I/O. Remember that SQL Server has a preset cache block size of 8 KB. The number of blocks in cache is simply how many blocks you want the cache to hold. In OLTP, choose a smaller block size because the transfer will be small and the smaller the block size, the less time the transfer will take. In DSS transfers, the block size should be much larger because the transfer will be much larger and the larger block size will reduce the number of I/Os.
NOTE
No set cache size can guarantee a 90 percent or better cache hit rate. A good rule of thumb is a cache size of about 25 MB for a small system, 70 MB for a medium system, and 215 MB for a large system. Systems with very large databases (around 300 GB) can require as much as 3 GB of cache to achieve a desired cache hit rate.
From the information we've collected so far, we can calculate the minimum amount of memory we should require. The following formula is commonly used for calculating the minimum memory required by a system:
minimum memory =(system memory) + (user memory) + (database process memory)
Here system memory is the amount of memory required by the operating system and SQL Server, user memory is the 500 KB allotted for each concurrent user, and database process memory is the memory needed by the log and cache.
This relatively simple equation can be used for calculating the minimum memory required for normal operation of both OLTP and DSS applications. With a DSS system, we would select a larger block size because a DSS application performs full table scans in sequential read mode. This capability allows more records to be read per physical I/O. Also with DSS systems, cache will not be used because all the I/Os will be physical.
In an OLTP application system, you should check the cache hit rate when the system is installed. A high cache hit rate will help ensure that your system will have the best possible response time and performance.
NOTE
The target cache hit rate for your system should be as close to 100 percent as possible and not less than 90 percent.
Collecting Memory Usage Data
When a sized system is configured and tuned, you should routinely collect performance data for memory usage. You can use this data to help ensure that the system you have created meets the SLA requirements for items such as response times and memory or CPU utilization. This data collection can be done simply by using Microsoft Performance Monitor for the Microsoft Windows NT environment.
NOTE
Microsoft Performance Monitor is called System Monitor in Microsoft Windows 2000.
Remember that this is a capacity planning analysis and therefore should have a large reporting interval. The duration of the measurement should be in hours—in most cases, 24 hours—and the reporting interval should be set to 24 hours as well. One record per day written to the performance database is adequate for capacity planning studies. The performance criteria, called counters, that you select for monitoring will be averaged over the reporting interval period. The memory counters you can select for your capacity planning studies are contained in the Memory object. (In Performance Monitor, an object is a selection of counters.)
NOTE
To start Performance Monitor, click Start. Then choose Programs, Administrative Tools (Common), and Performance Monitor. In the Performance Monitor window, choose Add To Chart from the Edit menu. You can use the Add To Chart dialog box to select the object and counters to monitor. For further information about using Performance Monitor, click the Help button in the Performance Monitor window.
These counters include the following:
- Page Faults/sec This counter contains the average number of page faults that occur in the system per second. Remember that a page fault occurs when a requested code or data page is not in working or standby memory.
- Cache Faults/sec This counter contains the average number of cache faults that occur in the system per second. Remember that cache faults occur whenever the Cache Manager does not find a file's page in the immediate cache.
- Pages/sec This counter contains the average number of pages read from the disk or written to the disk by the system per second. This value is the sum of two other counters—Pages Input/sec and Pages Output/sec. The count includes paging traffic on behalf of the system cache to access file data for applications and pages read to and from noncached mapped memory files. Use this counter if you are concerned about excessive memory pressure (also known as thrashing) and the excessive paging that may result.
- Available Memory This counter indicates the amount of unused memory remaining in the system. This memory can be used as additional memory for database or system usage. Available Memory is the most important counter for memory planning.
NOTE
The Available Memory counter is not part of Performance Monitor. It can be retrieved from the Task Manager by selecting the Performance tab and observing the available memory during the peak utilization period. (To access the Task Manager, right-click on the taskbar and select Task Manager from the context menu.)
At a minimum, you should select Available Memory and Page Faults/sec as part of an overall capacity planning data collection process.
Analyzing Memory Data
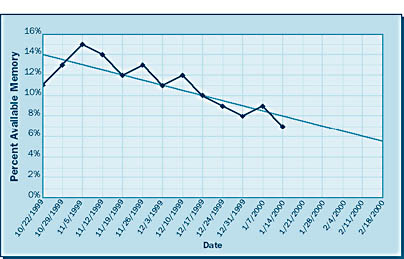
Once your data has been collected, the information can be graphed to predict the future. The graph in Figure 6-4 illustrates predictive analysis. In this example, data has been collected for available memory from October 22, 1999, through January 14, 2000. Using Microsoft Excel, this data was graphed and a trend line calculated. The jagged line represents the actual usage history; the straight line indicates the linear trend this usage is taking. As you can see, the analysis predicts that by February 18, 2000, this system will have less than 6 percent available memory.
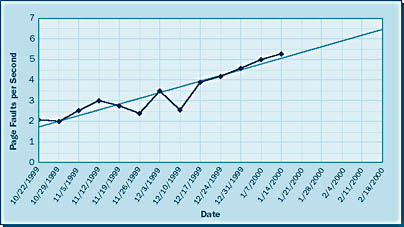
The graph in Figure 6-5 illustrates the increase of page faults for the same period and also the increase that will likely occur as the available memory decreases. Notice that data has been collected for page faults per second for the same time period as available memory. Again using Microsoft Excel, this data was recorded and then graphed, and again the jagged line represents the actual usage history and the straight line indicates the linear trend this usage is taking. In this case, the graph predicts that by February 18, 2000, this system will have over 6 page faults per second. This value serves as an indicator that by that date, response times in general will probably be increasing as well, an indication that the SLA for response times might be violated. This method of predictive analysis is a simple and effective way of keeping track of your memory resources.
EAN: N/A
Pages: 264
- ERP System Acquisition: A Process Model and Results From an Austrian Survey
- The Second Wave ERP Market: An Australian Viewpoint
- Enterprise Application Integration: New Solutions for a Solved Problem or a Challenging Research Field?
- Context Management of ERP Processes in Virtual Communities
- Distributed Data Warehouse for Geo-spatial Services