A Business Case Study
|
| < Day Day Up > |
|
(Provided by Tom Arnold of Redback Networks)
For current case studies please visit http://www.redback.com/
en-US/resources/pdfs/yankee_nextgen.pdf
Disclaimer: Note this is sample case study, which is provided for training purposes only. Case studies and vendor analysis should be done by your selection team.
Introduction
Through a great deal of work and mutual collaboration, the IETF has come to a consensus on the network of the future, one linked by a common MPLS control plane. Technical details are still in motion, and a variety of implementations and solutions are available, each with a unique set of advantages. Most industry participants are in agreement that MPLS will be the unifying glue between legacy and next generation networks. Not surprisingly, MPLS VPNs, one of the first services to leverage the capabilities of MPLS, are already becoming the most important new service offerings of the next ten years.
For the carrier considering rolling out MPLS VPNs, the primary thrust of investigation has been focused on the technology. However, as the technology decisions begin to filter through the organization, the next logical step, especially in today's capital constrained environment, is to create a solid business case for the rollout of MPLS VPNs. Such a business case should analyze not only the service aspects, but also the full network costs for each of the vendors under consideration.
In order to facilitate the understanding of the economics of MPLS VPNs, Redback has created a sample business case for a fictitious service provider, Acme Networks. Acme, a regional service provider based in the southeastern United States, is considering launching a MPLS VPN service in the Atlanta metropolitan area.
The analysis shows that even at modest market adoption rates, a justifiable business case exists for market entry in Atlanta. In five years, Acme could be generating almost $40M in annual revenue and enjoying a net income margin of between 7 and 13 percent. Additionally, a Redback-based network can have significant benefits over those of other vendors: capital expenses are estimated to be 20 to 40 percent lower and operational costs are estimated to be more than 80 percent lower than networks based on other industry platforms.
This paper presents a summary of the assumptions and conclusions of the business case and accompanying financial model. The model first examines the revenues achievable by launching an MPLS VPN service, then it examines the economics of the network based on a variety of vendor's platforms. The model is highly flexible and most inputs can be customized to a customer's unique inputs to facilitate discussion and joint planning. For carriers interested in examining the detailed calculations, or obtaining additional information, please contact your local Redback sales representative to arrange a private demonstration.
Target Market and Revenue
Acme has a nationwide IP/MPLS core network and it has been looking to add an MPLS VPN service offering for some time. Its network is based mainly on leased lines from the local ILEC, Bell South. Acme would like to understand what the economics of service in Atlanta might look like and which vendor's equipment offers the most attractive return.
Atlanta: Addressable Market Overview
The Atlanta metropolitan area is the 11th largest in the United States and is home to over 4 million people. Over 90,000 firms call Atlanta home, employing a total of just over 2 million workers.
Acme has decided that the MPLS VPN service will be targeted at online firms with more than 20 workers. Knowing that an MPLS VPN is not needed by all firms in the Atlanta area, a very conservative estimate of Acme's addressable customer base has been taken. To estimate the addressable market, the total market of firms has been segmented by firm size (in terms of number of employees) and a set of metrics has been applied to each customer segment to determine the addressable market. The Table 9.1 summarizes the total Atlanta market and the addressable market for Acme.
| Firm Size | Total Market | Acme Target Market Share |
|---|---|---|
| 0-4 | 5075 | 0 |
| 5-9 | 15142 | 0 |
| 10-19 | 8997 | 0 |
| 20-99 | 8461 | 2538 |
| 100-499 | 2306 | 1660 |
| >500 | 3273 | 2357 |
| Total | 90254 | 6555 |
Source: Bureau of Labor Statistics (BLS) '99, Redback Analysis
In order to determine the number of customers that Acme will serve, a target market share is established for each customer segment (Table 9.2). This target market share is the market share that Acme will achieve at the end of the five-year period of analysis.
| Firm Size (#Employees) | Target Market Share |
|---|---|
| 20-99 | 20% |
| 100-499 | 30% |
| >500 | 10% |
Of course, it will take some time for Acme to reach its market share goals. Applying a set of annual market share assumptions to Acme's target market, the total number of customers can be determined.
Some of Acme's customers have more than one office location in Atlanta. Acme's service pricing is affected by the number of nodes in a customers network, so the total number of locations, or establishments in the network must also be determined. The table 9.3 highlights the average number of locations per customer in each customer segment for the city of Atlanta. Based on these figures, the total number of establishments in the network has been calculated. Note that the largest firms will have a disproportionate share of the total locations in the network.
| Firm Size (#Employees) | Average Locations per Firm |
|---|---|
| 20-99 | 1.2 |
| 100-499 | 2.3 |
| >500 | 8.6 |
Source: BLS '99, Redback Analysis
One important item to emphasize is that it is not necessary for a firm to have multiple locations in Atlanta to be attracted to an MPLS VPN service - many firms are interested in linking locations in a regional area, or even establishing links with trading partners.
Figure 9.21 provides a summary highlighting both the number of Acme customers and the total number of establishments in the network in each year.
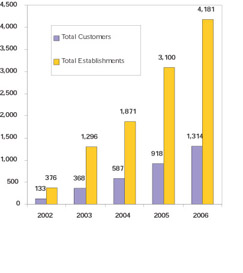
Figure 9.21: Acme Networks: Total Customers and Total Locations
Service Offering
Now that the total number of customers and the total number of locations in Acme's Atlanta network have been determined, it is possible to calculate revenue produced by the network.
Acme would like to create three service offerings customized to the needs of each customer segment. The VPN service will be charged on a per-customer basis, but bandwidth charges will apply to each node in the network. Additionally, maintenance and a one-time set-up fee will be charged. Table 9.4 shows a summary of the major characteristics of each service package:
| Item | Offer A | Offer B | Offer C |
|---|---|---|---|
| Target Market (#Employees) | 20-99 | 100-499 | >500 |
| Bandwidth | F T1 | T1 | T1/T3 |
| Monthly Bandwidth Charge | $300 | $500 | $1200 |
| Monthly VPN Charge | $100 | $500 | $1000 |
| Maintenance and Support Charges | |||
| (% Revenue) | 10% | 10% | 10% |
| Set-up Fee | $400 | $600 | $800 |
Applying the key service characteristics to the customer data, total revenue produced by the Atlanta network is calculated. Figure 9.22 shows the total revenue by firm size. Note that the larger customers provide the bulk of the opportunity.
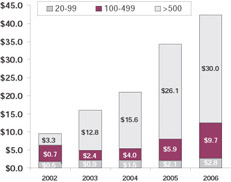
Figure 9.22: Total Revenue by Firm Size ($Millions)
Fixed Costs: Leased Lines and Core Routing
Since Acme Networks does not own the local loop, it will have to lease lines from the local loop provider to reach customers. In practice, the rates for leased lines vary from city to city and even from CO to CO, but for simplicity, the model estimates that on average, the wholesale discount will be between 25 percent and 35 percent of the retail price, with the most expensive connections receiving the largest discount.
Additionally, it's only fair to allocate a portion of the incremental use of the core network to Acme's venture in the Atlanta area. Core routing costs are assumed to be approximately $20/MB/mo.
Network Architecture
The number of customers and the number of establishments will be used to size the network needed to aggregate customer traffic and to deliver MPLS VPN services.
Acme wants to introduce an edge platform into several areas in the Atlanta area to reduce expensive leased line costs and ensure that their architecture is scalable enough for growth. Acme's network planning team has noticed that the other IXCs in the Atlanta market each have four edge PoPs in each of the four principal business districts in Atlanta. Acme decides to follow exactly the same architecture. Each edge PoP will be responsible for aggregating the different types of customer traffic (FT1, T1, T3) and passing it through a redundant OC-48 link to Acme's core router. In addition, because much of the traffic will be local, each edge PoPs will be peered with two other edge PoPs through an OC-12 link. A graphical representation of the architecture is presented in Figure 9.23.
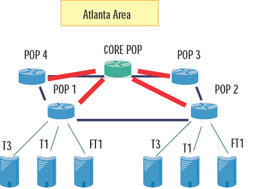
Figure 9.23: Atlanta Area Network Architecture
To simplify the analysis, it is assumed that each edge PoP receives an equal share of the traffic. The bandwidth required on the peering and core routing links is adjusted to reflect a portion of the traffic that will 'hairpin', or will return to another user on the same router. Table 9.5 shows a summary of the per-PoP architecture used to model the equipment needs.
| Tributary Ports | 2003 | 2004 | 2005 | 2006 |
|---|---|---|---|---|
| FT1 | 49 | 82 | 125 | 170 |
| DS0 Volume | 432 | 794 | 1331 | 1992 |
| T1 | 42 | 54 | 94 | 114 |
| T3 | 42 | 54 | 94 | 114 |
| Peer Ports | ||||
| OC-12 | 2 | 2 | 4 | 4 |
| Peak Utilization (Peer) | 47% | 65% | 59% | 76% |
| Trunk Ports (to Core Router) | ||||
| OC-12 | 2 | 2 | 4 | 4 |
| Peak Utilization (Trunk) | 58% | 79% | 72% | 93% |
| Core Router Ports Required (All PoPs) | ||||
| From Edge Router (OC-48) | 8 | 8 | 16 | 16 |
| To Core of the Network (OC-48) | 3 | 4 | 6 | 6 |
| Peak Utilization (Core) | 77% | 79% | 96% | 93% |
Equipment Considerations
Acme does not have any edge platforms deployed in Atlanta. The network planning team is examining four platforms from the leading edge routing vendors:
-
Vendor '1'
-
Vendor '2'
-
Vendor '3'
-
Redback Networks SmartEdge™ 800 Router
All equipment analysis is based on the latest information available for each platform, and limited to shipping interfaces and software releases. In performing cost analyses a 30 percent discount from each vendor's estimated list price has been assumed.
Edge PoP Capex
For each edge PoP the minimum configuration necessary to satisfy the network demand must be determined. In addition to network planning calculations for slots and back plane limitations, the model also includes a calculation to determine whether the software of the platform will handle the number of VPNs demanded at the Edge PoP. Table 9.6 shows the assumptions used for each platform:
| Platform | Maximum VPN Capacity |
|---|---|
| Vendor 1 | 1000 |
| Vendor 2 | 350 |
| Vendor 3 | 500 |
| Redback Networks SmartEdge 800 | 2000 |
Table 9.7 shows the results of the equipment analysis show the chassis needed in each edge PoP. Note that adding VPN capacity to a traditional 'feeds and speeds analysis' highlights the need to deploy extra Vendor '3' platforms. Even though the Vendor '3' chassis are not 'full', limited software capacity will prompt extra chassis purchases in order to satisfy VPN demand. This is certainly not an efficient use of capital.
| Chassis Required | 2003 | 2004 | 2005 | 2006 |
|---|---|---|---|---|
| Redback Networks | 1 | 1 | 2 | 2 |
| Vendor 1 | 1 | 1 | 2 | 2 |
| Vendor 2 | 2 | 2 | 4 | 5 |
| Vendor 3 | 2 | 2 | 3 | 4 |
| Drivers for Additional Chassis | ||||
| Redback Networks | Slots | |||
| Vendor 1 | Slots | |||
| Vendor 2 | Slots | Slots | ||
| Vendor 3 VPN VPN | ||||
Figure 9.24 shows total capital cost for all edge PoPs, calculated by populating the chassis in each edge PoP with the appropriate line cards for service delivery.
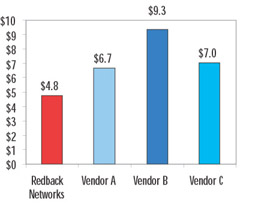
Figure 9.24: Total Capex - All Edge Pops ($M)
Operating Cost of Goods Sold (COGS)
In addition to total capital cost, equipment characteristics have a direct impact on other elements of network operations. For simplicity, these impacts are divided into three broad categories:
-
Central Office COGS (Rack space, Power, HVAC)
-
Outage COGS (SLA violations, Cost of repair)
-
Service COGS (VPN specific service issues)
Using a set of assumptions developed and previously outlined by Probe Research, the major operating costs for each platform are quantified. Table 9.8 shows a summary of the major assumptions for the operational cost analysis:
| Metric | Assumption |
|---|---|
| Rack Space | $1K/Rack/Year |
| Power | $9.50/Amp/Month |
| HVAC | $0.40/Amp/ Month |
| Security | $900/Rack/Year |
| SLA Threshold | 15 Min. |
| SLA Penalty | 20% / Month Service Fees |
| NOC FTE Cost | $100K/yr |
| Customer Service FTE Cost | $70K/yr |
These assumptions are used to calculate the three major components of operating costs.
Central Office COGS are those costs incurred through standard operation of the platform. These include: total power consumption, HVAC requirements, rack space cost and security costs per rack. Figure 9.25 shows a summary of the Central Office COGS for each platform.
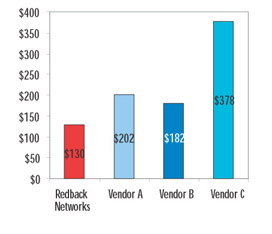
Figure 9.25: Total Central Office COGS ($K) (Rack Space, Security, Power, HVAC)
Outage COGS capture both the cost to respond to network outages and the cost of violating Service Level Agreements (SLAs). Due to the massive reliability advantages and rapid peering processes in the SmartEdge 800 Router, a Redback-based network shows a much lower outage cost as shown in Figure 9.26. This is especially true in today's environment of stringent SLA demands and stiff SLA penalties.
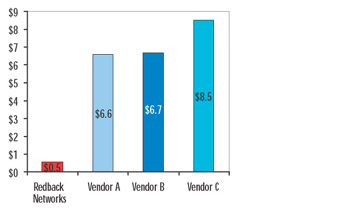
Figure 9.26: Total Outage Related COGS (Outage-related customer services and SLA violations) ($M)
Service COGS capture the cost of servicing VPN customers. VPN services demand a high level of interaction between a firm's IT staff and the network operator due to configuration changes. Through a unique feature in the SmartEdge 800 Router, customers are able to log-in to a partitioned area of the router and perform basic tasks normally handled through a call-center.
The figures below reflect the total cost to service the VPN customers, taking into account this unique feature. Figures 9.27 - 9.28 shows a summary of the major operational costs for each of the platforms.
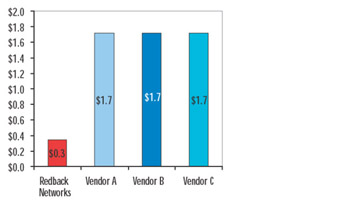
Figure 9.27: Total VPN Service COGS ($M)
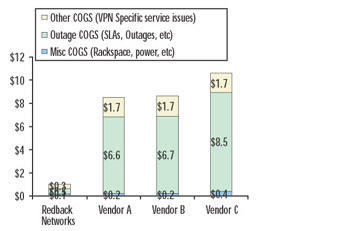
Figure 9.28: Summary Operational Costs
Financial Analysis
Several additional overhead costs also needed to be added to the analysis. Acme needs to invest in a sales and marketing team. Growing to over 1,300 customers in five years is going to take a good marketing campaign and a good sales team. A sales and marketing budget below is assumed at 7.5 percent of 2004 revenues for the first three years, and then 7.5 percent of each year's revenues for the following years. Additionally, the Atlanta business must pay its fair share of administrative overhead. This is assumed at 2.5 percent of 2004 revenues and 2.5 percent of each year's revenues for the following years. The total overhead spending is summarized in Figure 9.29.
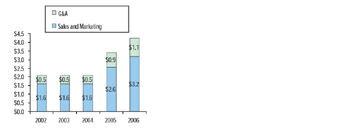
Figure 9.29: Total Overhead Costs ($M)
To finalize the creation of a full income statement and facilitate Net Present Value (NPV) analysis, the following additional assumptions about Acme have been made:
| Metric | Assumption |
|---|---|
| Depreciation Term | 5 years |
| Discount Rate | 12% |
| Taxes | 35% |
Implications and Conclusions
By applying the above assumptions to the revenue and operational cost assumptions, a detailed income statement for each vendor strategy can be calculated.
Acme is a very bottom-line focused organization and very interested in the profits they can generate from the Atlanta area. The net income generated in the five-year period for each vendor strategy is summarized in Figure 9.30.
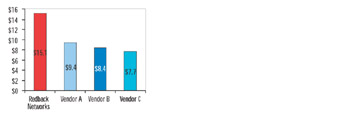
Figure 9.30: Total Net Income: 2002-2006 ($M)
Certainly, the above chart shows that no matter which vendor strategy Acme pursues, there are substantial profits available. Note however, that choosing a Redback-based network would deliver between 50 percent and 100 percent more net income over the given time period.
A stricter measure of project profitability is Net Present Value (NPV). NPV takes into account the time value of money that a simple net income analysis may overlook. Figure 9-31 shows the NPV for each vendor strategy is shown.
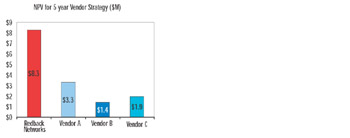
Figure 9.31: Total NPV ($M)
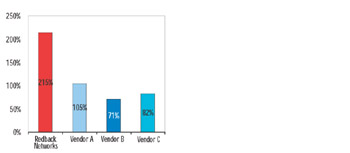
Figure 9.32: ROIC
|
| < Day Day Up > |
|
EAN: 2147483647
Pages: 138