5. Visualization for Summarization
5. Visualization for Summarization
As digital video assets grow, so do result sets from queries against those video collections. In a library of a few thousand hours of video comprising tens of thousands of video documents, many queries return hundreds or thousands of results. Paging through those results via interfaces like Figure 9.8 becomes tedious and inefficient, with no easy way to see trends that cut across documents. By summarizing across a number of documents, rather than just a surrogate for a single video, the user can:
-
be informed of such trends cutting across video documents
-
be shown a quick indicator as to whether the results set, or in general the set of video documents under investigation, satisfies the user's information need
-
be given a navigation tool via the summary to facilitate targeted exploration
As automated processing techniques improve, e.g., speech, image and language processing, more metadata is generated with which to build interfaces into the video. For example, all the metadata text for a video derived from speech recognition, overlaid text VOCR processing and other means can be further processed into people's names, locations, organizations and time references via named entity extraction. Named entity extraction from broadcast news speech transcripts has been done by MITRE via Alembic [39], and BBN with Nymble [4, 40]. Similarly, Informedia processing starts with training data where all words are tagged as people, organizations, locations, time references or something else. A tri-gram language model is built from this training data using a statistical language modeling toolkit [17], which alternates between a named-entity tag and a word, i.e., -person- Rusty -person- Dornin -none- reporting -none- for - organization- CNN -none- in -location- Seattle. To label named entities in new text, a lattice is built from the text where each text word can be preceded by any of the named-entity tags. A Viterbi algorithm then finds the best path through the named-entity options and the text words, just like speech recognition hypothesis decoding.
With a greater volume of metadata describing video, e.g., lists of people's names, locations, etc., there needs to be an overview capability to address the information overload. Prior work in information visualization has offered many solutions for providing summaries across documents and handling volumes of metadata, including:
-
Visualization by Example (VIBE), developed to emphasize relationships of result documents to query words [44]
-
Scatter plots for low dimensionality relationships, e.g., timelines for emphasizing document attributes mapped to production date [11, 14]
-
Colored maps, emphasizing geographic distribution of the events covered in video documents [13, 14]
Each technique can be supplemented with dynamic query sliders [1], allowing ranges to be selected for attributes such as document size, date, query relevance, and geographic reference count.
Consider a query on "air crash" against a 2001 CNN news video subset in the Informedia library. This query produces 998 documents, which can be overviewed using the timeline visualization shown in Figure 9.15. The visualizations shown here convey semantics primarily through positioning, but could be enriched to overlay other information dimensions through size, shape and color, as detailed elsewhere for the Informedia library [15, 11]. By dragging a rectangle bounding only some of the green points representing stories, the user can reduce the result set to just those documents for a certain time period and/or relevance range.
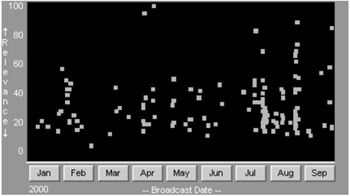
Figure 9.15: Timeline overview of "air crash" query.
For more complex word queries, the VIBE plot of documents to query terms can be used to understand the mapping of results to each term and to navigate perhaps to documents matching 2 words but not a third from the query. VIBE allows users unfamiliar or uncomfortable with Boolean logic to be able to manipulate results based on their query word associations.
For a news corpus, there are other attributes of interest besides keywords, such as time and geography. Figure 9.16 shows both of these attributes in use, as well as the search engine relevance score. The video documents' location references are identified automatically through named entity extraction, and stored with the document metadata for use in creating such maps.
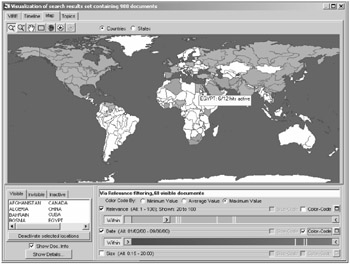
Figure 9.16: Map visualization for results of "air crash" query, with dynamic query sliders for control and feedback.
Figure 9.16 illustrates the use of direct manipulation techniques to reduce the 998 documents in Figure 9.15 to a set of 68 documents under current review. By moving the slider end point icon ![]() with the mouse, only those documents having relevance ranking of 20 or higher are left displayed on the map. As the end point changes, so does the number of documents plotted against the map, e.g., if Brazil only appeared in documents ranked with relevance score 19 or lower, then Brazil would initially be colored on the map but drop out of the visible, colored set with the current state of the slider shown in Figure 9.16. Similarly, the user could adjust the right end point for the slider, or set it to a period of say one month in length in the date slider and then slide that one month active period within January through September 2000 and see immediately how the map animates in accordance with the active month range.
with the mouse, only those documents having relevance ranking of 20 or higher are left displayed on the map. As the end point changes, so does the number of documents plotted against the map, e.g., if Brazil only appeared in documents ranked with relevance score 19 or lower, then Brazil would initially be colored on the map but drop out of the visible, colored set with the current state of the slider shown in Figure 9.16. Similarly, the user could adjust the right end point for the slider, or set it to a period of say one month in length in the date slider and then slide that one month active period within January through September 2000 and see immediately how the map animates in accordance with the active month range.
The map is color-coded based on date, and the dynamic sliders show distribution of values based on the country under mouse focus, e.g., the 6 "Egypt" stories with relevance > 20 have the relevance and date distribution shown by the yellow stripes on the relevance bars. Eick has previously reported on the benefits of using sliders as a filtering mechanism, color scale, and to show data distributions to make efficient use of display space [19].
The visualizations shown in Figure 9.15 and 9.16 do not take advantage of the visual richness of the material in the video library. For the Informedia CNN library, over 1 million shots are identified with an average length of 3.38 seconds, with each shot represented by a thumbnail image as shown in earlier Figures 9.8 through 9.13. Video documents, i.e., single news stories, average 110 seconds in length, resulting in an average image count for document storyboards for these stories of 32.6. These thumbnails can be used instead of points or rectangles in VIBE and timeline plots, and can be overlaid on maps as well. Ongoing research is looking into reducing the number of thumbnails intelligently to produce a more effective visualization [16]. For example, by using query-based imagery (keeping only the shots where matches occur), and folding in domain-specific heuristics, the candidate thumbnail set for a visualization can be greatly reduced. With the news genre, a heuristic in use is to remove all studio shots of anchors and weather maps [16].
Consider again the 998 documents returned from the "air crash" query shown in earlier figures and densely plotted in Figure 9.15. Through a VIBE plot mapping stories to query words, the user can limit the active set to only the results matching both "air" and "crash"; through a world map like that of Figure 9.16, the user can limit the results to those stories dealing with regions in Africa. The resulting plot of 11 remaining stories is shown in Figure 9.17.
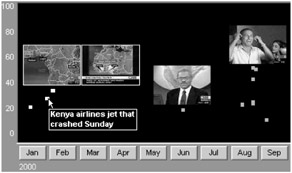
Figure 9.17: Filtered set of video documents from Figure 9.15, with added annotations.
With the increased display area and reduced number of stories in the active set, more information can be shown for each story cluster. Synchronization information kept during the automatic detection of shots for each video, representative images for each shot and dialogue alignment of spoken words to video can be used to cluster text and images around times within the video stories of interest to the user. For a query result set, the interesting areas are taken to be those sections of the video where query terms ("air crash") are mentioned.
Prior work with surrogates underscores the value of text phrases as well, so text labels for document clusters will likely prove useful. Initial investigations into displaying common text phrases for documents focused by visualization filters, e.g., the 11 documents from the full set of 998 remaining in Figure 9.17, have shown that the text communicates additional facts to the user, supplementing the visualization plots [16]. Of course, more extensive evaluation work like that conducted for Informedia single document surrogates will need to be performed in order to determine the utility of video digests for navigating, exploring and collecting information from news libraries.
Initial interfaces for the Informedia digital video library interface consisted of surrogates for exploring a single video document without the need to download and play the video data itself. As the library grew, visualization techniques such as maps, timelines, VIBE scatter plots and dynamic query sliders were incorporated to allow the interactive exploration of sets of documents. Shahraray notes that "well-designed human-machine interfaces that combine the intelligence of humans with the speed and power of computers will play a major role in creating a practical compromise between fully manual and completely automatic multimedia information retrieval systems" [7]. The power of the interface derives from its providing a view into a video library subset, where the user can easily modify the view to emphasize various features of interest. Summaries across video documents let the user browse the whole result space without having to resort to the time-consuming and frustrating traversal of a large list of documents. The visualization techniques discussed here allow the user efficient, effective direct manipulation to interact with and change the information display.
EAN: 2147483647
Pages: 393