Concept 1: Lessons From the S-Curve
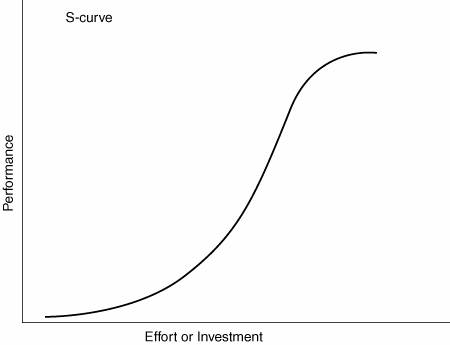
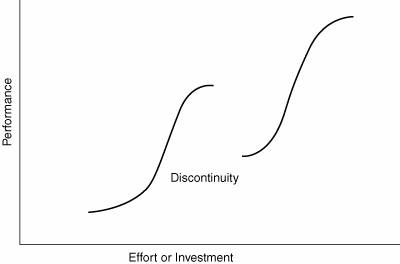
| The first concept is that of the S-curve. Introduced by Richard Foster, the S-curve describes the relationship between the investment of resources in a technology or process and the resulting performance produced by that investment (Figure 1-1).[11] It is referred to as an S-curve because when the results are plotted, the resulting figure typically takes the shape of the letter S. Figure 1-1. An example of an S-curve. In an early stage, as effort is ramping up on a technology or process, there is little return on investment while basic knowledge is slowly gained. As the knowledge base increases, the investment passes a tipping point; after that point, progress accelerates rapidly and then begins to slow as the technology reaches maturity. Beyond a certain point, no amount of additional investment will markedly improve the performance. The single-engine propeller aircraft serves as an excellent example (Figure 1-2).[12] The Wright brothers' first flight in 1903 was at a speed of about 35 mph. Seven years later, in 1910, the Gordon Bennett air race at Belmont Park, New York, was won at 60 mph. As the fundamentals of aircraft design became widely understood, speeds increased to 139.66 mph in 1914 and then to 145.7 mph in 1922. In 1925, Lieutenant James Doolittle, in a Curtiss R3C-2, flew at 232.57 mph. By 1939, the record stood at 463.9 mph, and the S-curve began to flatten. In 1966, some 27 years later, a new record for a single-engine piston aircraft was set at the Reno (Nevada) Air Races at 520 mph. By 1989, that number had improved by less than 9 mph. Somewhere in the vicinity of 525 mph, the limits of single-engine propeller technology were reached. No amount of investment will return significantly more performance. Figure 1-2. S-curve, single-engine propeller aircraft example.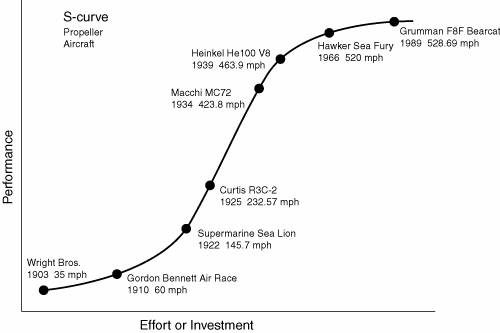 Jet aircraft engine technology offered the next step in performance and, as you might suspect, defined a new S-curve in air speed. The gap between the two curves is referred to as the discontinuity between the two technologies (Figure 1-3). Figure 1-3. S-curves often come in pairs. The example of the single-engine propeller-driven aircraft offers two lessons that are characteristic of innovation and commercialization: the lessons of limits and of discontinuity. Low on the curve there is high risk, great uncertainty, and high potential for growth. High on the curve there is performance certainty, giving rise to a false sense of security and yet little opportunity for growth. The only pathway to significantly greater performance is to jump to a new S-curvefrom propeller to jet, from vacuum tube to transistor, from the horse-drawn vehicle to the automobile. These are the lessons of limits and discontinuities. In the case of biotechnology, the original S-curve might be characterized as the technology for commercialization of animal proteins for human use, as in the case of insulin. Bovine and porcine insulin were extracted from slaughterhouse animals and then purified and sold. The discontinuity created by the second S-curve involved the use of the synthesized insulin gene inserted into bacteria for the production of human insulin. This innovation provided the basis for an entirely new industry. |
EAN: 2147483647
Pages: 204
- An Emerging Strategy for E-Business IT Governance
- Linking the IT Balanced Scorecard to the Business Objectives at a Major Canadian Financial Group
- Measuring and Managing E-Business Initiatives Through the Balanced Scorecard
- Measuring ROI in E-Commerce Applications: Analysis to Action
- Technical Issues Related to IT Governance Tactics: Product Metrics, Measurements and Process Control