10.1 Derivation of performance evaluation parameters
|
| < Free Open Study > |
|
10.1 Derivation of performance evaluation parameters
As mentioned earlier, the message traffic for the network under examination is generated in the host. A queue of messages awaiting transmission is implemented in the node memory shown in Figure 10.2. A message is, therefore, said to enter the network from the host processor and to exit through the same.
After entering the network, the message is broken into a series of packets, each of which is transmitted serially by the network adapter under the control of the IOP. Only one network adapter may have control of the bus at any one time (i.e., only one may transmit at a time). This serial access is controlled by the circulating token. Thus, the network represents a single-server queuing system, where the service provided is the message transmission. All messages in the system are of the same priority so that the system has only one customer class.
Because access to the network is serial by node and because the only server in the system is the network itself, we can consider all message packet arrivals to the server as originating from a single queue. Thus, this single conceptual queue contains the combination of all messages in the individual message queues, ordered by time. Figure 10.6 illustrates this concept.
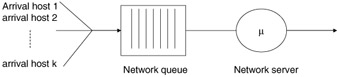
Figure 10.6: Conceptual network server.
For this example, we will assume that messages arrive at the server according to a Poisson distribution. Thus, the probability that we get n arrivals at host i in an interval of length t is given as:
| (10.1) | 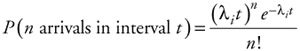 |
where λi is the average interarrival rate at host i. For the Poisson distribution, the time between arrivals is exponentially distributed, and the interarrival time for messages at host i is generated as:
| (10.2) |
The average interarrival time for the conceptual single network server, then, can be represented as:
| (10.3) |  |
We can represent the state of the system during the observation period as the number of messages awaiting transmission through the network. Because of the property of the Poisson arrival process whereby the probability of no more than one arrival or completion in any time period approaches one as the interval length approaches zero, the state transitions satisfy the one-step assumption. That is, the system state only transitions to neighboring states. A state is denoted, n(t), and defines the number of message packets awaiting transmission at time t.
We will perform an analysis that is based upon the operational analysis techniques discussed in Chapter 7. The quantities for this evaluation are as follows:
-
W-Waiting time for a message packet measured from arrival into the network queue until the completion of transmission
-
B-Busy time for the network defined as the total time that there is at least one message packet in the system
These quantities are derived from measurements of three basic quantities measured by instrumentation hardware and software in the testbed. The basic measured quantities are as follows:
-
A(n)-Number of arrivals into the system when there are n message packets in the system
-
C(n)-Number of completions when there are n message packets in the system
-
T(n)-Total amount of time when there are n message packets in the system
Define the total over all n of each of the previous quantities as follows:
| (10.4) | 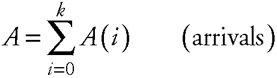 |
| (10.5) | 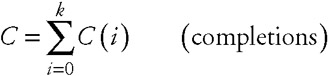 |
| (10.6) | 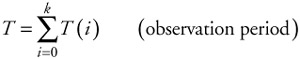 |
In the previous summations, k represents the largest number of message packets awaiting transmission during the observation interval. If we assume flow balance, the total number of arrivals will equal the total number of completions during the observation period. The waiting and busy time defined earlier can be defined in terms of these quantities as:
| (10.7) | 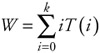 |
| (10.8) | 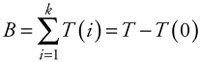 |
Along with these measures, we obtain three additional measures: message transmission time (tx), message arrival time (ta), and message reception time (tr). These measures are shown in relation to a message transmission in Figure 10.7.
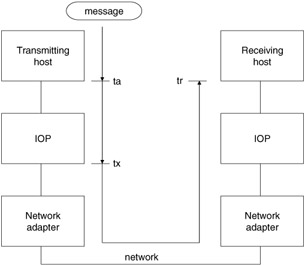
Figure 10.7: Message transmission times.
As in Chapter 7, we define some performance parameters in terms of the basic operational quantities. These are summarized as follows:
| (10.9) |
| (10.10) |
| (10.11) |
| (10.12) |
| (10.13) |
| (10.14) |  |
The first five quantities are standard operational analysis results. The last relates to the performance of the transmission mechanisms, ignoring the queue wait time.
|
| < Free Open Study > |
|
EAN: 2147483647
Pages: 136