|  Click the PivotTable View button in the toolbar; the main Access toolbar changes to the PivotTable toolbar. An empty PivotTable view opens with the PivotTable Field List window active and empty Filter Fields, Column Fields, Row Fields, and Totals or Detail Fields drop zones (see Figure 12.3). Click the PivotTable View button in the toolbar; the main Access toolbar changes to the PivotTable toolbar. An empty PivotTable view opens with the PivotTable Field List window active and empty Filter Fields, Column Fields, Row Fields, and Totals or Detail Fields drop zones (see Figure 12.3).
Figure 12.3. When you open a new PivotTable view of a table or query, the field list of the source table or query has the focus.  Tip  | If the PivotTable Field List isn't visible, click the Field List button on the toolbar. |
You drag fields from the PivotTable Field List to the appropriate drop zone, as follows: Column Fields Usually hold date-based fields to create a left-to-right time series. If you're not creating a time-series PivotTable, you can select any appropriate field of the table or query. As a rule, the field having the fewest number of rows belongs in columns. Row Fields Hold one or more fields that display data by attribute(s). Adding row fields lets you increase the degree of detail displayed by the PivotTable. Increasing the amount of detail data shown is called drilling down or drill-down. Totals or Detail Fields As the central area of the empty PivotTable, these fields display the crosstabulated data. This drop area accepts only fields having numeric values or fields for which you only want to display a count of records. Filter Fields One or more optional fields that let you restrict the number of fields that appear in columns, rows, or both. In most cases, you filter data by column or row fields, not fields dropped in the Filter Fields zone. (A field can appear only in one drop zone of a PivotTable.)
Generating the Initial PivotTable To create the initial PivotTable view of the qry1997OrdersByCountryPT query, do the following: Drag the 1997 Quarter field to the Column Fields drop zone. As the field symbol enters the drop zone, a blue border appears (see Figure 12.4). When you drop the field by releasing the mouse button, a 1997 Quarter filter button appears on the first row, and four columns display quarter numbers 1 through 4. PivotTables automatically add a Grand Total column to the right of the last column you add from the field list. Figure 12.4. When you drag a field from the PivotTable Field List to a drop zone, the drop zone gains a thicker blue border.  Drag the Name field to the Row Fields drop zone, the Orders field to the Totals or Detail Fields drop zone, and the Country field to the Filter Fields drop zone. The PivotTable appears with the rows displaying detail values, as shown in Figure 12.5. Figure 12.5. After dragging the four fields to the locations shown here, the default PivotTable view includes detail values for rows. In this case, the amount of each order obtained by the salesperson appears in the expanded quarter columns. 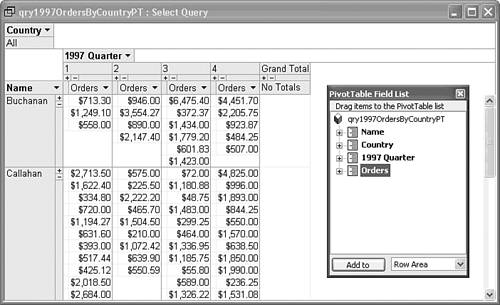 You can't identify the countries for the orders in the columns, so drag the Country field from the Filter Fields drop zone to the Name button to group the orders by country. Close the PivotTable Field list.  Click the Name button to select it, and click the Bold button on the Formatting toolbar to increase the contrast of the selected column (see Figure 12.6). Click the Name button to select it, and click the Bold button on the Formatting toolbar to increase the contrast of the selected column (see Figure 12.6).
Figure 12.6. Moving the Country field from the Filter Fields to the right of the Name field displays the orders for each country. 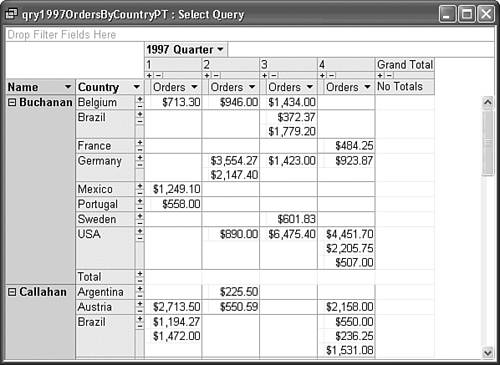
Tip If the Formatting toolbar isn't visible, choose View, Toolbars, Formatting (PivotTable/PivotChart) to add it.
Reducing the Level of Detail and Adding Grand Totals Including amounts for each order in the PivotTable shows excessive detail. One approach for this example is to alter the query design to an aggregate (summary) query and group the individual orders by salesperson, country, and quarter. To modify the query, regenerate the PivotTable data, and add grand totals, do this:  Change to Design view. Change to Design view.
 Click the Totals button to group the query data by LastName, ShipCountry, and 1997 Quarter. Click the Totals button to group the query data by LastName, ShipCountry, and 1997 Quarter.
Open the Total cell for the Subtotal column and choose Sum as the SQL aggregate function. Open the OrderDate field and select Where. Your modified aggregate query design appears as shown in Figure 12.7. Figure 12.7. Change the query design to an aggregate query to sum individual orders by LastName, ShipCountry, and 1997 Quarter columns.   Run the query to verify the design (see Figure 12.8). Run the query to verify the design (see Figure 12.8).
Figure 12.8. The result set of the query design has 251 records; the original query had 408 records (refer to Figure 12.2). 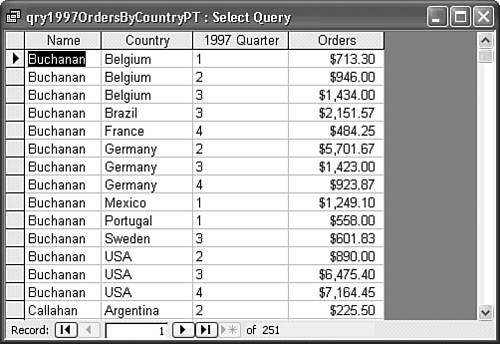 Return to PivotTable view, which now displays the summary data. Figure 12.9. Converting the PivotTable source query to an aggregate query results in a PivotTable with a single value for the total amount of orders from each country. 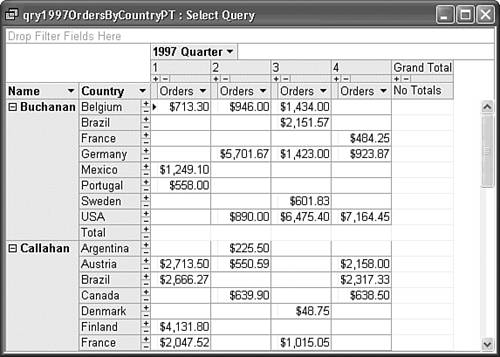  To add Grand Total values, click one of the Orders buttons to select all the Quarter columns, click the AutoCalc button, and select Sum from the aggregate functions list. Adding Grand Totals also adds Totals and Sum of Orders items to the PivotTable Field List and totals rows to each Country entry (see Figure 12.10). Close the PivotTable Field List. To add Grand Total values, click one of the Orders buttons to select all the Quarter columns, click the AutoCalc button, and select Sum from the aggregate functions list. Adding Grand Totals also adds Totals and Sum of Orders items to the PivotTable Field List and totals rows to each Country entry (see Figure 12.10). Close the PivotTable Field List.
Figure 12.10. Adding Grand Totals to the PivotTable also adds Sum of Order totals to the Country entries. 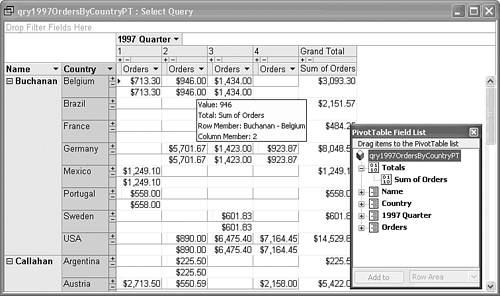  Click the Country button and click Hide Details to display only a single Sum of Orders value for each employee and country. The PivotTable now displays only a single row per country for each employee. Countries from which the employee obtained no orders during the year don't appear. Click the Country button and click Hide Details to display only a single Sum of Orders value for each employee and country. The PivotTable now displays only a single row per country for each employee. Countries from which the employee obtained no orders during the year don't appear.
 With the Country field selected, click the Subtotals button to add a Totals row for each employee (see Figure 12.11). With the Country field selected, click the Subtotals button to add a Totals row for each employee (see Figure 12.11).
Figure 12.11. Hiding detail rows and adding subtotals for each employee results in a more meaningful PivotTable presentation of your data. Bold formatting is applied to the Total label for emphasis. 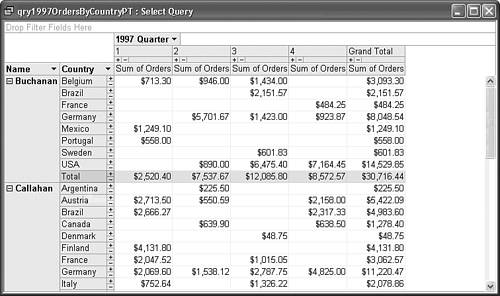  Click the Name button to select the column, and click the Collapse button to remove Country values for the employees and display the summary entries for all employees without scrolling (see Figure 12.12). Clicking the adjacent Expand and Collapse buttons toggles display of detail columns. Click the Name button to select the column, and click the Collapse button to remove Country values for the employees and display the summary entries for all employees without scrolling (see Figure 12.12). Clicking the adjacent Expand and Collapse buttons toggles display of detail columns.
Figure 12.12. Collapsing the Name column eliminates the Country field detail and displays summary data only. Bold formatting is applied to the two Grand Totals labels. 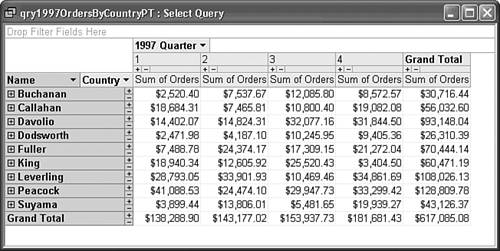
Tip   | You can expand the display for a single employee by clicking the small Show/Hide Details (+) button to the left of the employee's name. The Show/Hide Details button toggles the + and - states. |
Filtering PivotTable Category Values Worldwide sales data probably satisfies top management, but regional managers might want to display only orders received from a particular area, such as North America, Europe, or Scandinavia. By default, all field values appear in PivotTable rows or columns and are included in all calculated values, such as totals. You can filter the PivotTable to display only selected values of a category field, such as Country, by following these steps: Expand the PivotTable display to include the field on which you want to filter. For this example, select the Name field, and click the Expand button to display the Countries column. (You might need to reopen the Field list to access the Name column.) Click the arrow of the field button to filter, Country for this example, in order to open the field value list. The list contains an item for each field value. Click the (All) check box to deselect all fields. Mark the check boxes of the field values you want to include Canada, Mexico, and USA for this example. Click OK to close the list and apply the filter. Figure 12.13 illustrates the sample PivotTable with only the Canada, Mexico, and USA fields selected. To return to displaying all fields, open the list and click the (All) check box. Figure 12.13. This filtered PivotTable view restricts the visible values to orders received from Canada, Mexico, and the USA. 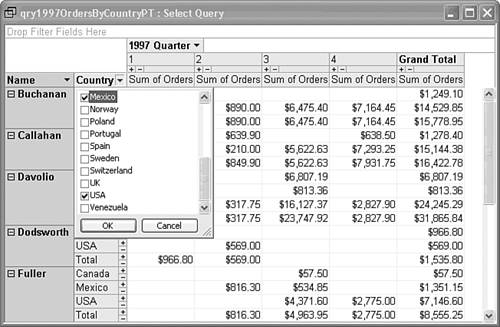
 You also can filter data by rank, such as the top- or bottom-performing salesperson, or the countries with the highest or lowest sales. To test the PivotTable's Top/Bottom Items feature with the sample query, do the following: You also can filter data by rank, such as the top- or bottom-performing salesperson, or the countries with the highest or lowest sales. To test the PivotTable's Top/Bottom Items feature with the sample query, do the following:
Select the Name column, click the Show Top/Bottom Items button, choose Show Only the Top, and choose 1 from the submenu. The PivotTable displays data only for Janet Leverling, the top salesperson for North America orders. Click the Show Top/Bottom Items button, choose Show Only the Bottom, and choose 1 from the submenu. The PivotTable shows Anne Dodsworth occupies the lowest rung on the North America sales ladder. Remove the filter on the Names column by clicking the Show Top/Bottom Items button and choosing Show All. Tip  | Use the AutoFilter toolbar button to toggle between filtered and unfiltered display quickly. |
Select the Country column, click the Show Top/Bottom Items button, choose Show Only the Top, and choose 2 from the submenu. The PivotTable displays data for Germany and the USA for all employees (see Figure 12.14). Figure 12.14. The PivotTable's Top/Bottom Items feature lets you filter items by the value rank. Germany and the USA rank by order amount as the top two countries. 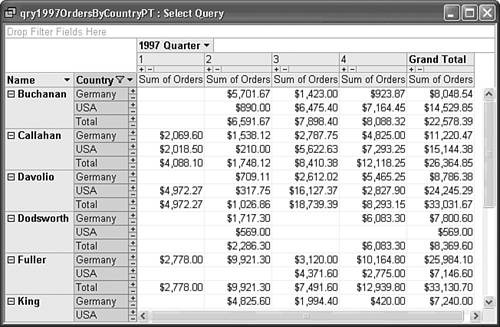 Remove the filter on the Country column by clicking the Show Top/Bottom Items button and choosing Show All. If you select Other in the list of values, the Properties dialog opens to the Filter and Group page, where you can set custom filtering options by numeric or percentage rank.
Increasing the Level of Detail for Drill-Down The preceding section demonstrates the capability to reduce to a manageable level the amount of detail information displayed by PivotTable. Total amounts of the orders obtained by employees for each country might satisfy the vice-president of sales, but sales managers and salespersons might want to review values of individual orders. Commissioned salespersons want order number and date information to ensure that all orders they book are assigned to them. Providing additional drill-down information requires you to modify the underlying sample query and regenerate the value data, as follows: Return to Query Design view. Click the Totals button to remove the Totals row and eliminate data grouping. Drag the OrderID and OrderDate fields of the Orders table field list to the right of the LastName field. (The column sequence isn't important.) Return to PivotTable view, and click the Field List button to display the PivotTable Field List, which now has Order ID, Order Date, Order Date by Week, and Order Date by Month items added. Drag the Order ID field to the immediate left of the Orders button. Drag the Order Date field to the immediate right of the Order ID button (see Figure 12.15), and close the PivotTable Field List. If the Order... fields aren't in the correct sequence, drag their buttons to the proper relative position. Figure 12.15. The PivotTable now displays Order ID and Order Date values for each order. 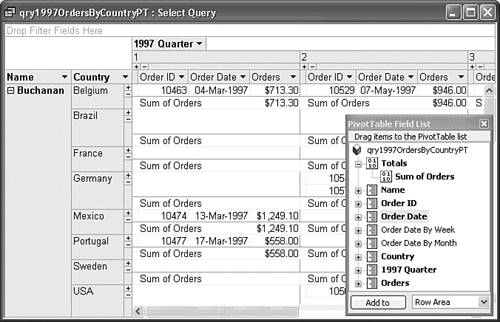 Click the Hide Details button to reduce the PivotTable's level of detail.
Tip Be judicious when increasing the detail level of PivotTables by eliminating grouping in your query. The later "Optimizing Performance of PivotTables" section describes performance problems that result from large query result sets.
Changing Fill/Background and Text Colors  You can increase the contrast of the PivotTable's display or emphasize elements by changing their color with the Fill/Back Color tool of the PivotTable Format toolbar. (The background color of column and row header buttons is much darker under Windows 2000 than Windows XP.) For example, you can remove the gray tint from the Name, Country, and Quarter lists by selecting each field in sequence, clicking the Fill/Back Color tool, and choosing white in the color picker (see Figure 12.16). Alternatively, you can apply a new color scheme to the display. You can increase the contrast of the PivotTable's display or emphasize elements by changing their color with the Fill/Back Color tool of the PivotTable Format toolbar. (The background color of column and row header buttons is much darker under Windows 2000 than Windows XP.) For example, you can remove the gray tint from the Name, Country, and Quarter lists by selecting each field in sequence, clicking the Fill/Back Color tool, and choosing white in the color picker (see Figure 12.16). Alternatively, you can apply a new color scheme to the display.
Figure 12.16. Substituting a white background for the default gray color of the Name, Country, and Quarter fields increases the contrast of the PivotTable, especially under Windows 2000. 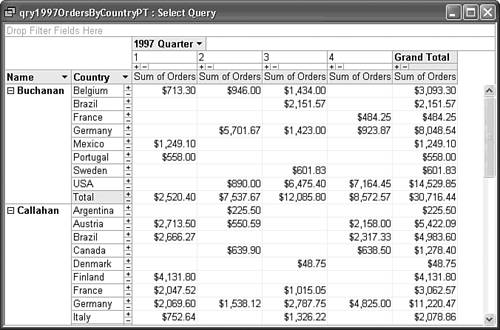 Exchanging PivotTable Axes and Category Hierarchies The term PivotTable derives from the capability to exchange (pivot) the x- (horizontal) and y- (vertical) axes of the table. PivotTables also let you exchange the hierarchy of category columns, which often is more useful than pivoting the table. If you're more interested in sales by country than by employee, drag the sample PivotTable's Country button to the left of the Name button. The All Orders values now represent quarterly sales by country (see Figure 12.17). Figure 12.17. Interchanging the Country and Names fields recalculates the PivotTable to display values for quarterly sales by country. Details are hidden with the Hide Details button in this example. 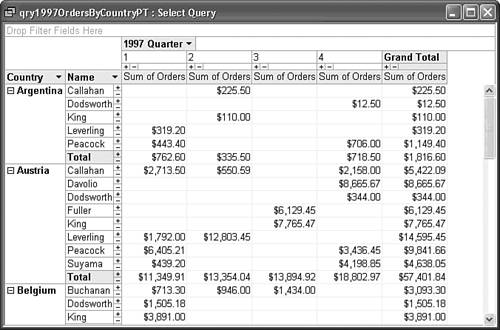 Tip | If you accidentally drag the field out of the PivotTable window, which removes the field from the PivotTable, open the Field List and drag the missing field to the proper location. |
Interchanging the axes lets you view the data from a different perspective. In many cases, users want data presented in a familiar format. For example, the sales manager might be accustomed to comparing the quarter-by-quarter performance of his or her salespeople with quarterly data in rows, not columns. To exchange the Name and 1997 Quarter axes, drag the Name button to its original position (left of the Country button), drag the 1997 Quarter button to the left of the Name button, and then drag the Name button to the empty Column Fields drop zone. Optionally, drag the Country field to the Filter Fields drop zone (see Figure 12.18). Figure 12.18. Rotating the axes of a PivotTable lets you conform data presentation to users' preference. In this example, the Employees field includes only the first six employees in the filter list.  |