Using PivotTables to Organize Your Data
3 4
A PivotTable is an interactive table used to analyze data from different perspectives in tabular form (rows and columns)—an example would be grouping sales data by region, salesperson, and product, a process which is sometimes called "slicing and dicing" your data. PivotTables are ideal for analyzing data from various points of view. A PivotTable presents data in a view that lets users—not just database designers—restructure the data and perform calculations on it. For example, you could examine total sales by salesperson and month or examine the number of items in a particular category sold by salespeople in a specific country from the same PivotTable, without switching to Design view for modifications.
Data displayed in a PivotTable can be analyzed and summarized from different perspectives and at different levels of detail, including cross-tabulation, such as is done in a crosstab query. But unlike a crosstab query, it’s easy to swap the position of row and column headings in PivotTable view. The following sections explain the tools and procedures you use to create PivotTables.
note
PivotTable view is especially useful for forms, because forms (if designed appropriately) give you more flexibility in switching among views. For example, you could design a form that displays equally well in Form view, PivotTable view, and PivotChart view.
Understanding PivotTables
PivotTables consist of several elements that are used to analyze the data they display in various ways. The most important of these are the row fields (which create the rows of data), the column fields (used to create column headings), and the data fields (which provide the data for the PivotTable). Figure 12-1 shows a typical PivotTable.
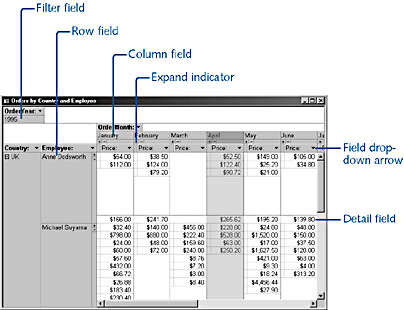
Figure 12-1. A PivotTable lets you select fields for row and column headings and data.
The following list describes these PivotTable elements in more detail:
Field A field corresponds to a column of data; a PivotTable field can summarize multiple rows of a data source such as a table or a query—for example, a salesperson’s results for a specific month. A PivotTable has row fields, column fields, data fields, and (optionally) filter fields.
Item An item is a unique value in a field, such as the price of a computer sold by a specific salesperson on a specific date. The cell in the PivotTable where a row and a column intersect generally summarizes the item data for that row and column—for example, summing the sales for a specific computer model by a salesperson on a specific date. If a more detailed level of data is available, it can be displayed by clicking the Expand indicator (+). This PivotTable feature lets users switch between summarized and detailed data whenever they want.
Row field A row field is a field placed in the row area (the left side of a PivotTable). There can be two row fields, an inner row field and an outer row field, representing two levels of grouping, similar to report grouping. (For more information about report grouping, see Chapter 7, "Using Reports to Print Data.") The PivotTable shown in Figure 12-1 has two row fields, the outer one for Country and the inner one for Employee.
Column field A column field is a field placed in the column area (the area across the top of a PivotTable, above the data fields). There can be several columns of summarized data for each column field—for example, Price and Profit columns. The PivotTable shown in Figure 12-1 uses the OrderMonth field for the column field.
Filter field A filter field is a field placed in the filter area (the upper left corner of the PivotTable). Filter fields are used to filter the data displayed in the PivotTable. For example, the PivotTable shown in Figure 12-1 uses the value 1995 from the OrderYear field to display just the 1995 data.
Data field A data field (a field in the data area) contains summarized data from the PivotTable’s data source. Data fields usually summarize numeric data using the Sum function, but data can also be summarized using theCount function—in which case, the detail items are counted. In the PivotTable shown in Figure 12-1, the data is derived from the Price field.
Data area The data area of a PivotTable displays the data fields, usually in summarized form, such as a sum of currency values or a count of employees.
Detail field A detail field displays all the rows from the data source. These are the detail items that are summarized in the data area.
Field drop-down arrow Clicking the arrow to the right of a field displays a drop-down list from which you can select items to display or hide, enabling you to further filter the data.
Drop Zones and Areas
In this chapter, you’ll see references to row, column, and data drop zones and also to row, column, and data areas. Drop zones are interactive elements of a PivotTable or PivotChart—dropping a field onto a drop zone tells Access where the data for the corresponding area of the PivotTable or PivotChart comes from. Even when drop zones are turned off (say, in a PivotTable designed to be displayed on a projector), the PivotTable or PivotChart will still have row, column, and data areas.
Exploring the PivotTable Toolbar
PivotTables have their own toolbar, shown in Figure 12-2.
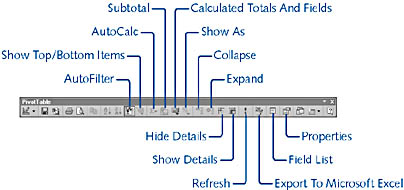
Figure 12-2. The PivotTable toolbar provides special tools for working with PivotTables.
tip
If the PivotTable toolbar isn’t visible, right-click the gray background of any open toolbar and choose PivotTable on the shortcut menu, or choose View, Toolbars and select PivotTable.
Some of these buttons are probably familiar to you from working with forms and reports. The specialized PivotTable tools are described here:

- AutoFilter. Filters fields by selected data items.

- Show Top/Bottom Items. Displays only the specified number of top or bottom items in a group, much like a Top Values query.

- AutoCalc. Lets you quickly apply a summary function for column subtotals. (Sum, Count, Min, Max, and Average are the most widely used functions.)

- Subtotal. Adds row subtotals.

- Calculated Totals And Fields. Lets you add an expression to calculate data.

- Show As. Offers a choice of displaying detail values as a variety of percentages.

- Collapse. Collapses the inner row fields so that only the outer row fields are visible. (Applies only when the PivotTable contains two row fields.)

- Expand. Expands the inner row fields so that both the outer and inner row fields are visible. (Applies only when the PivotTable contains two row fields.)

- Hide Details. Hides the detail items. Only the summary results show.

- Show Details. Shows the detail items.

- Refresh. Refreshes the PivotTable with any changes to the underlying data source.

- Export To Microsoft Excel. Exports the PivotTable to Excel.

- Field List. Hides or displays the field list.

- Properties. Opens the PivotTable properties sheet, which provides a number of settings (some of which aren’t available elsewhere) for modifying elements of PivotTables.
PivotTables and PivotCharts can also be displayed on the Web as data access pages and can be viewed and manipulated by users who have the Microsoft Office Web Components installed. See Chapter 18, "Working with Data Access Pages," for more details about using PivotTables and PivotCharts in data access pages.
Creating a Query to Gather PivotTable Data
Like a crosstab query, a PivotTable query needs enough data fields to provide row data (such as employee names or regions), column heading data (such as dates), and of course the data to be summarized in the body of the PivotTable, usually either summed numeric data or counted textual data. If you have the fields you need in the form’s record source, you can proceed to set up the PivotTable by dragging fields to the designated portions of the PivotTable.
See Chapter 9, "Using Queries to Select Data," for more information about crosstab queries; see the section "Choosing Fields for the PivotTable," for more details on adding fields to a PivotTable.
It’s rare for a single table to contain all the fields needed for a PivotTable, however. Generally, a PivotTable requires fields from several linked tables. If your form doesn’t have all the fields you need to create row headings, column headings, and data, you’ll need to first prepare a query containing the data fields you want to work with and then create a new form designed for use in PivotTable view. The PivotTable Wizard (or the AutoForm: PivotTable selection in the New Form dialog box) helps you create such a form, once you’ve created your query.
A minimum table or query for a data source would contain three fields—say, Customer, OrderDate, and OrderAmount. The Customer field would be the most likely choice for row values and OrderDate the most likely choice for column values, although the two could be swapped. OrderAmount (probably summed) would be the field to use for the values in the PivotTable data area.

Figure 12-3 shows a query based on several tables from the Northwind database (renamed with the tbl tag), with calculated fields for the price of each order detail item and the employee name. (You’ll find this query saved as qryOrders in the Test Access 2002 sample database on the companion CD.) This query has enough fields in it to allow a variety of PivotTable arrangements, so users can analyze data by company, employee, price, month, and year.
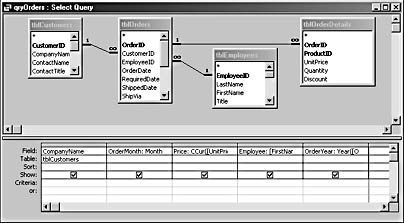
Figure 12-3. A query with several linked tables has plenty of data for a PivotTable.
note
Although you can create calculated fields in a PivotTable, it’s much easier to create them using the Expression Builder in a query column. See Chapter 4, "Creating a Database," for more details on using the Expression Builder.
This query uses typical formatting expressions in several columns to preprocess data for the PivotTable. Instead of using the OrderDate field directly, date formatting functions are used in two column expressions to create columns with years or months as values. The following expression yields month names to be used as column headings:
OrderMonth: MonthName(Month([OrderDate]))
The following expression is used to extract year values from OrderDate. This field is useful for filtering the PivotTable.
Year([OrderDate])
A Price column is created by performing calculations on several other fields, as shown here:
Price: CCur([UnitPrice ]*[Quantity]*IIf([Discount]>0,[Discount],1))
And last, an Employee column concatenates the FirstName and LastName fields, as shown here:
Employee: [FirstName] & " " & [LastName]
The finished query displays only the fields you need in the PivotTable.
EAN: 2147483647
Pages: 172