Understanding Report Features and Properties
3 4
As you’ve seen, reports share many of the same properties as forms. In this section, we’ll look at a few useful properties unique to reports. You can use report properties to control the way headers and footers are displayed, for example, or to establish report groups, sort report data, choose the column format for report sections, and determine whether you want repetitive data to be hidden or displayed. To get help for any report property, place your insertion point in the property box on the report’s properties sheet and press F1 to open context-specific Help.
Report Format Properties
The report format properties that differ from form properties are located on the Format tab of the report properties sheet. These report format properties are described here:
- Page Header, Page Footer. These properties offer you a choice of All Pages, Not With Rpt Hdr, Not With Rpt Ftr, and Not With Rpt Hdr/Ftr. Choose the appropriate setting to prevent the page header (or footer) from being printed on the same page as the report header (or footer).
- Grp Keep Together. This property offers you a choice of Per Page or Per Column, allowing you to decide how groups should be kept together.
note
Property names in properties sheets can have spaces, but in VBA code they have no spaces. For example, you will see the Back Color property in a text box’s properties sheet, but in code you’ll reference this property as BackColor.
Sorting and Grouping
Use the Sorting And Grouping dialog box (View, Sorting And Grouping) to set up report groups, sort report data, and adjust various group properties. (See Figure 7-52.)
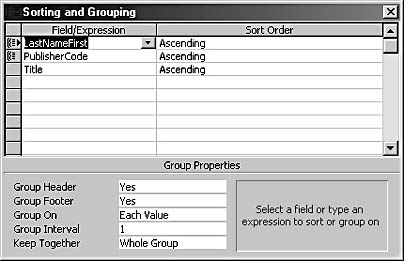
Figure 7-52. You can set group properties by using the Sorting And Grouping dialog box.

The settings shown in Figure 7-52 are for rptBooksByAuthorAndPublisher in the sample Crafts database. There are three group levels, of which LastNameFirst is the top level. The Sort Order column for each group level offers a choice of Ascending (the default) or Descending. Looking at the bottom of the dialog box, you can see the following properties for this group level:
- Group Header is set to Yes so that the group has a group header section.
- Group Footer is set to Yes so that the group has a group footer section.
- Group On is left at the default setting Each Value so that a new group is started with each author.
- Group Interval is set to 1. You can set this property to another value to start a new group for every five records (or whichever number you choose).
- Keep Together is set to Whole Group, to keep the LastNameFirst group from being broken up if there isn’t enough room for the whole group on a page.
The PublisherCode group level has only a group header, not a footer. All the other properties are left at their defaults. The Title group has neither a header nor a footer; all its properties are left at their defaults. The Title field is used only for sorting.
Report Sections
Reports can have up to ten group levels, but generally two or three are sufficient. Each report section has its own properties sheet, with several significant properties on the Format tab. Each report section has a selection of the following properties (along with other properties shared with forms):
- Force New Page. Offers a choice of None, Before Section, After Section, and Before & After Section. Use this property to specify where a page break occurs.
- New Row Or Col Offers a choice of None, Before Section, After Section, and Before & After Section. Use this property to specify where a section break occurs on a multicolumn report.
- Keep Together. Offers a choice of Yes or No, for preventing a page break within the section.
- Visible. Allows you to choose whether the section is visible. Set this property to False in VBA code to hide the section. See "Using Section Events for Conditional Formatting of Data in Reports," for an example.
- Can Grow, Can Shrink. Offer a choice of Yes or No. These properties specify whether the section can grow or shrink to accommodate data in text boxes that have grown or shrunk.
- Repeat Section. Offers a choice of Yes or No. If you set this property to Yes, the header section repeats when the group data is advanced to another page so that every page will have a header.
Troubleshooting - My text boxes don’t display all the text
Sometimes long text in text boxes on a report is cut off. You need to expand the text box so that all text will be printed. Text boxes on Access reports have two handy properties (not available on forms) that can be used to make the controls shrink or expand as needed. Setting the CanGrow property of a text box to Yes allows it to grow in height so as to accommodate all the text in the field; setting the CanShrink property to Yes shrinks the text box vertically to nothing, to prevent a large blank space if a text box has no data.
Report section properties, and the properties of report controls, can be set from VBA code to display or hide information when certain conditions are met, as described in the next two sections. Additionally, you can use the conditional formatting feature of text box controls to set their properties conditionally, as described below in the sidebar "Using Conditional Formatting on a Report Control."
Using Conditional Formatting on a Report Control
As an alternative to writing code for the report’s Format event, you can use the conditional formatting feature to set conditions for formatting a control in the interface. To make a text box bold and yellow if it has the value 0, follow these steps:
- Create a report with a text box that you want to format differently in some circumstances. (I created a simple report, based on the tblProducts table in the Northwind sample database, that contains only the ProductName, UnitPrice, and UnitsInStock fields.)
- Select the text box to be formatted (in this case, txtUnitsInStock), and then choose Format, Conditional Formatting to open the Conditional Formatting dialog box.
- To make the txtUnitsInStock text box bold and yellow when the value is 0, fill out Condition 1 in the dialog box as shown in Figure 7-53, and click OK to save the condition.
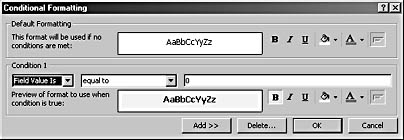
Figure 7-53. Use the Conditional Formatting dialog box to create a condition that changes the color of a text box when its value is 0.
Now the Units In Stock value will be bold and yellow in those rows where it has the value 0.
Conditional formatting works only for controls, not for report sections—to format report sections, you still have to write an event procedure for the Format event.
Using Section Properties to Show or Hide Data
Access report sections have three special events—Format, Print, and Retreat —that are useful if you want to apply conditional formatting to your reports (either to individual controls or to entire sections). The Format event (the most useful of the three) takes place when the report is formatted but before it is printed. The Print event, as you might expect, occurs when the report is printed. The rarely used Retreat event occurs when Access returns to a previous report section during formatting, such as when a page break has to be moved to keep a section on one page.
For example, say you have a color printer and you want to make the value of a control named txtSales stand out when it exceeds $10,000. You can write an event procedure for the report’s detail section to do the formatting. To make the text in that control larger, bold, and bright red against a yellow background—and additionally (if you want to go over the top to congratulate the best salespeople), to make an image of a large gold star (imgGoldStar) become visible beside txtSales—use the following code in the Format event procedure of the report’s detail section:
Private Sub Detail_Format(Cancel As Integer, FormatCount As Integer) If Me![Sales] >= 10000 Then Me![txtSales].FontBold = True Me![txtSales].FontName = "Arial Black" Me![txtSales].FontSize = 12 Me![txtSales].ForeColor = vbRed Me![txtSales].BackColor = vbYellow Me![imgGoldStar].Visible = True Else Me![txtSales].FontBold = False Me![txtSales].FontName = "Arial" Me![txtSales].FontSize = 9 Me![txtSales].ForeColor = vbBlack Me![txtSales].BackColor = vbWhite Me![imgGoldStar].Visible = False End If End Sub
Note that the control properties are explicitly returned to their normal state if the $10,000 condition for txtSales is not met; otherwise, the special properties will carry over from the previous item.
Using Section Events for Conditional Formatting of Data in Reports
You can use the Format event to hide an entire section of a report if it contains no data to print (or some other condition is met). Setting the entire section’s Visible property to False is simpler than setting the CanShrink property to Yes for all the controls (and the section itself), and it allows you to eliminate an entire group of controls from a report if a certain key field is blank, even if some of the controls contain data (something that you can’t do with the CanShrink property).
To make an entire group footer section disappear from the report if the txtSchedule control contains a blank value, use the following code:
Private Sub GroupFooter3_Format(Cancel As Integer, FormatCount As Integer) If Nz(Me![txtSchedule]) <> "" Then Me.Section(acGroupLevel2Footer).Visible = True Else Me.Section(acGroupLevel2Footer).Visible = False End If End Sub
The numeric settings and named constants for referencing various report sections are listed in Table 7-2.
Table 7-2. Section numbers and named constants for referencing report sections
| Setting | Named constant | Description |
| 0 | acDetail | Report detail section |
| 1 | acHeader | Report header section |
| 2 | acFooter | Report footer section |
| 3 | acPageHeader | Report page header section |
| 4 | acPageFooter | Report page footer section |
| 5 | acGroupLevel1Header | Group level 1 report header section |
| 6 | acGroupLevel1Footer | Group level 1 report footer section |
| 7 | acGroupLevel2Header | Group level 2 report header section |
| 8 | acGroupLevel2Footer | Group level 2 report footer section |
If a report has more than two grouping-level sections, they are numbered consecutively beginning with 9.
InsideOut
The section numbers in the report interface don’t match either the numeric settings for sections or the section numbers used in the equivalent named constants for various report sections. When referencing a report section in code, don’t simply copy the number you see in the properties sheet title bar. Look up the section number or named constant in the Object Browser (or open the Section property Help topic from the Section property of the Report object in the Object Browser). Alternatively (for the named constant value only), open the Grouping And Filtering dialog box and count down from the top (starting with 1) to get the correct number for a group header or footer section to use in a named constant such as acGroupLevel2Footer.
Neat Report Tricks
The following sections describe special formatting tricks that use some of the more obscure properties and methods of reports.
Drawing Lines and Circles on Reports
Access has no Circle control type, so if you want to place a circle on a report, you’ll find no obvious way to do so. However, you can create a circle using the old MS-DOS methods, functions, and properties that have been carried over into Access VBA. Be forewarned: These techniques are not easy to use, and they can be excruciatingly slow in operation (less so if you have a fast computer). I won’t go into detail about theMS-DOS print techniques; refer to Access Help topics for the Line and Circle methods for details and some examples of how to use these methods.
The Circle method is the only way to draw a circle, an arc, or an ellipse on an Access report (unless you want to create the shape in Microsoft Paint and place it in an Image control). The following sample code, running from a report’s Page event procedure, draws a red quarter-circle on a report:
Private Sub Report_Page() Me.DrawWidth = 500 Me.Circle (25, 25), 2000, 255 End Sub
Figure 7-54 shows the report with a quarter-circle drawn by the Circle method.

Figure 7-54. You can use the Circle method to draw circles (or parts of circles) on your reports.
You can use another MS-DOS print method to place a border around the entire report page, as in the following code, which also runs from the report’s Page event procedure:
Private Sub Report_Page() Me.Line (1, 1)-(Me.ScaleWidth, Me.ScaleHeight), , B End Sub
Figure 7-55 shows the report with a border.

Figure 7-55. The border on this report was drawn by using the Line method.
Grouping by First Letter
You can use some of the properties in the Sorting And Grouping dialog box to group records by the first letter of a field, such as the Company or LastName field. (This effect is often used in directory-type reports.) The Northwind database has a report named Alphabetical List of Products that uses this feature. To set up first-letter grouping in a report, you need to enter the grouping field twice in the Sorting And Grouping dialog box, as shown in Figure 7-56. The first entry is grouped on Prefix Characters with a Group Interval of 1 (used to create the big letter for grouping). The second entry is grouped on Each Value (the entire field, used for sorting).
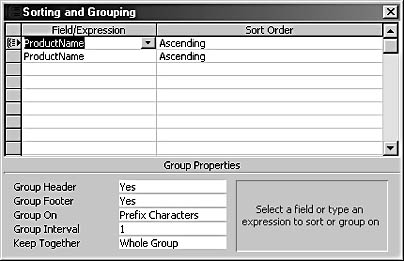
Figure 7-56. You can group a report by prefix characters.
Next, in the report itself you need a text box to display the first letter with the following control source:
=Left([ProductName],1)
Size the text box appropriately to display the single letter in a large font. Figure 7-57 shows a somewhat modified version of the Northwind report.
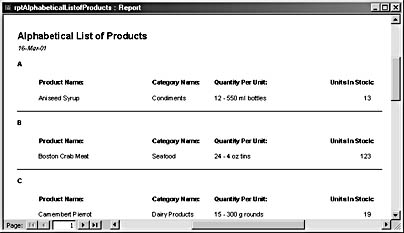
Figure 7-57. This report is grouped by the first letter of the product name.
Alternate-Line Shading
Shading alternating lines on a tabular financial report with many columns of numbers can help you keep track of where you are when you’re reading the report. You can create alternate-line shading in VBA code with the obscure CurrentRecord property and the Mod function. The following code, running from the Format event procedure of a report’s detail section, makes the detail section’s background color white for odd records and light gray for even records:
Private Sub Detail_Format(Cancel As Integer, FormatCount As Integer) Const vbLightGrey = 12632256 If Me.CurrentRecord Mod 2 = 0 Then Me.Section(acDetail).BackColor = vbLightGrey Else Me.Section(acDetail).BackColor = vbWhite End If End Sub
note
The Mod operator (short for modulo, which you might remember from high school math) divides one number by another and returns the remainder. Dividing even numbers by 2 yields 0 as a remainder, and thus the Mod operator is a handy way to distinguish between odd and even numbers, as in the sample code.
Figure 7-58 shows the Goals By Salesperson report with alternate-line shading.
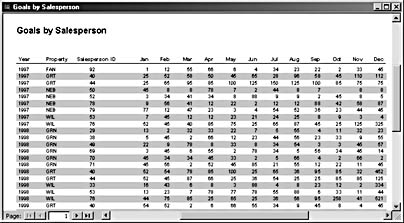
Figure 7-58. Alternate-line shading can make a report easier to read.
Troubleshooting - An #Error error message appears on my report in place of the data
If an #Error error message is printed in place of field data, as shown in Figure 7-59, there are several possible causes. The bound field’s name may have been changed, or the field may have been deleted from the report’s record source table or query.

Figure 7-59. #Error is printed on a report instead of data because of a problem with a control or field name.
Placing Totals on Reports
It is delightfully easy to place subtotals and totals on grouped reports. All you have to do is put a text box under the column of figures you want to add and then use an expression such as the following as the text box’s control source, where Cost is the field you want to sum. (You can use Count instead of Sum to get a count of items.)
=Sum([Cost])
Make sure you reference the field name in the expression, not the control name (the control bound to the Cost field should be named txtCost); otherwise, you might get a reference error. Use the same control source expression in any group footer in which you
want a subtotal and the report footer—the only difference is in the name of the control. The correct group subtotal or report total will be displayed in each section.
To get a row total rather than a column total, use an expression such as the following for a text box placed at the right side of the detail section:
=[Jan] + [Feb] + [Mar] + [Apr] + [May] + [Jun] + [Jul] + [Aug] + [Sep] + [Oct] + [Nov] + [Dec]
Another cause of the #Error problem is that an expression in the ControlSource property references the field name and the text box’s name is the same as the field name, causing a circular reference error. Figure 7-60 shows the properties sheet of a text box control illustrating this problem.

Figure 7-60. When the name of a text box is the same as the name of a field referenced in its ControlSource property, a circular reference error results.
If the control source for the text box is a field, fix the problem by reselecting the bound field to make sure that you have the correct spelling, and (if necessary) give the text box a name that is not the same as the field name. In the LNC naming convention, text boxes have the txt tag.
Using a Form to Filter Report Records
Several methods are available if you want to filter a report by a specific value in a field, but not always the same value. For example, you might want to filter report data by the month of January one time and by the month of March later. One method you can use to filter a report is a parameter pop-up query. Another method is to use a dialog box popped up from the report’s OnOpen event. Both methods are useful, but they have their disadvantages.
For more information about filtering by query, see Chapter 9, "Using Queries to Select Data."
The pop-up parameter boxes aren’t particularly user-friendly, and it’s annoying to have to enter the parameters every time the report runs, especially if you want a report based on thesame parameters for a number of successive printings. The dialog box form is modal, and users might be annoyed to find that they can’t do anything else while the dialog box is open. A dialog box also requires input every time you run the report.
For filtering reports, consider putting a combo box for selecting a value on the main menu of your database, bound to a table named tblInfo that stores miscellaneous information used throughout the database. Reports that need to be filtered by the selected value have a criterion limiting the appropriate field to the value selected on the main menu.
Using a bound combo box to select the filter value means that the selected value is saved to tblInfo and thus doesn’t need to be reselected until you want to filter by a different value. Figure 7-61 shows the cboSpecialty combo box on the main menu of the Crafts database, which is bound to the Specialty field in tblInfo. When the list is opened, both the Speccode and Specdesc fields are displayed. The combo box’s bound column contains the Speccode field, which is used for filtering reports.
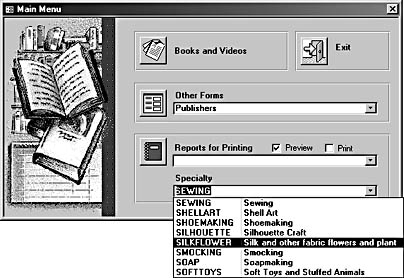
Figure 7-61. Use the cboSpecialty combo box to select a specialty for filtering reports.
Figure 7-62 shows the SQL statement record source for a report filtered by the specialty chosen in cboSpecialty on the main menu.
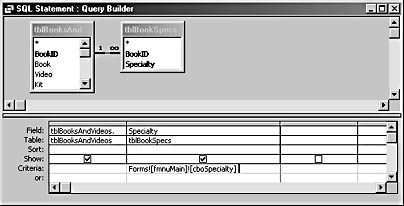
Figure 7-62. This SQL statement filters by a value selected from cboSpecialty.
Exporting Reports Using the Snapshot Utility
One of the selections for exporting a report using File, Export is Snapshot Format (*.snp). Exporting a report to a snapshot (see Figure 7-63) creates a file that you can e-mail or otherwise transfer to another person, who need not have Access as long as she has the Snapshot Viewer. You can download the software from the Microsoft Office download center at http://office.microsoft.com/downloads.
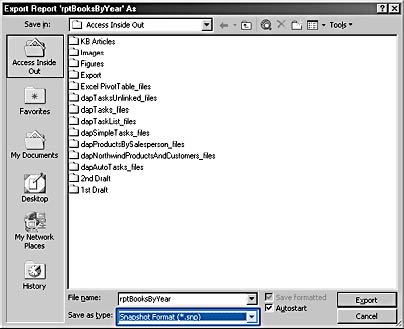
Figure 7-63. You can export a report to snapshot format.
Figure 7-64 shows the report snapshot in the Snapshot Viewer. As you can see, the snapshot looks exactly like the report in print preview.
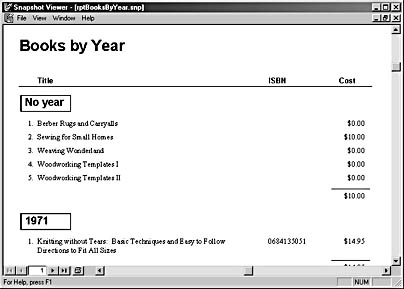
Figure 7-64. A report snapshot opened in the Snapshot Viewer looks just like the original report.
Report snapshots can’t be modified. Depending on your point of view, this is either an excellent security feature or an annoyance.
EAN: 2147483647
Pages: 172