Understanding Linked Versus Unlinked Subreports

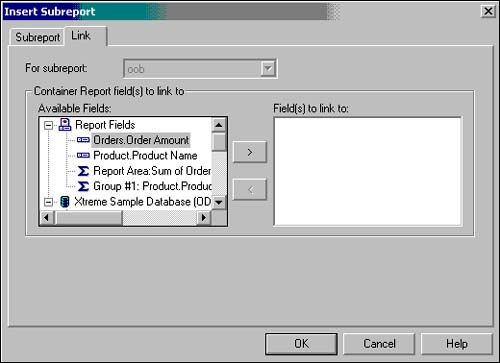
The hypothetical COO scenario just explored highlights an example of an unlinked Subreport. In Crystal Reports terminology, this means that the parent, or main, report did not have any specific data connections (or links) to its related child report (the Subreport). Unlinked Subreports are completely independent from their main reports and do not rely on the main report for any data. Many reporting problems in which multiple views of the same or different data sources are required in a single presentation can be resolved with unlinked Subreports. If a requirement exists to share data between the parent/main report and its Subreport, linked reports provide the answer.

Contrary to unlinked Subreports, linked Subreports are bound (or linked) to the data in their associated main report. The links are defined in the second tab of the Insert Subreport dialog as highlighted in Figure 16.4.

Figure 16.4. Link tab of the Insert Subreport dialog.

graphics/16fig04.jpg

The Link tab enables the linking of report, database, or formula fields in the main report to fields in the Subreport and enables filtering of the Subreport based on the data passed in from the main report.

The Available Fields section of the Links dialog enables the selection of the field from the main report to be linked on. More than one field can be selected for linking. After at least one field has been selected, a separate Field Links section will appear at the bottom of the Links tab. For each linked field, a parameter in the involved Subreport must be selected to receive and hold that information. These parameters can be existing parameters predefined in the Subreport, or they can be a parameter that is automatically created for each field you have selected to link. (These will be automatically created in the Subreport with the prefix '?Pm-'.)

Finally, for each linked field from the main report, a data filter can be created in the Subreport based on that parameter. This is accomplished by checking the Select Data in Subreport Based on Field check box and selecting the report field, database field, or formula field in the Subreport that you want to have filtered based on the linked parameter from the provided drop-down box. In effect, checking this box will create a selection filter in your Subreport that is based on the selected filter field and the selected parameter field.

graphics/lightbulb_icon.gif

The capability to link Subreports and main reports with formulas provides a flexible method of presenting data from different database tables that is not possible otherwise. The Crystal Reports Database Linking Expert only allows joining of fields from different tables and does not permit joining formulas to fields. By using formulas and Subreports, a derived formula can now be linked to another database field in a Subreport.

An example of where this would be beneficial is if a firm's Order Processing system (for example, SAP) stored a customer ID as a nine-digit number (for example, 999123888), but that same company's Customer Relationship Management (CRM) system (for example, Siebel) stored the same customer ID as a nine-digit number prefixed with a regional code (for example, ONT999123888). These fields could not be joined in the Crystal Reports Database Linking Expert, but they could be linked using a Formula that extracts the nine-digit number from the CRM/Siebel Customer ID and links to the SAP Customer ID in a Subreport.


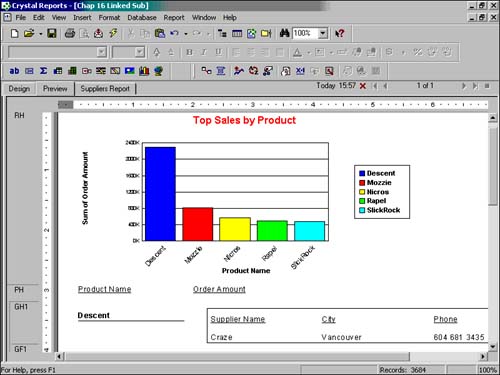
To explore a reporting solution with linked Subreports, let's solve the hypothetical reporting problem faced by the same COO of Maple Leaf Bikes Corporation. The COO now wants a single report that highlights the company's top-selling products in one bar chart (as before), but now wants a list of suppliers for those top-selling products to be available for review essentially, a Subreport linked to the main report based on the Supplier ID of the top-selling products. To accomplish this, follow these steps:

  1. Open the previous sample report from this hour and delete the previous Subreport containing the Top 5 Sales Rep pie chart.

  2. Bring up the Insert Subreport Dialog and create another new Subreport called Supplier Info using the provided Subreport Report Wizard. Connect this new Subreport to the Xtreme sample database, select the Supplier table, and add the Supplier Name, City, and Phone Number fields to the report. Finally, click on the Report Wizard Finish button, but do not exit the Insert Subreport dialog.

  3. Click on the Link tab in the Insert Subreport dialog. Now, select the Supplier ID field from the Available Fields list as the Field to link on (It can be selected from the Product Table). This will initiate the Supplier ID Link section at the bottom of the dialog. Use the default (and automatically generated) parameter '?Pm-Product.Supplier ID' for the link on the Subreport.

  4. Ensure that the Select Data in Subreport Field Based On check box is selected and that the Supplier.Supplier ID field is selected in the drop-down box. Click OK to add the Subreport and place it in the Group Header (based on product) on the right side of the report.

  5. Edit the Subreport to remove the default provided date and re-size the bar chart graphic on the main report. You will have a new sample report for the COO resembling the report depicted in Figure 16.5. Congratulations!

    Figure 16.5. Sample Report with Linked Suppliers Subreport.

    graphics/16fig05.jpg

The COO can now make an informed analysis on whether his firm has too much reliance on a small number of suppliers or not, and you have learned some of the benefits of a linked Subreport.

graphics/bookpencil_icon.gif

You should notice that unlike the initial sample report presented in this hour where we placed the Top Sales Rep Subreport in the Report Header and it ran once for the entire main report, the Product Suppliers Subreport is run multiple times in fact, once for every product. This is the case because the Subreport was placed in the Group Header of the main report, and it will therefore be executed for every different group in the main report. This is important to note with respect to performance and specifically when your databases and reports become large.


Sams Teach Yourself Crystal Reports 9 in 24 Hours
ISBN: B003D7JUVW
EAN: N/A
Year: 2005
Pages: 230

flylib.com © 2008-2017.
If you may any questions please contact us: flylib@qtcs.net