Foundation and Supplemental Topics
CiscoWorks 2000CiscoWorks 2000 is the heart of the Cisco family of comprehensive network management tools that allow you to easily access and manage the advanced capabilities of the Cisco Architecture for Voice, Video, and Integrated Data (AVVID). It provides the foundation that Intrusion Detection System Management Center (IDS MC) is built upon. IDS MC is a component of the CiscoWorks VMS bundle. Before you can access the IDS MC application, you must first log in to CiscoWorks 2000. CiscoWorks 2000 also manages access to all of the applications in the VMS bundle. To use IDS MC, you need to understand the following CiscoWorks 2000 components:
Login ProcessTo access the applications supported by CiscoWorks, such as IDS MC and the Security Monitor, you must first log in to the CiscoWorks server desktop. The CiscoWorks server desktop is the interface used for CiscoWorks network management applications such as IDS MC. To log in to CiscoWorks, you connect to the CiscoWorks desktop via your web browser. The web server is listening on port 1741. Therefore, if your CiscoWorks desktop is on a machine named CW2000 with an IP address of 10.89.139.71, you could connect to it by entering either of the following URLs:
Note If you are on the CiscoWorks server, you can also access CiscoWorks through the localhost host address by using the following URL: http://127.0.0.1:1741/ Note If you configure CiscoWorks to Secure HTTP (HTTPS), you access the CiscoWorks server by using port 1742. For HTTPS access, the example URLs become the following:
At the initial CiscoWorks screen, you log in to CiscoWorks by entering a valid username and password (see Figure 10-1). Figure 10-1. CiscoWorks Login Screen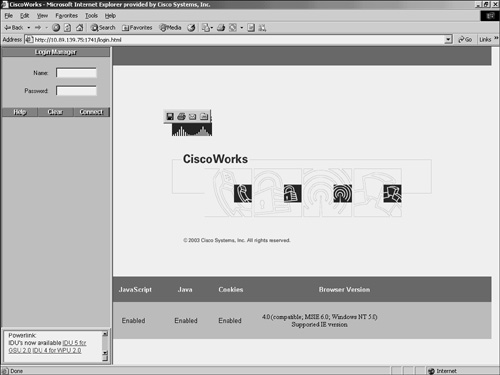 Note Initially, you can log in by using the administrator account created during installation. The default value is admin for both the username and the password (unless you changed these values during the installation process). For security reasons, you should change these values. Authorization RolesLike IDM, CiscoWorks enables you to define different roles for different users. These roles enable the user to perform specific operations when using CiscoWorks and any of the applications that are built upon CiscoWorks (like IDS MC and Security Monitor). CiscoWorks supports five user roles that are relevant to IDS MC and Security Monitor operations (see in Table 10-2).
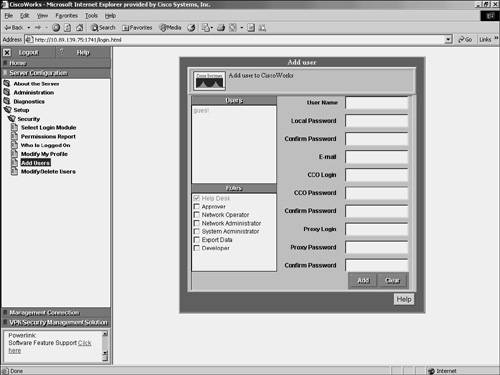
Note You can assign each user multiple authorization roles (depending on their responsibilities). CiscoWorks 2000 also supports two other roles: Export Data and Developer. These roles are not relevant to the IDS MC or Security Monitor operations. Adding UsersAs part of your IDS MC and Security Monitor configuration, you need to configure accounts for the various users who need to access these applications. The CiscoWorks 2000 Add User screen enables you to create new accounts that have access to the CiscoWorks 2000 applications. To create a new account in CiscoWorks 2000, perform the following steps:
Security MonitorSecurity Monitor is a component of the CiscoWorks VMS product. VMS integrates into a single solution numerous security applications, such as the following:
Security Monitor provides numerous features such as the following:
Using Security Monitor, you can monitor IPS/IDS events from up to 300 Cisco IPS-capable devices, such as the following:
Using a compatible web browser, you can access the Security Monitor to administer and monitor the alerts from your IDS devices. Furthermore, you can easily use an extensive list of common reports to support your reporting requirements. Installing Security MonitorYou can install Security Monitor on the following two platforms:
For more information on the Solaris requirements, refer to Cisco documentation. Windows InstallationWhen installing Security Monitor, you need to understand the hardware and software requirements for the different components. The major components involved in a Security Monitor Windows installation are as follows:
Since the sensors are appliances, the software and hardware are fairly fixed. The other two components, however, are built on your own machines. To ensure an operable installation, these systems must match some minimum requirements. Server RequirementsTo support all of the functionality provided by Security Monitor and the underlying CiscoWorks 2000 foundation, your CiscoWorks 2000 server needs to match the following requirements:
Client RequirementsYour users access Security Monitor via a browser on their system. These user systems should meet certain minimum requirements to ensure successful system operation. Your client systems should meet the following requirements:
In addition to meeting these requirements, your clients need to be running one of the following operating systems:
One final requirement is that your client systems need to use one of the following web browsers and have the Java plug-in version 1.41_02:
Security Monitor User InterfaceAlthough the Security Monitor user interface is graphical and easy to use, it is helpful to understand how the interface is structured. The Security Monitor user interface is composed of the following major sections (see Figure 10-3):
Figure 10-3. Security User Interface Configuration TabsThe configuration tasks are divided into the following five major categories:
To access one of the categories, click on the tab labeled with the appropriate name. These tabs are located across the top of the Security Monitor display. Options BarAfter you click on one of the major configuration tabs, the options for that selection are displayed in a list located on the screen just below the configuration tabs. Figure 10-3 shows a screen in which the user has clicked on the Admin tab. The options associated with the Admin tab are as follows:
Clicking on any of these options causes a menu of available choices to be displayed on the left side of the Security Monitor interface (known as the TOC). TOCThe TOC is a menu of choices that is displayed down the left side of the Security Monitor interface. It represents the list of suboptions that you can select (based on the option chosen). In Figure 10-3, you can see that the Admin > System Configuration option provides the following selections:
Path BarThe path bar provides a visual road map indicating where you are with respect to the Security Monitor interface. It is located above the TOC and below the options bar and begins with the text "You Are Here." Figure 10-3 shows a situation in which the path bar's value is Admin > System Configuration > SYSLOG Settings. This indicates that you performed the following steps to reach the current screen:
Instruction BoxSome pages provide you with an instructions box on the right side of the Security Monitor display. This box (when displayed) provides you with a brief overview of the page you have selected. This information is a quick summary of information provided through the Help option on the tools bar. Content AreaThe content area displays information associated with the selection you click on the TOC menu. Sometimes the option selected from the options bar has no TOC options. In this situation, you can click on the option from the options bar to directly display information in the content area. An example of this is Configuration > Event Rules. Tools BarThe tools bar is located at the upper right of the Security Monitor interface. From the tools bar you can access the following items:
Close enables you to close the Security Monitor program. The Help option displays Security Monitor's help information in a separate browser window. Finally, the About option displays the Security Monitor software version. Security Monitor ConfigurationBefore you can use Security Monitor to analyze the events from your IPS devices, you must add the IPS devices to Security Monitor. You can configure the rules that Security Monitor uses to access events from the devices being monitored. For Remote Data Exchange Protocol (RDEP) devices, you can also monitor connection and statistical information. This section will focus on the following Security Monitor configuration operations:
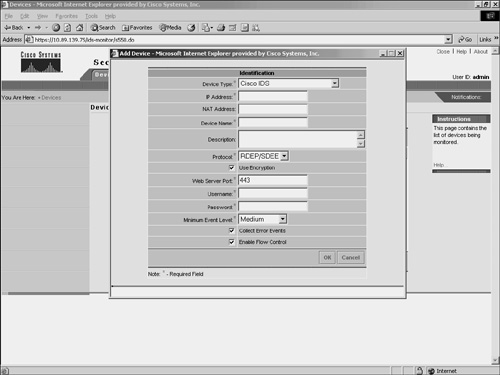
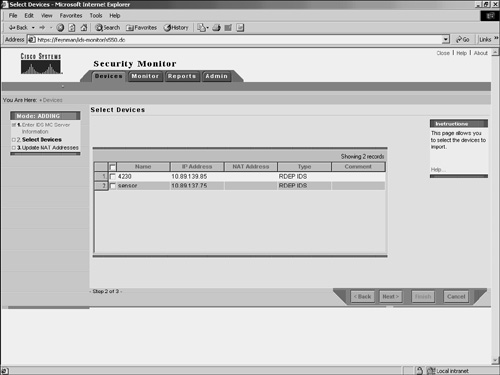
Adding DevicesSecurity Monitor enables you to view events from various Cisco IPS devices deployed throughout your network. Before you can monitor these devices, however, you must add them to Security Monitor. The Devices window (see Figure 10-4) shows you the devices that you have already added to Security Monitor and enables you to add or import new devices as well as perform the following operations on existing devices:
Figure 10-4. Devices Window in Security Monitor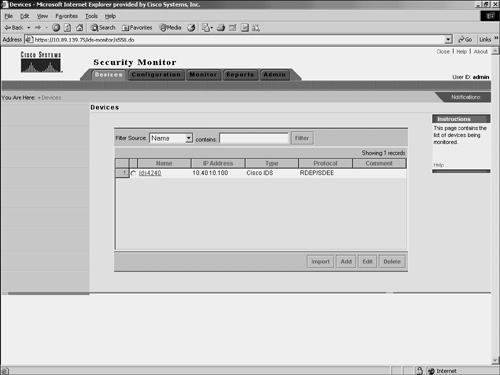 Security Monitor monitors the following types of devices:
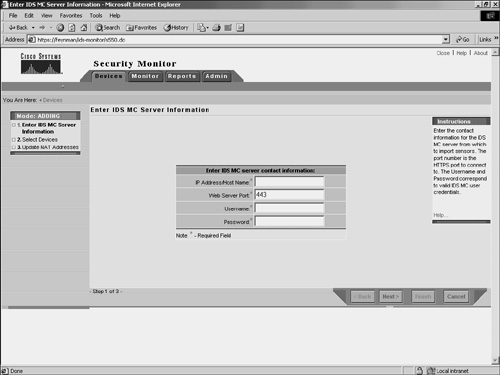
Adding RDEP DevicesSecurity Monitor uses RDEP to communicate with your Cisco IPS version 5.0 sensors. When adding an RDEP device to Security Monitor, you must specify the following information about the device:
The IP Address, Device Name, and Web Server Port fields identify the device so that Security Monitor can communicate it. The Username and Password fields provide the login credentials necessary to access the RDEP device. Finally, the Minimum Event Level field sets the minimum alert level for the events that Security Monitor will retrieve from the device. By default, only events of medium severity or higher are retrieved. To add an RDEP device to Security Monitor, you need to perform the following steps:
Adding PostOffice DevicesSecurity Monitor can receive events from Cisco IDS version 3.x sensors. You can add these devices by selecting Postoffice as the protocol. When adding a version 3.x sensor, you must specify the following fields (see Figure 10-6):
Figure 10-6. Adding a PostOffice Device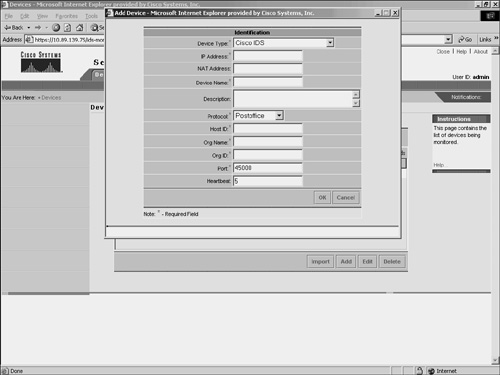 Note The PostOffice protocol is a proprietary protocol used to communicate with Cisco IDS version 3.x sensors. This protocol should not be confused with the Post Office Protocol (POP) specified in RFC 1939 (http://www.faqs.org/rfcs/rfc1939.html), which is a mail-distribution protocol. Adding IOS DevicesBesides receiving events from Cisco IPS sensors, Security Monitor can also receive events from other Cisco IDS devices (such as IOS routers and PIX Firewalls). You can add IOS devices by selecting IOS IDS/IPS in the Device Type field. When adding an IOS IDS device, you must specify the following fields:
Some IOS devices can run the PostOffice protocol. If you want Security Monitor to communicate with the IOS device using PostOffice, you need to select Postoffice in the Protocol field. This will enable you to enter the following PostOffice parameters:
Adding PIX DevicesSimilar to IOS IDS devices, Security Monitor can be configured to receive events from PIX Firewalls. You must specify the following fields to add PIX Firewall devices.
Since the PIX Firewalls can communicate only via syslog (UDP port 514), you are not allowed to specify the protocol for PIX devices. Importing DevicesInstead of adding new devices by specifying all of the information necessary for Security Monitor to communicate with them, you can import devices from an instance of IDS MC that is already monitoring the devices that you wish to add. To import a device from IDS MC into Security Monitor, perform the following steps:
Event NotificationWhen multiple security devices are deployed throughout your network, they can generate a large number of events. Analyzing every one of these events by using the Event Viewer can be very time-consuming. Furthermore, it may be impossible to monitor the Event Viewer 24 hours a day. You can define event rules that perform specific actions when the Security Monitor receives traffic matching specific properties. You could use this functionality, for instance, to cause Security Monitor to e-mail you when certain traffic is detected on your network. When defining an event rule, you can identify traffic based on the alert characteristics shown in Table 10-4.
For each characteristic, you specify a value and one of the following operators to equate the characteristic to the value:
Note Not all of these operators are valid for each characteristic. For some of the characteristics (such as Originating Device), only "equal" and "not equal" are valid. Each characteristic plus a value is known as a clause. You combine multiple clauses for a single rule by specifying one of the following Boolean operators:
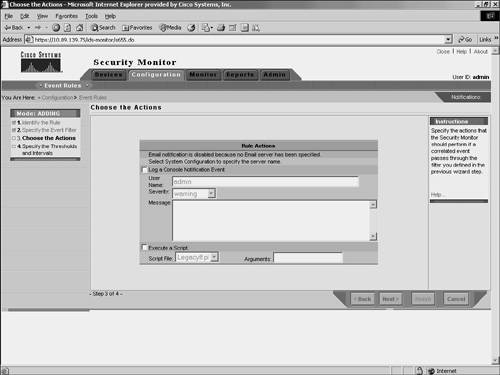
After entering your clauses that define which traffic the event rule applies to, you need to define the action that you want Security Monitor to perform for traffic that actually matches the rule. Each rule can perform one or more of the following actions:
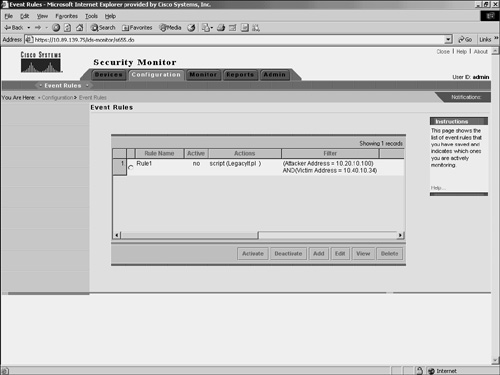
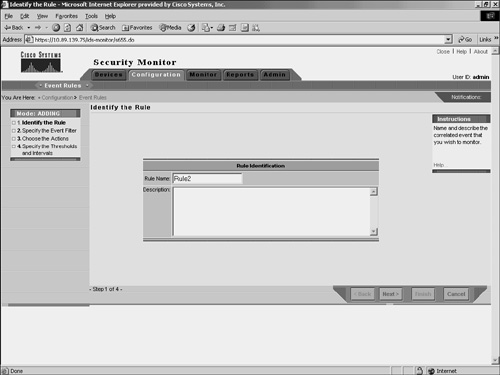
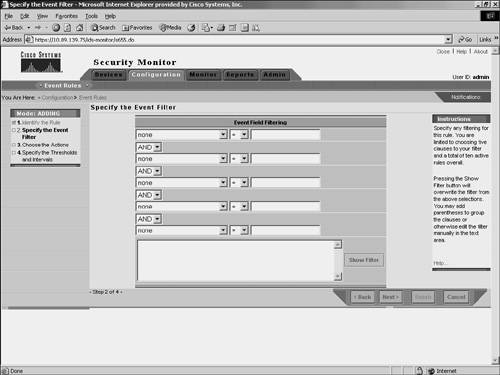
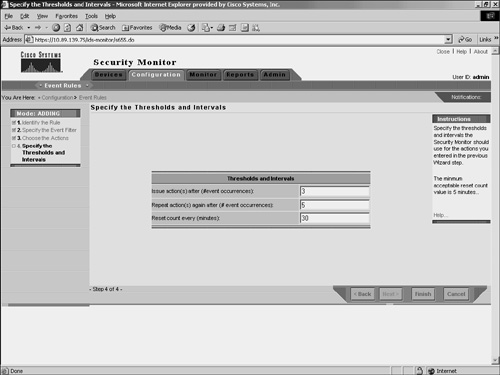
Note Each event rule you define can have up to five clauses. Furthermore, you can define up to 10 event rules that you can have active at one time. Adding Event RulesEvent rules specify the criteria that an event must match in order to cause a specific action. When adding event rules, you need to perform the following four tasks:
Complete the following steps to add an event rule:
Activating Event RulesAfter defining an event rule, you must activate it by performing the following steps:
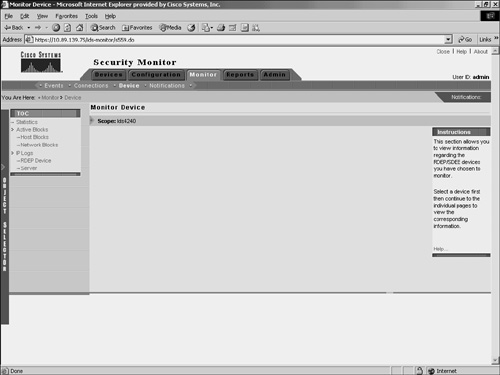
Note You can deactivate event rules by following this same procedure but clicking on the Deactivate button instead of the Activate button. Monitoring DevicesYou can monitor information about the devices that you have added to Security Monitor. This information falls into the following three categories:
Monitoring ConnectionsSecurity Monitor needs to communicate with all of the devices from which it receives information. With RDEP devices, Security Monitor actually connects to the sensor and retrieves the alerts. PostOffice devices send the information directly to Security Monitor. You can check the status of RDEP and PostOffice devices by using the Connections window. (See Figure 10-14.) Figure 10-14. The Connections Window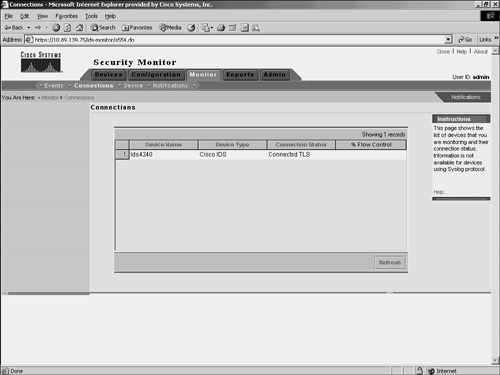 If the Connection status is either "Connected" or "Connected TLS," Security Monitor is receiving events from the device correctly. A Connection status of "Not Connected" represents a problem and can indicate one of the following conditions:
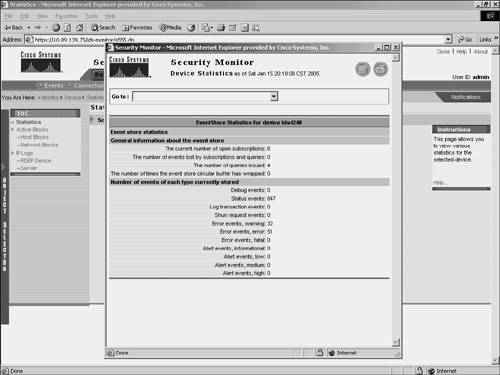
Note IOS IDS devices (those not using PostOffice or RDEP) and PIX Firewalls do not show up in the connection list, since they send information to the Security Monitor in a connectionless fashion by using syslog messages. Monitoring StatisticsYou can view a wealth of statistical information about your RDEP devices. Using the Statistics window (see Figure 10-15), you can view statistics about the following items:
Figure 10-15. Statistics Window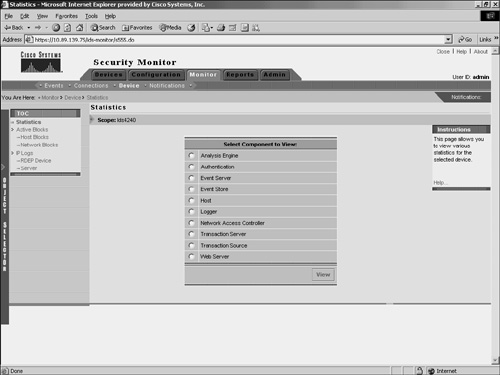 To view any of these statistics, follow these steps:
Note You can view multiple statistical reports (one at a time) since each of the reports is displayed in a new browser window. These reports are a snapshot of the information from the device and are not updated. To get updated information, you must generate another report. Monitoring EventsFinally, you can monitor the events that Security Monitor is receiving from all of the monitored devices. This is probably the most important feature of Security Monitor since it enables you to identify attacks against your network. You view the events that Security Monitor has collected through the Security Monitor Event Viewer, which is accessed by choosing Monitor > Events. Before the event viewer is launched, you need to specify the criteria on which events should be included in the display (see Figure 10-18). Figure 10-18. Launch Event Viewer Window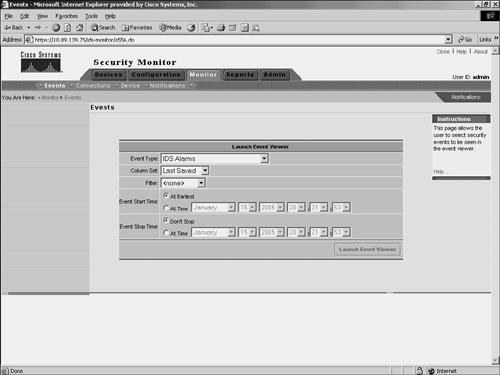 You basically specify a time window and event type for the information that you want included in the Event Viewer display by configuring the following parameters:
You can specify numerous options for the Event Type field by using the Event Type pull-down menu. Some of the options that you can choose from are as follows:
The Column Set parameter determines the column set that will be used when the Event Viewer is launched. The default is Last Saved so that the Event Viewer columns appear the same as the last configuration that you saved. Any events in the Security Monitor database that match the specified criteria will be displayed in the Event Viewer display. By default, the Event Type is set to All IDS Alarms, the Event Start Time is set to At Earliest, and the Event End Time is set to Don't Stop. These values cause all of the available IDS alarm events to be displayed. Security Monitor Event ViewerThe Event Viewer combines the functionality of a spreadsheet with that of a hierarchical, drilldown directory to create a collection of event records called a drillsheet (drilldown spreadsheet). The drillsheet displays groups of similar event records on a single row of the grid, enabling you to detect patterns in the data. The Event Viewer contains a grid plane that organizes and displays event records. The Event Viewer can read and display both real-time and historical events from the Security Monitor database. You can configure the grid plane to display information about alerts detected by the monitored devices in a variety of ways, thereby customizing the interface to your requirements. Configuring the Event Viewer involves understanding the following options:
Moving ColumnsThe default order of fields within an alarm entry may not suit your operational environment. You can change the order in which the columns are displayed in the Event Viewer. To move a column, click and drag the column header of the column to the new position where you want it to be. Note This change will persist only if you save the changes by choosing Columns > Save Column Set. Deleting Rows and ColumnsWhen an alarm has been acknowledged, dealt with, or both, you may want to remove it from the Event Viewer grid or from the actual Security Monitor database. At other times, you may want to remove certain columns from the Event Viewer display to make the display easier to work with. You can delete both rows and columns from the Event Viewer display. You access the delete options by right-clicking on a specific alert entry to display a popup window with various options. (See Figure 10-19.) Figure 10-19. Row and Column Deletion Options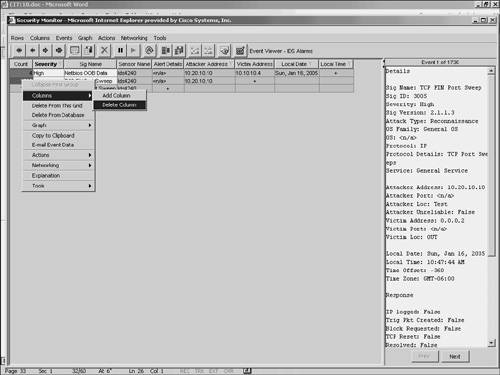 You have three deletion options to choose from:
Delete from This GridTo remove a row from the Event Viewer display, you right-click on a field in the row to be deleted. Then you select Delete From This Grid to delete the selected alert from the Event Viewer where the action is being performed. This procedure will not delete alerts from other Event Viewer instances or the Security Monitor database. Note This change is not persistent. If you open another instance of the Event Viewer, the original rows will be restored. Delete from DatabaseTo remove a row from the Security Monitor database, you right-click on a field in the row to be deleted. Then you select Delete From Database to delete the selected alert from all of the open Event Viewers as well as the Security Monitor database. If you use this option, the alert is completely gone, and you cannot display it in the Event Viewer again, even if you open another Event Viewer instance. Delete ColumnTo remove columns from the Event Viewer display, you first right-click on a field in the column that you want to delete. Then select Columns > Delete Column from the popup window to remove the selected column from the Event Viewer display. Note This change is persistent only if you save the changes by choosing Columns > Save Column Set. Collapsing RowsTo reduce the number of lines displayed on the Event Viewer grid, multiple alarms are collapsed into a single row based on a specific number of fields (known as the expansion boundary). By default, the expansion boundary is only the first field. All alarm entries with the same value for the first field are consolidated into a single row on the Event Viewer display. To examine specific alarms, you may expand the display so that only a few alarms are consolidated on each row in the Event Viewer display. Although this is helpful when you are analyzing a specific attack, the Event Viewer grid can quickly become cluttered with more alarms than you can manage. When your Event Viewer display is too cluttered, you can collapse the display so that multiple alarms are consolidated onto a single line. From the Rows pull-down menu, you have the following collapse options to consolidate rows in the Event Viewer:
Note Besides using the Rows pull-down menu, you can also collapse columns by using the arrow icons pointing to the left (see Figure 10-20). The single left arrow icon performs the same operation as Collapse > First Group, and the double left arrow icon performs the same operation as Collapse > All Rows. Figure 10-20. Event Viewer Window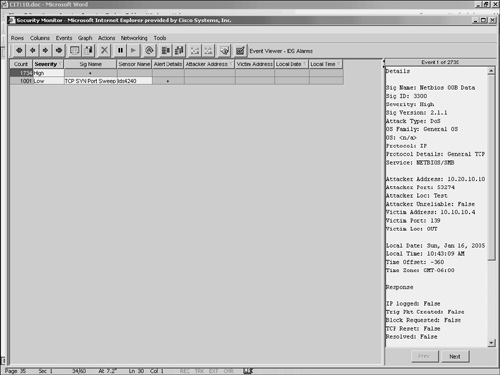 Collapse > First GroupUsing the Collapse > First Group option from the Rows pull-down menu, you can quickly collapse a selected row to the first row that causes some consolidation (a reduction in the number of lines displayed in the Event Viewer). Note Collapsed rows are not a persistent change. This means that closing the Event Viewer and re-opening it will bring back the default settings and expansion boundary. Collapse > All RowsThe Collapse > All Rows option from the Rows pull-down menu enables you to consolidate all of the alarm entries based on the first column in the Event Viewer display. Using this feature, you can quickly collapse all of the rows without having to collapse them one group at a time. Note Collapsed rows are not a persistent change. This means that closing the Event Viewer and re-opening it will bring back the default settings and expansion boundary. Expanding RowsBesides collapsing the entries on the display, you may frequently need to expand the amount of alarm detail shown on the Event Viewer grid. Expanding columns provides more information and causes more rows to be displayed in the Event Viewer. When expanding columns, you have the following two options from the Rows pull-down menu:
Note Besides using the Rows pull-down menu, you can also expand columns by using the arrow icons pointing to the right (see Figure 10-20). Clicking on the single right-arrow icon performs the same operation as choosing Expand > First Group, and clicking on the double right-arrow icon performs the same operation as choosing Expand > All Rows. Expand > First GroupTo expand the number of rows displayed by the Event Viewer, you can click Expand > First Group from the Rows pull-down menu. This option expands the fields to the first field that causes more rows to be displayed. Note When expanding columns in your Event Viewer, you will eventually increase the number of row entries being displayed. The count field shows you how many entries are consolidated into a single row in the Event Viewer. This consolidation is based on the columns that are currently expanded. As you expand fields, fewer of the alarm entries will have the same values for all of the expanded columns. When you expand all of the columns, each row will probably represent only one alarm entry (count equal to 1) since it is unlikely that two separate alarm entries will have the exact same values for every column. Note Expanded rows are not a persistent change. This means that closing the Event Viewer and re-opening it will bring back the default settings and expansion boundary. Expand > All RowsExpanding an alarm entry one group at a time can be tedious, especially if the column that you are interested in is many fields away. In one click you can expand all of the fields for the currently selected row. To expand all of the columns for the current alarm entry, select Expand > All Columns from the Rows pull-down menu. Note Expanded rows are not a persistent change. This means that closing the Event Viewer and re-opening it will bring back the default settings and expansion boundary. Suspending and Resuming New EventsSometimes you may want to freeze the Event Viewer display and temporarily display no more alarms. This might happen during a flood of alarms. If alarms keep updating the Event Viewer, you may have difficulty analyzing what is happening. At that point, it is nice to freeze your Event Viewer window so that you can investigate the alarms that you already have in your window. Security Monitor provides you the capability to suspend the Event Viewer from displaying new alarms. To suspend the Event Viewer, choose Suspend New Events from the Events pull-down menu. (See Figure 10-21.) To resume alarms, choose Resume New Events from the Events pull-down menu. Only one of the options is available at a time. For instance, when you have suspended alarms, the resume option becomes available (it is no longer grayed out). Furthermore, suspending alarms does not prevent new alarms from being added to the Security Monitor database; it only prevents them from being displayed in your current Event Viewer. Figure 10-21. Events Pull-Down Menu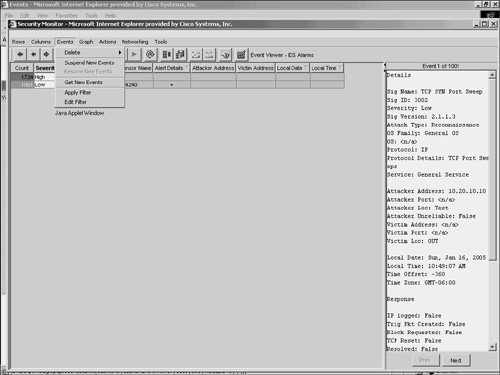 Changing Display PreferencesThis section describes the different preference settings that you can use to customize the Event Viewer. To access the Preferences window, choose Tools > Options. This will display the Preferences window. (See Figure 10-22.) Figure 10-22. Event Viewer Preferences Window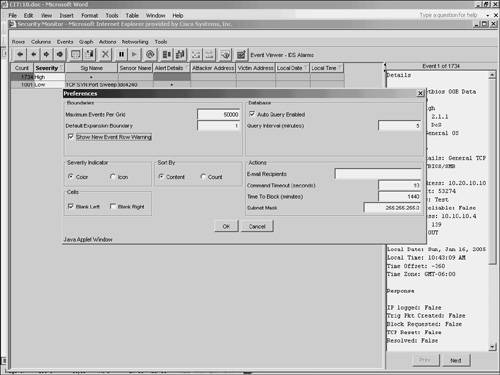 The settings available in this window fall into six basic categories:
ActionsThe Actions group box in the Preferences window (see Figure 10-22) allows you to set the following parameters:
The Command Timeout value determines how long (in seconds) the Event Viewer will wait for a response from the sensor before it concludes that it has lost communication with the sensor. In most cases, you will not need to modify this value. If you find that you are experiencing frequent command timeout errors, you might consider increasing the Command Timeout value or diagnosing the reason your Event Viewer is experiencing such a slow response time. The Command Timeout value applies to all functions that require communication through the PostOffice infrastructure. For example, functions such as retrieving sensor statistics, viewing sensor block lists, and requesting that the sensor block a particular IP address all must be completed during the specified Command Timeout period. This timeout value is not used for non-PostOffice functions, such as DNS queries. The default value is 10 seconds, with an allowable range between 1 and 3600 seconds (one hour). The Time To Block value specifies how long (in minutes) the sensor blocks traffic from the specified source when you issue a Block command from the Event Viewer. The block duration value that can be specified for the sensor in the Network Topology tree (NTT) applies only to blocks that are generated automatically by that sensor. The Time To Block value in the Preferences dialog box applies only to manually generated blocks from the Event Viewer. The default value is 1440 minutes (one day). The allowable range is from 1 to 525,600 minutes (one year). The Subnet Mask value is used to define the network portion of the IP address that will be used to block a range of addresses. Your sensors use this information when they publish a blocking rule to the blocking devices on your network. The Subnet Mask is applied only to the Block > Network and Remove Block > Network options from the Event Viewer. The default value is 255.255.255.0 and represents a class C address range. CellsThe Blank Left and Blank Right check boxes in the Cells section of the Preferences window enable you to specify whether certain cells will be blank or filled in (see Figure 10-22). When you choose the Blank Left check box, you can control whether values that are suggested by a cell above a row are filled in on following rows in the Event Viewer. For example, consider the following alarms triggered by the same source IP address of 172.30.4.150: WWW perl interpreter attack, WWW IIS view source attack, and WWW IIS newdsn attack. If the Blank Left box is selected, the grid appears as follows:
If the Blank Left box is not selected, the grid appears as follows:
When you choose Blank Right, you can control how the collapsed cells are displayed in the Event Viewer. When cells are collapsed their background color is gray. If the collapsed values are different, a plus sign is displayed. When Blank Right is selected, a plus sign is displayed in a collapsed cell regardless of whether or not the cell values are different. The default setting is for Blank Right to be unselected. In this state, a plus sign is displayed in collapsed cells only if the values in the cells differ. If the values in the collapsed cell are the same, the actual value is displayed in the Event Viewer. Sort ByThe Sort By group box in the Preferences window (see Figure 10-22) enables you to specify how the events are sorted in the Event Viewer. You can choose from the following two options:
When you choose to sort by count, the entries in the Event Viewer are sorted by the count of alarms listed in the first column of each row. If you sort by content, the entries in the Event Viewer are sorted alphabetically by the first field that is unique (starting with the far left field and moving to the right until a differing field value is found). BoundariesThe Boundaries group box in the Preferences window (see Figure 10-22) enables you to set the following values:
The Default Expansion Boundary value specifies the default number of columns in which the cells of a new event are expanded. By default, only the first field of an event is expanded. Note The expansion boundary is the block of columns that will be automatically expanded when a new alarm entry comes into the table. The block of columns is contiguous and starts at the first column in the Event Viewer. By default the expansion boundary expands the first field of an alarm entry. When setting a new expansion boundary, you have to specify only the number of columns to be expanded. All columns from the first column to the column count that you specify will be expanded for new alarm entries. The Maximum Events per Grid defines the maximum number of alarms that can be displayed in a single Event Viewer. When the maximum value is reached, an error message is displayed. The default value is 50,000 alarms. Severity IndicatorThere are two event Severity Indicator options that you can select from (see Figure 10-22):
The default setting uses colors to indicate severity in the Event Viewer. The color affects the background of the Count field. The following colors are used to indicate alarm severity:
Besides the default color severity indicator, you can also choose to display the severity of your alarms by using icons. The icons used to display alarm severity are the following:
DatabaseThe Database group box in the Preferences window (see Figure 10-22) enables you configure whether the Event Viewer automatically retrieves new events from the Security Monitor database. If you check the Auto Query Enabled check box, you can configure how often the Event Viewer automatically retrieves events from the Security Monitor database. Note You can manually retrieve new events from the Security Monitor database by selecting Get New Events from the Events pull-down menu. Creating GraphsYou can create graphs of the data, or a subset of the data, shown in Event Viewer. These graphs represent a static snapshot of the information and are not updated dynamically. You can choose from the following two types of graphs on the Graphs pull-down menu (see Figure 10-23):
Figure 10-23. Event Viewer Graph Options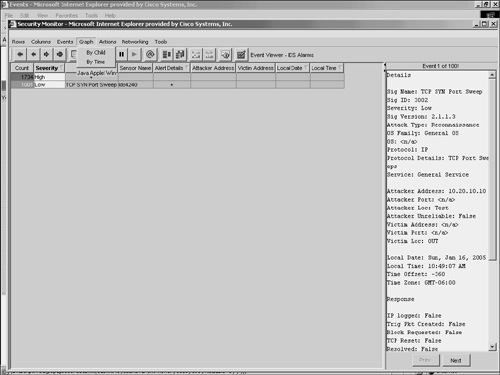 By ChildTo see the distribution of children events, select By Child from the Graphs pull-down menu. The graph displays the children events (the events in the column to the right of the selected node) across the X-axis and the number of occurrences along the Y-axis. Event severity is indicated by the color of the bar. By TimeTo see how the selected events are distributed over time, select By Time from the Graphs pull-down menu. The graph displays along the X-axis the range of time over which the event occurred and along the Y-axis the number of occurrences. Event severity is indicated by the color of the bar. Tools Pull-Down Menu OptionsSelecting the Tools pull-down menu in the Event Viewer enables you to access the following items:
ExplanationSelecting Explanation from the Tools pull-down menu displays the Network Security Database (NSDB) entry for the highlighted alert. The NSDB is the Cisco HTML-based encyclopedia of network-vulnerability information. You can examine the NSDB for information on a specific alarm. The Cisco Secure Encyclopedia (CSEC) is the online equivalent of the NSDB. Note Unlike IPS Device Manager (IDM), which requires Internet access to retrieve NSDB information, the CiscoWorks VPN/Security Management Solution (VMS) provides the NSDB information as part of the software package. Therefore, NSDB information can be viewed without Internet access. CSEC has been developed as a central warehouse of security knowledge to provide Cisco security professionals with an interactive database of security vulnerability information. CSEC contains detailed information about security vulnerabilities such as countermeasures, affected systems and software, and Cisco Secure products that can help you test for vulnerabilities or detect when malicious users attempt to exploit your systems. The CSEC can be found at http://www.cisco.com/go/csec. Trigger PacketFor many signatures it is helpful to capture the initial traffic that caused the signature to fire. Cisco IPS enables signatures to capture the actual trigger packet for its signatures. Selecting Trigger Packet from the Tools pull-down menu displays the trigger packet for the signature (if the signature is configured to capture it). IP LogsOne of the actions that a signature can initiate is IP logging. This action captures raw packets for a connection so that you can analyze them. To view the IP log information using Security Monitor, you highlight the alarm that contains the IP log information and then select IP Log from the Tools pull-down menu. StatisticsYou can view event statistics for a row in Event Viewer. The statistics include the following information:
To access the statistics for a specific row, you select the row by clicking on a field in the row. Then you click on Statistics from the Tools pull-down menu. A pop-up window appears in the content area, indicating the statistics (see Figure 10-24). Figure 10-24. Event Statistics Popup Window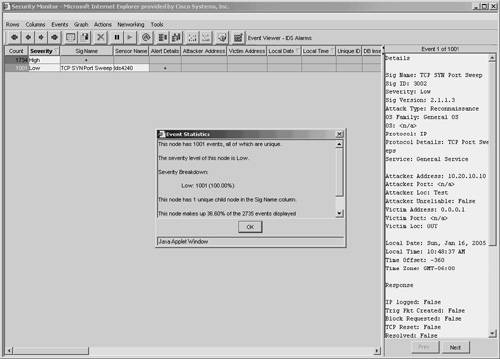 OptionsSelecting Options from the Tools pull-down menu enables you to configure preference settings that you can use to customize the Event Viewer. Configuring these options has already been explained in the "Changing Display Preferences" section earlier in the chapter. Resolving Host NamesBy default, the alerts stored by the Event Viewer indicate the IP addresses of the systems involved in the event. Using the Resolve option from the Actions pull-down menu, you can cause the Event Viewer to attempt to resolve the host names for the IP addresses in the selected alerts. Note Since a single row can represent multiple alarms, it may take the Event Viewer a significant amount of time to resolve all of the IP addresses. If you attempt to resolve a large number of alerts, a warning pop-up window will appear in the content area, indicating that your request could take several minutes to complete. Security Monitor AdministrationAlthough a large percentage of your time will be spent using the Event Viewer functionality of Security Monitor, there are also various tasks that you may need to perform to administer and maintain your Security Monitor software. Security Monitor server administration and maintenance tasks fall into the following categories:
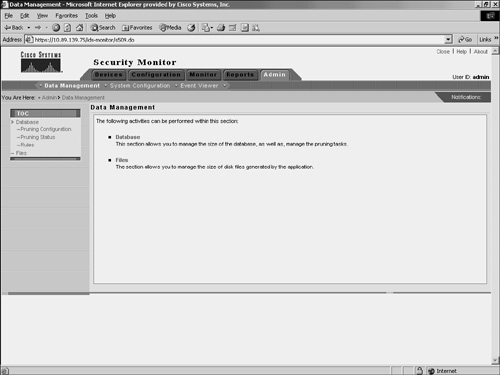
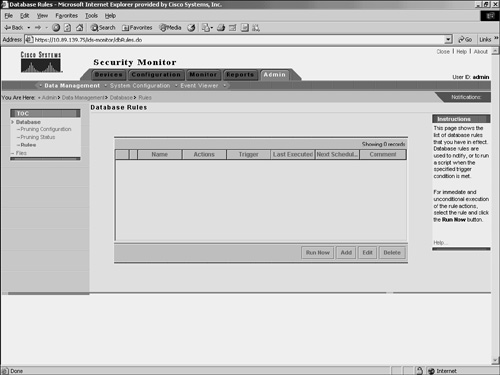
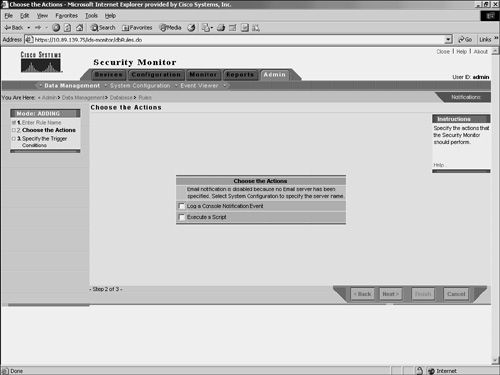
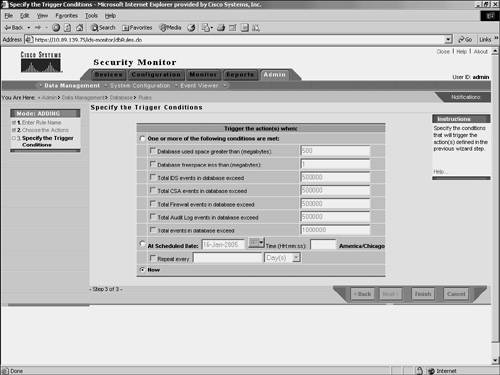
Data ManagementWhen the Security Monitor database becomes large, system performance may begin to degrade. How large the database can become depends upon many factors, including system specifications and the number and types of applications running on the system. Using database rules, you can automatically manage the size of your database, send e-mail notifications, log a console notification event, or execute a script when specific thresholds or intervals are met. Database thresholds may be reached, for example, if the database exceeds a certain size or if the database receives more than a defined number of events. By defining custom database rules, you can keep your Security Monitor database working at its peak efficiency. To add your own custom database rule, perform the following steps:
System Configuration SettingsSelecting Admin > System Configuration enables you to configure the following communication properties:
The IP Log Archive Location enables you to specify the location on the system where the IP log information for the alerts will be stored. For Windows, the default location is C:\PROGRA~1\ CSCOpx\MDC\secmon\iplogs. The E-mail Server enables you to configure its properties and to specify the e-mail server that Security Monitor uses for event notifications. PostOffice Settings enables you to specify the settings used to establish the communication infrastructure between Security Monitor and Cisco IDS version 3.x IDS devices. Syslog Settings enables you to specify the port that Security Monitor uses to monitor syslog messages along with the IP address and port that it will send syslog messages to if you choose to forward syslog messages. The DNS Settings option enables you to configure whether DNS lookups are performed in the following two situations:
When the database is pruned, the information is archived on the hard disk of the system. The Prune Archive Location option enables you to specify the location at which this pruned database information will be stored. In Windows, the default location is C:\PROGRA~1\CSCOpx\ MDC\secmon\AlertPruneData. Attackers are continually developing new attacks to launch against your network. Therefore, it is important that you keep your signature definitions as current as possible. Using the Automatic Signature Download option, you can configure how often Security Monitor checks for new signature updates from either Cisco.com or your own local server. Note Although the option is titled "Automatic Signature Download," it can be used to retrieve signature updates as well as service packs for your sensors. Defining Event Viewer PreferencesWhen working in the Event Viewer, you can configure your Event Viewer preferences (see the "Changing Display Preferences" section earlier in this chapter). Some of the changes, however, such as setting the default expansion boundary, are not persistent and are lost whenever you close the Event Viewer. If you want your preferences to be applied every time you open the Event Viewer, you need to change the Event Viewer preferences by using the administration options. Administratively, you can configure your Event Viewer preferences by using the following three options:
After choosing Your Preferences, you can configure you own personal display preferences. These changes will apply only to the user account in which you are currently logged in to Security Monitor. These options enable you to customize the Event Viewer to your personal preferences. The Default Preferences option, on the other hand, changes the default display settings for all users. You can use this option to establish display preferences from which all users will benefit. After choosing Users, you can view the list of users who have event-viewing preferences stored in the database. Security Monitor ReportsSecurity Monitor enables you to generate reports based on the audit and alarm information collected by Security Monitor. These reports can be generated immediately, or you can schedule them to be generated later. Although you can create your own custom report templates, Security Monitor provides the following predefined report templates for IDS alarms:
Creating a report using Security Monitor involves the following tasks:
Defining the ReportWhen creating an IDS report using Security Monitor, you can either create a custom report template (from scratch or by modifying an existing report template) or use one of the predefined report templates. When modifying an existing report template, you can specify the following filtering parameters (see Figure 10-29) to customize the template to your IPS/IDS reporting requirements:
Figure 10-29. Report Filtering Window Running the ReportWhen you want to generate a report, you can run the report by using one of the following two options (see Figure 10-30):
Figure 10-30. Defined Reports Window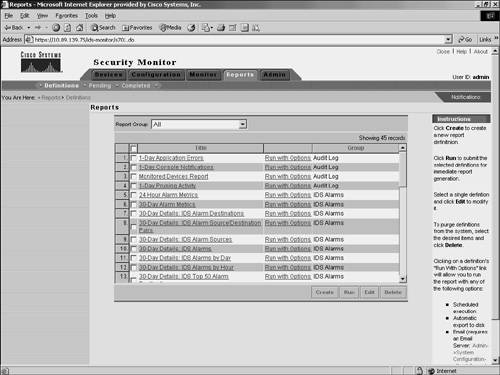 Selecting Run causes the report to be generated immediately. Selecting Run with Options enables you to schedule a report to be run or to export the report information to the VMS server (see Figure 10-31). Figure 10-31. Run with Options Window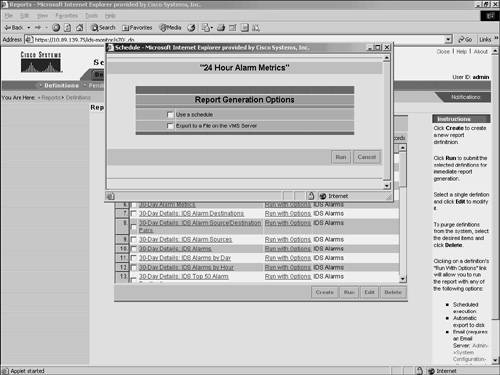 When scheduling an IDS report to run using Security Monitor, you need to specify the following parameters (see Figure 10-32):
Figure 10-32. Schedule Report Window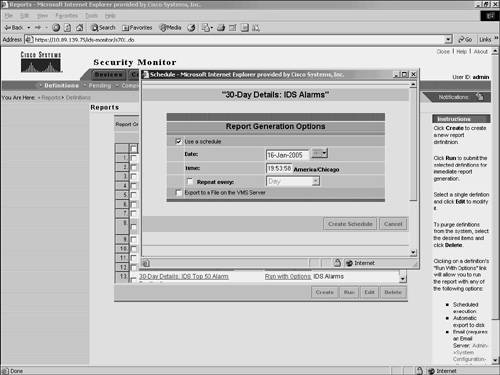 Viewing the ReportAfter generating your reports, you can view them by choosing Reports > Completed. This displays the Choose Completed Report window in the content area (see Figure 10-33). Figure 10-33. Choose Completed Report Window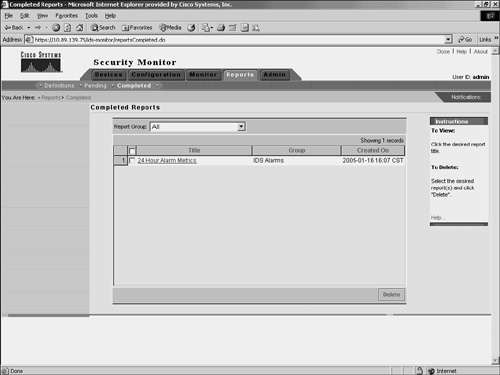 To view a report that you have generated, click on the name of the report that you want to view. The report is then displayed in a new browser window (see Figure 10-34). Figure 10-34. 24-Hour Alarm Metrics Report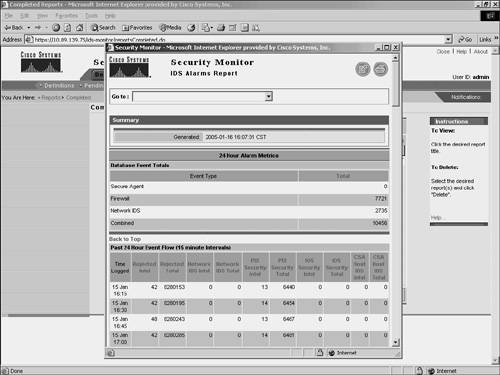 |
EAN: 2147483647
Pages: 119